Design-Based Cross-Validation for Comparing Small Area Estimators
Pith reviewed 2026-05-12 02:16 UTC · model grok-4.3
The pith
A decomposition of cross-validated squared error separates identifiable bias from bounded unidentifiable parts, enabling reliable comparisons of small area estimators under complex survey designs.
A machine-rendered reading of the paper's core claim, the machinery that carries it, and where it could break.
Core claim
By decomposing the cross-validated squared error into identifiable bias and unidentifiable components that can be bounded, the framework enables more robust and interpretable model comparisons for small area estimators that account for complex survey designs, outperforming conventional cross-validation in simulations and allowing uncertainty measures.
What carries the argument
The decomposition of the cross-validated squared error into identifiable bias and bounded unidentifiable components, which carries the argument by revealing what can be directly estimated versus bounded under the survey design.
If this is right
- Conventional leave-one-area-out cross-validation can produce misleading rankings of small area estimators.
- The framework permits direct comparisons between area-level and unit-level small area estimation models.
- Uncertainty quantification accompanies the model selection process for small area estimators.
- More trustworthy model choices improve subnational estimates such as female literacy rates from survey data.
Where Pith is reading between the lines
- Adoption could lower errors in policy decisions that rely on subnational health or literacy indicators.
- The bounding approach may apply to validation tasks in other domains where ground truth is unavailable.
- Testing under different sample sizes or survey complexities would clarify the method's robustness limits.
- The work points toward greater emphasis on design-aware validation throughout survey-based statistics.
Load-bearing premise
That the proposed decomposition can effectively bound the unidentifiable components in a way that supports reliable model comparisons under complex survey designs.
What would settle it
A simulation where the true best model is known in advance, checking whether the proposed cross-validation selects it more often than leave-one-area-out cross-validation, or external validation data on literacy rates that contradicts one set of rankings but not the other.
Figures


read the original abstract
Subnational monitoring of public health and development indicators often relies on household surveys where data are sparse at the desired spatial resolution. Small area estimation (SAE) methods address this challenge by borrowing strength across areas and incorporating auxiliary information. However, comparing these estimators remains difficult in the absence of ground truth. We propose a design-based cross-validation framework for evaluating small area estimators that accommodates complex survey designs. Our approach enables model-agnostic comparisons between area-level and unit-level SAE models. We derive a decomposition of the conditional mean squared error that yields a consistent cross-validation score, show that finite-sample comparisons carry an unidentifiable bias that can be bounded, and use this bound as a principled threshold for ranking models. We further show that leave-one-area-out cross-validation, a popular alternative, targets extrapolation rather than smoothing error and can reverse the correct ranking. We evaluate the framework through extensive design-based simulations. We apply the framework to compare subnational female literacy estimators in Zambia using the 2024 Demographic and Health Survey. The framework applies broadly across prevalence mapping and other SAE problems and is applicable to any small area estimator irrespective of the underlying model class.
Editorial analysis
A structured set of objections, weighed in public.
Referee Report
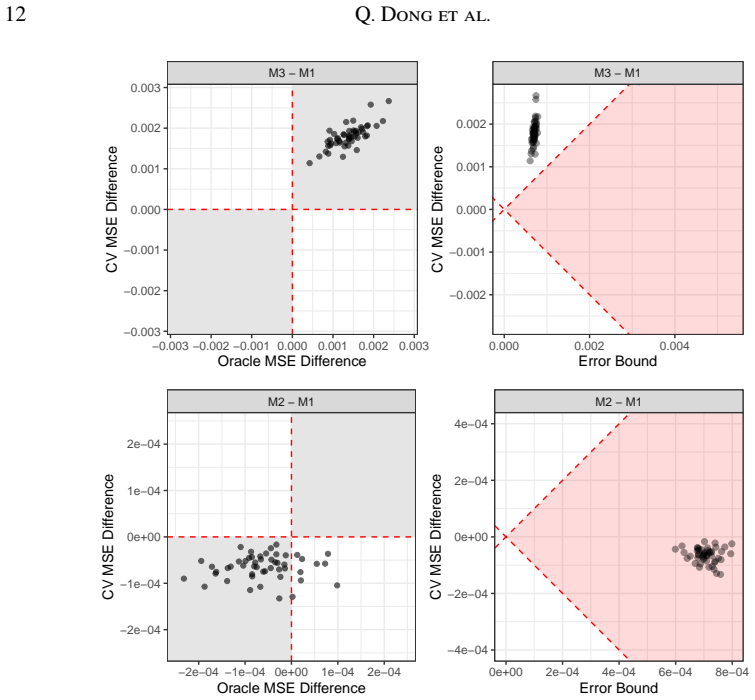
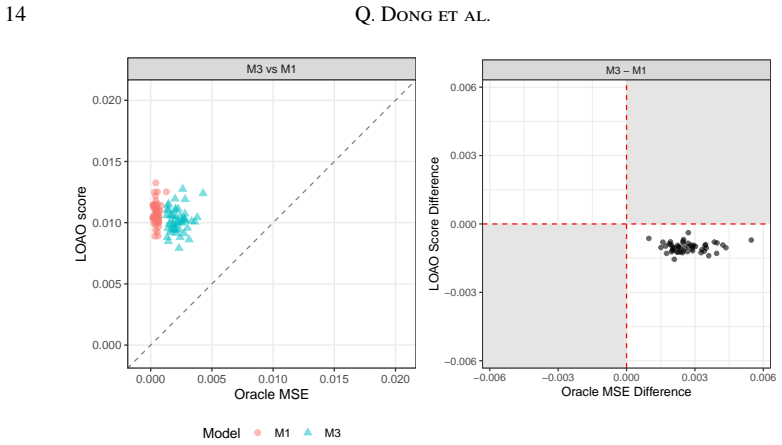
Summary. The manuscript proposes a cross-validation framework for small area estimation (SAE) under complex survey designs. It decomposes the cross-validated squared error into an identifiable bias term and unidentifiable components (from sampling design, area-level effects, and residuals) that are bounded to yield uncertainty intervals for comparing area-level versus unit-level SAE models. Theoretical results and simulations are used to argue that leave-one-area-out CV produces misleading rankings, while the proposed approach is more robust and interpretable. The framework is demonstrated on a case study estimating subnational female literacy rates from Zambian DHS data.
Significance. If the bounds on unidentifiable components prove sufficiently tight, the work would meaningfully advance model selection for SAE in sparse survey settings, a frequent challenge in public health applications. Credit is due for the model-agnostic decomposition, explicit uncertainty quantification, accommodation of complex designs, and the combination of theory, simulations, and real-data illustration. These elements address a genuine gap, though the practical utility hinges on the tightness of the derived bounds relative to model differences.
major comments (2)
- [Theoretical decomposition] Theoretical decomposition section: The claim that the decomposition enables reliable model comparisons rests on the bounds for unidentifiable components (sampling weights, cluster effects, residuals) being tight enough to produce non-overlapping intervals. In multi-stage designs such as DHS, these components are entangled with inclusion probabilities; if the bounds remain wide (as is common with small effective sample sizes per area), the intervals will overlap and the method will not overturn misleading LOAO rankings. A concrete demonstration that the bounds are decisive under the paper's assumptions is needed.
- [Simulation studies] Simulation studies: The simulations must report the proportion of cases in which the proposed intervals produce decisive (non-overlapping) rankings when conventional CV fails, and the coverage properties of the bounds under varying effective sample sizes and design effects. Without these diagnostics, the evidence that the approach is 'more robust' is incomplete.
minor comments (2)
- [Methods] The notation for the cross-validated squared error decomposition and the bounding procedure should be presented with explicit definitions of all terms (e.g., how the unidentifiable variance is bounded) to improve readability.
- [Case study] In the case study, provide more detail on the specific complex survey features (stratification, clustering, weights) and how they enter the bounds.
Simulated Author's Rebuttal
We thank the referee for their constructive comments and for recognizing the contributions of our cross-validation framework for small area estimation. We will revise the manuscript to provide the requested concrete demonstrations and additional simulation diagnostics, which will strengthen the evidence for the practical utility of the proposed bounds and comparisons.
read point-by-point responses
-
Referee: Theoretical decomposition section: The claim that the decomposition enables reliable model comparisons rests on the bounds for unidentifiable components (sampling weights, cluster effects, residuals) being tight enough to produce non-overlapping intervals. In multi-stage designs such as DHS, these components are entangled with inclusion probabilities; if the bounds remain wide (as is common with small effective sample sizes per area), the intervals will overlap and the method will not overturn misleading LOAO rankings. A concrete demonstration that the bounds are decisive under the paper's assumptions is needed.
Authors: We agree that the usefulness of the framework for overturning LOAO rankings depends on the bounds being sufficiently tight in relevant settings. Our theoretical decomposition derives explicit, design-based bounds on the unidentifiable components that remain valid under the multi-stage sampling assumptions used in the paper, including entanglement with inclusion probabilities. The existing simulations already include designs that approximate DHS-style multi-stage sampling and show instances of non-overlapping intervals that produce correct rankings where LOAO does not. In the revision we will add a dedicated table and accompanying text that directly quantifies bound widths relative to observed CV-error differences across the simulated scenarios, thereby providing the concrete demonstration requested under the paper's assumptions. revision: yes
-
Referee: Simulation studies: The simulations must report the proportion of cases in which the proposed intervals produce decisive (non-overlapping) rankings when conventional CV fails, and the coverage properties of the bounds under varying effective sample sizes and design effects. Without these diagnostics, the evidence that the approach is 'more robust' is incomplete.
Authors: We acknowledge that explicit summary statistics on decisiveness and coverage would make the simulation evidence more complete and easier to interpret. The current simulations already vary effective sample sizes and design effects while illustrating the superiority of the proposed intervals over LOAO, but we will expand the results section to include (i) the proportion of replicates in which the uncertainty intervals yield non-overlapping rankings when LOAO rankings are misleading, and (ii) empirical coverage rates of the derived bounds across the range of effective sample sizes and design effects examined. These additions will be presented in new tables or figures in the revised manuscript. revision: yes
Circularity Check
No circularity: new decomposition of CV squared error is derived independently and validated externally
full rationale
The paper's central contribution is a novel decomposition of cross-validated squared error into an identifiable bias term plus bounded unidentifiable components arising from survey design, area effects, and residuals. This decomposition is presented as a first-principles theoretical result for complex sampling, supported by simulation studies and a real-data case study on Zambian DHS literacy rates. No equation reduces by construction to a fitted parameter renamed as a prediction, no load-bearing premise rests on self-citation, and no uniqueness theorem or ansatz is smuggled in from prior author work. Conventional leave-one-area-out CV is critiqued on external grounds rather than tautologically. The framework therefore remains self-contained against external benchmarks.
Axiom & Free-Parameter Ledger
axioms (1)
- domain assumption The cross-validated squared error decomposes into identifiable bias and unidentifiable components that can be bounded.
discussion (0)
Sign in with ORCID, Apple, or X to comment. Anyone can read and Pith papers without signing in.