A Nine-Compartment Nonlinear Epidemic Model with Spline-Based Identification of Time-Varying Transmission and Vaccination Dynamics: Application to the COVID-19 Third Wave in Italy
Pith reviewed 2026-06-27 21:07 UTC · model grok-4.3
The pith
A nine-compartment model with spline-fitted time-varying rates reproduces Italian COVID-19 third wave data and establishes conditions for epidemic decay.
A machine-rendered reading of the paper's core claim, the machinery that carries it, and where it could break.
Core claim
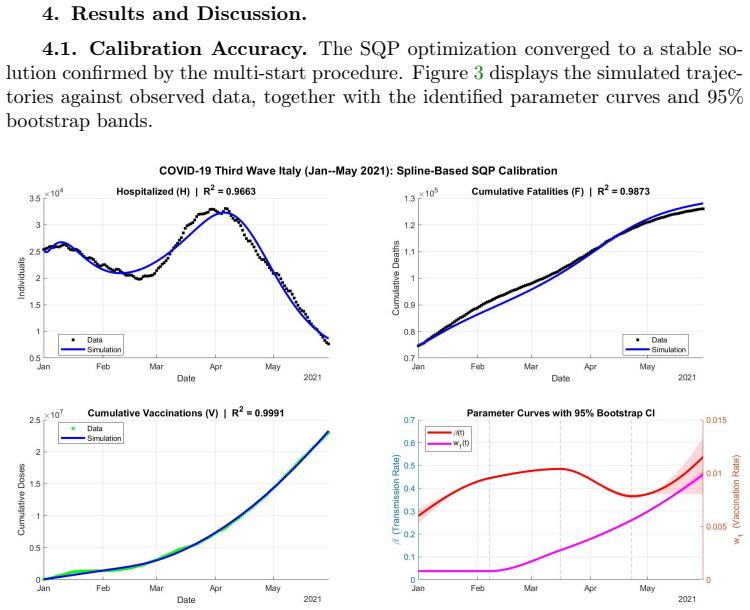
After calibration the model reproduces active hospitalizations (R^2=0.966), cumulative fatalities (R^2=0.987), and cumulative vaccinations (R^2=0.999); the disease-free equilibrium is globally asymptotically stable when the effective reproduction number remains below one, and a sufficient threshold condition proves epidemic decay under persistent time-varying suppression; sensitivity consistently ranks hospital-related parameters above transmission rate, showing that reactive containment cannot prevent a hospitalization peak once the pre-existing latent viral load is fixed.
What carries the argument
PCHIP control-node parameterization of the time-varying transmission and vaccination rates, which converts their identification into a fourteen-variable SQP problem inside the nine-compartment structure.
If this is right
- Whenever the effective reproduction number remains persistently below one the epidemic decays to the disease-free equilibrium.
- Hospital throughput parameters exert stronger influence on outcomes than the transmission rate itself.
- Reactive containment measures cannot avert an already-determined hospitalization peak driven by pre-existing latent infections.
- The PCHIP parameterization converges to the true time-varying functions at rate O(h^2) as node spacing vanishes.
Where Pith is reading between the lines
- The same spline-based identification procedure could be applied to other countries or later epidemic waves with comparable data.
- Policy emphasis could shift toward hospital capacity expansion rather than broad transmission suppression once the sensitivity ranking is accepted.
- Direct testing of the threshold condition could be performed with data from subsequent waves or different interventions.
Load-bearing premise
The time-varying transmission and vaccination rates are accurately represented by the PCHIP control-node parameterization and the January-May 2021 Italian data accurately reflects the underlying dynamics without major reporting or testing biases.
What would settle it
If the epidemic fails to decay after the effective reproduction number remains persistently below one for a sustained interval, or if out-of-sample predictions from the fitted model diverge substantially from later observed hospitalization and fatality counts.
Figures
read the original abstract
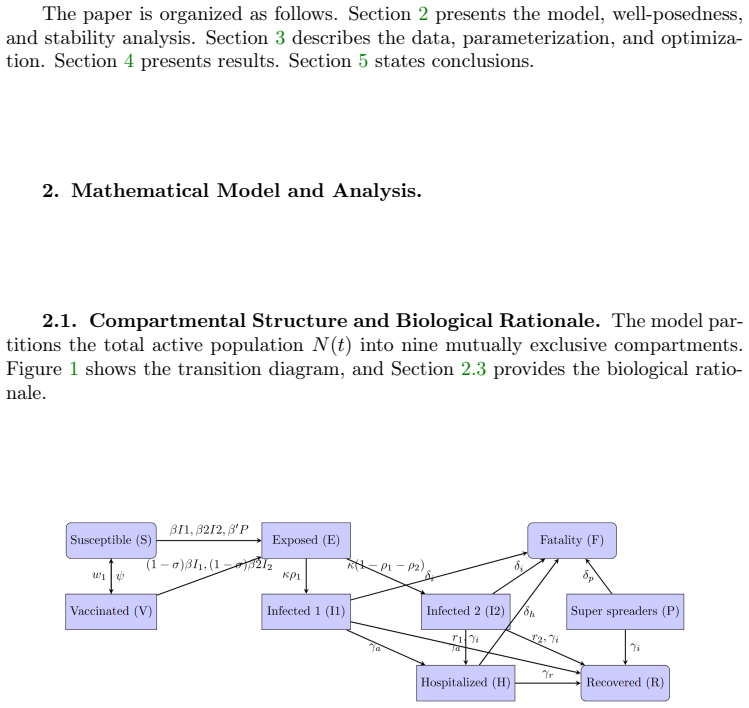
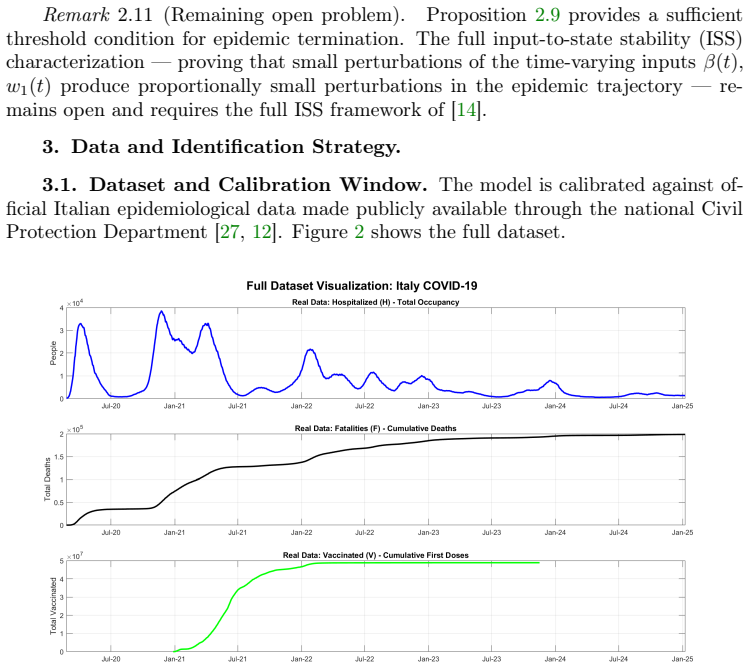
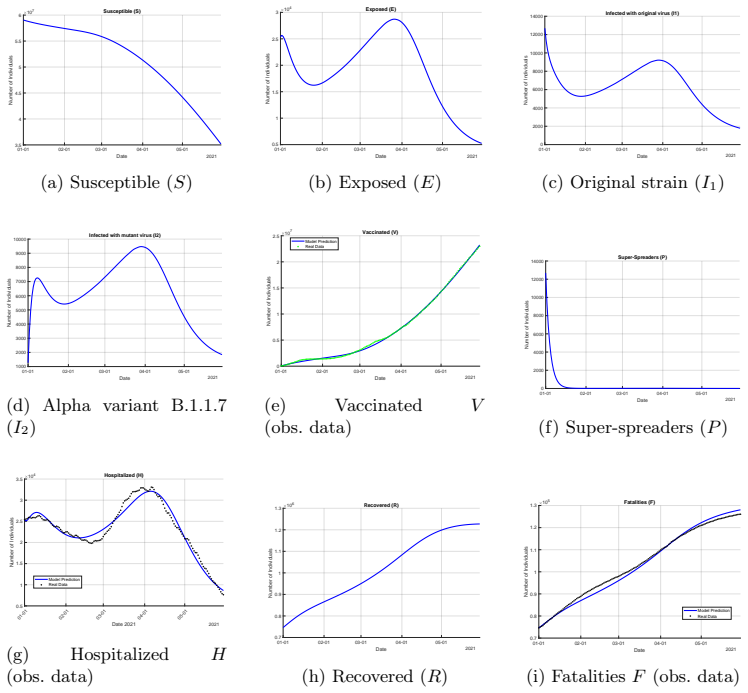
We develop a nine-compartment nonlinear epidemic model incorporating two co-circulating viral strains (ancestral I1 and the Alpha variant B.1.1.7 I2, which is 43-90% more transmissible, c2=1.5), a super-spreader subpopulation, partial vaccine-induced immunity with waning, and explicit hospitalization dynamics with differentiated mortality. Transmission and vaccination rates are treated as time-varying control inputs and identified from Italian COVID-19 data (January-May 2021) via a Piecewise Cubic Hermite Interpolating Polynomial (PCHIP) control-node parameterization, reducing calibration to a fourteen-variable Sequential Quadratic Programming (SQP) problem with monotonicity and box constraints. A parametric bootstrap (n=1000) quantifies parameter uncertainty. The calibrated model achieves R^2=0.966 for active hospitalizations, R^2=0.987 for cumulative fatalities, and R^2=0.999 for cumulative vaccinations. Well-posedness, the basic reproduction number in closed form, and local and global stability of the disease-free equilibrium are established analytically. An L-infinity approximation error bound shows that the PCHIP control-node parameterization converges to the true time-varying parameters at rate O(h^2) as the node spacing vanishes. Local identifiability and a noise stability bound are established via the Fisher information matrix. A sufficient threshold condition proves epidemic decay under time-varying suppression whenever the effective reproduction number remains persistently below one. Sensitivity analyses consistently rank hospital throughput parameters above the transmission rate, providing a mathematical basis for the observation that reactive containment measures cannot prevent a hospitalization peak already driven by the pre-existing latent viral load.
Editorial analysis
A structured set of objections, weighed in public.
Referee Report
Summary. The manuscript develops a nine-compartment nonlinear epidemic model incorporating two co-circulating strains (ancestral and Alpha variant with c2=1.5), a super-spreader subpopulation, waning vaccine-induced immunity, and differentiated hospitalization/mortality compartments. Transmission and vaccination rates are treated as time-varying inputs identified from Italian COVID-19 data (January-May 2021) via PCHIP control-node parameterization, reducing calibration to a 14-variable constrained SQP problem. The calibrated model reports R²=0.966 for active hospitalizations, R²=0.987 for cumulative fatalities, and R²=0.999 for cumulative vaccinations. Analytical contributions include well-posedness, closed-form basic reproduction number, local/global stability of the disease-free equilibrium, an L∞ error bound of O(h²) for the PCHIP approximation, Fisher-information-based local identifiability and noise stability, a sufficient threshold condition for epidemic decay when the effective reproduction number stays below one, and sensitivity analysis ranking hospital-throughput parameters above transmission rate.
Significance. If the analytical derivations and calibration hold, the work supplies a mathematically rigorous multi-strain compartmental framework with explicit time-varying control identification, stability thresholds, and identifiability results that could support policy analysis of containment timing and hospital capacity. The sensitivity ranking and threshold condition offer concrete, testable implications beyond standard models.
major comments (3)
- [Abstract/Results] Abstract and calibration/results sections: The reported R² values (0.966, 0.987, 0.999) are obtained by optimizing the 14 SQP parameters directly to the same dataset used for evaluation; this renders the metrics tautological by construction and does not establish out-of-sample predictive validity or robustness to data biases.
- [Model formulation/Calibration] Model formulation and calibration sections: The claim that the PCHIP parameterization with 14 variables and monotonicity/box constraints accurately recovers the underlying time-varying rates rests on the unverified assumption that Italian reporting data (January-May 2021) contain no major testing or ascertainment biases; no cross-validation or alternative parameterization comparison is described to support this.
- [Stability/Threshold analysis] Stability and threshold sections: The local/global stability proofs and the sufficient condition for decay (effective reproduction number persistently below one) are derived in terms of the fitted time-varying parameters; it is unclear whether the parametric bootstrap (n=1000) uncertainty propagates to alter the threshold or stability conclusions.
minor comments (2)
- [Model formulation] Clarify the precise mapping from the stated 43-90% transmissibility increase to the fixed value c2=1.5 and whether this parameter is held constant or allowed to vary.
- [Error bound/Identifiability] The L∞ error bound and Fisher-information steps are stated as routine but would benefit from explicit equation references or a short appendix derivation to aid verification.
Simulated Author's Rebuttal
We thank the referee for the thorough and constructive comments. We address each major comment below, clarifying the manuscript's scope and indicating where revisions will strengthen the presentation.
read point-by-point responses
-
Referee: [Abstract/Results] Abstract and calibration/results sections: The reported R² values (0.966, 0.987, 0.999) are obtained by optimizing the 14 SQP parameters directly to the same dataset used for evaluation; this renders the metrics tautological by construction and does not establish out-of-sample predictive validity or robustness to data biases.
Authors: The reported R² values are in-sample goodness-of-fit measures obtained directly from the SQP calibration on the January-May 2021 data. The manuscript's primary aim is to show that the nine-compartment model with constrained PCHIP parameterization can reproduce the observed trajectories and to derive its analytical properties; no out-of-sample predictive claims are made. We will revise the abstract and results sections to state explicitly that these are calibration fits and to distinguish them from predictive validation. revision: yes
-
Referee: [Model formulation/Calibration] Model formulation and calibration sections: The claim that the PCHIP parameterization with 14 variables and monotonicity/box constraints accurately recovers the underlying time-varying rates rests on the unverified assumption that Italian reporting data (January-May 2021) contain no major testing or ascertainment biases; no cross-validation or alternative parameterization comparison is described to support this.
Authors: The PCHIP control-node approach with monotonicity and box constraints was chosen to produce smooth, plausible rate trajectories while keeping the inverse problem tractable. The calibration uses the reported Italian data without explicit bias correction, an assumption common to compartmental studies. No cross-validation or alternative spline comparisons were performed. We will add a limitations paragraph in the calibration section acknowledging the data-fidelity assumption and the absence of cross-validation. revision: partial
-
Referee: [Stability/Threshold analysis] Stability and threshold sections: The local/global stability proofs and the sufficient condition for decay (effective reproduction number persistently below one) are derived in terms of the fitted time-varying parameters; it is unclear whether the parametric bootstrap (n=1000) uncertainty propagates to alter the threshold or stability conclusions.
Authors: The stability proofs and sufficient decay condition are established analytically for the deterministic system evaluated at the calibrated point estimates. The parametric bootstrap quantifies uncertainty in the 14 nodes but was not propagated through the threshold analysis. We will revise the stability section to clarify that the results apply to the fitted trajectories and that bootstrap-based robustness checks of the threshold remain future work. revision: partial
Circularity Check
No significant circularity
full rationale
The paper's core analytical results (well-posedness, closed-form R0, local/global stability of DFE, L-infinity PCHIP error bound, Fisher-information identifiability, and threshold condition for decay when Reff<1) are derived from the model structure and standard Lyapunov/Fisher techniques once the 9-compartment ODE system and PCHIP parameterization are accepted; these steps do not reduce to the fitted values by construction. The reported R2 values are explicitly calibration metrics obtained by SQP optimization to the January-May 2021 Italian data and are not presented as out-of-sample predictions or first-principles results. No self-citation chain, self-definitional loop, or renaming of known results is load-bearing for the claimed theorems. The derivation chain remains self-contained against external mathematical benchmarks.
Axiom & Free-Parameter Ledger
free parameters (2)
- 14 SQP optimization variables
- c2=1.5
axioms (2)
- domain assumption The epidemic dynamics can be accurately described by a system of nonlinear ordinary differential equations with the specified nine compartments and transitions.
- standard math The PCHIP control-node parameterization with monotonicity constraints approximates the true time-varying functions with O(h^2) error as node spacing vanishes.
invented entities (2)
-
Super-spreader subpopulation
no independent evidence
-
Differentiated hospitalization and mortality compartments
no independent evidence
Reference graph
Works this paper leans on
-
[1]
S. Audoly, G. Bellu, L. D’Angiò, M. P. Saccomani, and C. Cobelli, Global identifi- ability of nonlinear models of biological systems, IEEE Transactions on Biomedical Engi- neering, 48 (2001), pp. 55–65, https://doi.org/10.1109/10.900248
-
[2]
Birkhoff and C
G. Birkhoff and C. de Boor, Piecewise polynomial interpolation and approximation, in Approximation of Functions, H. L. Garabedian, ed., Elsevier, Amsterdam, 1968, pp. 164– 190
1968
-
[3]
F. Brauer and C. Castillo-Chávez, Mathematical Models in Population Biology and Epi- demiology, vol. 40 of Texts in Applied Mathematics, Springer, New York, 2nd ed., 2012, https://doi.org/10.1007/978-1-4614-1686-9
-
[4]
K. P. Burnham and D. R. Anderson , Model Selection and Multimodel Inference: A Practical Information-Theoretic Approach, Springer, New York, 2nd ed., 2002, https: //doi.org/10.1007/b97636
-
[5]
M. Can, B. Othman, and E. Tekin, Mathematical modeling and analysis of COVID-19 pandemic with vaccination and mutant variants, Applied Mathematics and Computation, 465 (2024), p. 128418, https://doi.org/10.1016/j.amc.2023.128418
-
[6]
de Boor, A Practical Guide to Splines, vol
C. de Boor, A Practical Guide to Splines, vol. 27 of Applied Mathematical Sciences, Springer, New York, 1978, https://doi.org/10.1007/978-1-4612-6333-3
-
[7]
Diekmann and J
O. Diekmann and J. A. P. Heesterbeek,Mathematical Epidemiology of Infectious Diseases: Model Building, Analysis and Interpretation, vol. 5 of Wiley Series in Mathematical and Computational Biology, John Wiley & Sons, Chichester, 2000
2000
-
[8]
A. Endo, S. Abbott, A. J. Kucharski, and S. Funk, Estimating the overdispersion in COVID-19 transmission using outbreak sizes outside China, Wellcome Open Research, 5 (2020), p. 67, https://doi.org/10.12688/wellcomeopenres.15842.3
-
[9]
N. M. Ferguson, D. Laydon, G. Nedjati-Gilani, N. Imai, K. Ainslie, M. Baguelin, S. Bhatia, A. Boonyasiri, Z. Cucunubá, G. Cuomo-Dannenburg, et al., Impact of non-pharmaceutical interventions (NPIs) to reduce COVID-19 mortality and healthcare demand, tech. report, Imperial College London COVID-19 Response Team, 2020, https: //doi.org/10.25561/77482
-
[10]
S. Flaxman, S. Mishra, A. Gandy, H. J. T. Unwin, T. A. Mellan, H. Coupland, 21 C. Whittaker, H. Zhu, T. Berah, J. W. Eaton, et al., Estimating the effects of non-pharmaceutical interventions on COVID-19 in Europe, Nature, 584 (2020), pp. 257– 261, https://doi.org/10.1038/s41586-020-2405-7
-
[11]
F. N. Fritsch and R. E. Carlson, Monotone piecewise cubic interpolation, SIAM Journal on Numerical Analysis, 17 (1980), pp. 238–246, https://doi.org/10.1137/0717021
-
[12]
Giordano, F
G. Giordano, F. Blanchini, R. Bruno, P. Colaneri, A. Di Filippo, A. Di Matteo, and M. Colaneri, Modelling the COVID-19 epidemic and implementation of population- wide interventions in Italy, Nature Medicine, 26 (2020), pp. 855–860, https://doi.org/10. 1038/s41591-020-0883-7
2020
-
[13]
G. Giordano, M. Colaneri, A. Di Filippo, F. Blanchini, P. Bolzern, G. De Nico- lao, P. Sacchi, P. Colaneri, and R. Bruno, Modeling vaccination rollouts, SARS- CoV-2 variants and the requirement for non-pharmaceutical interventions in Italy, Nature Medicine, 27 (2021), pp. 993–998, https://doi.org/10.1038/s41591-021-01334-5
-
[14]
L. Grüne and J. Pannek, Nonlinear Model Predictive Control: Theory and Algorithms, Communications and Control Engineering, Springer, Cham, 2nd ed., 2017, https://doi. org/10.1007/978-3-319-46024-6
-
[15]
Guan, Z.-Y
W.-J. Guan, Z.-Y. Ni, Y. Hu, W.-H. Liang, C.-Q. Ou, J.-X. He, L. Liu, H. Shan, C.-L. Lei, D. S. C. Hui, et al., Clinical characteristics of coronavirus disease 2019 in China, New England Journal of Medicine, 382 (2020), pp. 1708–1720, https://doi.org/10. 1056/NEJMoa2002032
2019
-
[16]
X. Hao, S. Cheng, D. Wu, T. Wu, X. Lin, and C. Li , Reconstruction of the full transmission dynamics of COVID-19 in Wuhan, Nature, 584 (2020), pp. 420–424, https: //doi.org/10.1038/s41586-020-2554-8
-
[17]
H. W. Hethcote, The mathematics of infectious diseases, SIAM Review, 42 (2000), pp. 599– 653, https://doi.org/10.1137/S0036144500371907
-
[18]
W. O. Kermack and A. G. McKendrick, A contribution to the mathematical theory of epidemics, Proceedings of the Royal Society of London A, 115 (1927), pp. 700–721, https: //doi.org/10.1098/rspa.1927.0118
-
[19]
H. K. Khalil, Nonlinear Systems, Prentice Hall, Upper Saddle River, NJ, 3rd ed., 2002
2002
-
[20]
J. S. Lavine, O. N. Bjørnstad, and R. Antia, Immunological characteristics govern the transition of COVID-19 to endemicity, Science, 371 (2021), pp. 741–745, https://doi.org/ 10.1126/science.abe6522
-
[21]
J. C. Lemaitre, J. Perez-Saez, A. S. Azman, A. Rinaldo, and J. Fellay, Assessing the impact of non-pharmaceutical interventions on SARS-CoV-2 transmission in Switzerland, Swiss Medical Weekly, 150 (2020), p. w20295, https://doi.org/10.4414/smw.2020.20295
-
[22]
J. O. Lloyd-Smith, S. J. Schreiber, P. E. Kopp, and W. M. Getz, Superspreading and the effect of individual variation on disease emergence, Nature, 438 (2005), pp. 355–359, https://doi.org/10.1038/nature04153
-
[23]
M. D. Morris, Factorial sampling plans for preliminary computational experiments, Techno- metrics, 33 (1991), pp. 161–174, https://doi.org/10.1080/00401706.1991.10484804
-
[24]
F. Ndairou, I. Area, J. J. Nieto, and D. F. M. Torres, Mathematical modeling of COVID-19 transmission dynamics with a case study of Wuhan, Chaos, Solitons & Fractals, 135 (2020), p. 109846, https://doi.org/10.1016/j.chaos.2020.109846
-
[25]
J. Nocedal and S. J. Wright, Numerical Optimization, Springer, New York, 2nd ed., 2006, https://doi.org/10.1007/978-0-387-40065-5
-
[26]
A. Pan, L. Liu, C. Wang, H. Guo, X. Hao, Q. Wang, J. Huang, N. He, H. Yu, X. Lin, S. Wei, and T. Wu, Association of public health interventions with the epidemiology of the COVID-19 outbreak in Wuhan, China, JAMA, 323 (2020), pp. 1915–1923, https: //doi.org/10.1001/jama.2020.6130
-
[27]
https://github.com/pcm-dpc/COVID-19,
Presidenza del Consiglio dei Ministri – Dipartimento della Protezione Civile, COVID-19 Italia — Monitoraggio situazione. https://github.com/pcm-dpc/COVID-19,
-
[28]
A. M. Ramos, M. R. Fernández, M. Vela-Pérez, A. B. Kubik, and B. Ivorra,A simple but complex enough θ-SIR type model to be used with COVID-19 real data. Application to the case of Italy, Physica D: Nonlinear Phenomena, 421 (2021), p. 132839, https://doi. org/10.1016/j.physd.2021.132839
-
[29]
A. Raue, C. Kreutz, T. Maiwald, J. Bachmann, M. Schilling, U. Klingmüller, and J. Timmer, Structural and practical identifiability analysis of partially observed dynamical models by exploiting the profile likelihood, Bioinformatics, 25 (2009), pp. 1923–1929, https: //doi.org/10.1093/bioinformatics/btp358
-
[30]
J. Riou and C. L. Althaus, Pattern of early human-to-human transmission of Wuhan 2019 novel coronavirus (2019-nCoV), December 2019 to January 2020, Eurosurveillance, 25 22 (2020), p. 2000058, https://doi.org/10.2807/1560-7917.ES.2020.25.4.2000058
-
[31]
Saltelli, M
A. Saltelli, M. Ratto, T. Andres, F. Campolongo, J. Cariboni, D. Gatelli, M. Saisana, and S. Tarantola, Global Sensitivity Analysis: The Primer, John Wi- ley & Sons, Chichester, 2008
2008
-
[32]
B. Tang, X. Wang, Q. Li, N. L. Bragazzi, S. Tang, Y. Xiao, and J. Wu, Estimation of the transmission risk of the 2019-nCoV and its implication for public health interventions, Journal of Clinical Medicine, 9 (2020), p. 462, https://doi.org/10.3390/jcm9020462
-
[33]
P. van den Driessche and J. Watmough, Reproduction numbers and sub-threshold endemic equilibria for compartmental models of disease transmission, Mathematical Biosciences, 180 (2002), pp. 29–48, https://doi.org/10.1016/S0025-5564(02)00108-6
-
[34]
O. J. Watson, G. Barnsley, J. Toor, A. B. Hogan, P. Winskill, and A. C. Ghani, Global impact of the first year of COVID-19 vaccination: a mathematical modelling study, Lancet Infectious Diseases, 22 (2022), pp. 1293–1302, https://doi.org/10.1016/ S1473-3099(22)00320-6
2022
-
[35]
World Health Organization, Coronavirus disease (COVID-19) pandemic, WHO situa- tionreport, WorldHealthOrganization, 2020, https://www.who.int/emergencies/diseases/ novel-coronavirus-2019. 23
2020
discussion (0)
Sign in with ORCID, Apple, or X to comment. Anyone can read and Pith papers without signing in.