Interaction-induced star formation boosts stellar mass assembly in zsim5 galaxies
Pith reviewed 2026-06-30 00:26 UTC · model grok-4.3
The pith
Galaxy mergers at z∼5 account for 42 percent of stellar mass growth, half through new stars formed during the interactions.
A machine-rendered reading of the paper's core claim, the machinery that carries it, and where it could break.
Core claim
The components in these systems experience brief intervals (∼0.2 Gyr) of strongly enhanced star formation that grow their stellar mass by ∼2.66±0.85×, forming ∼1.71±0.37× of excess mass than expected compared to if there was no burst. Attributing these star formation rate enhancements to interactions and assuming that the components will merge, we find that mergers are responsible for ∼42+20−25% of the total stellar mass growth of galaxies at z∼5. While about half of this contribution comes from the merging of the pre-existing stellar masses of the merging galaxies, half is due to stellar mass that is newly-formed during the interaction.
What carries the argument
Non-parametric star formation histories from spectral energy distribution fitting of components in visually classified close-interacting systems, which quantify the excess stellar mass formed during the brief interaction-triggered bursts.
If this is right
- Mergers at high redshift contribute to stellar mass growth through both the addition of existing stars and newly formed stars during the encounter.
- Brief interaction-induced star-formation bursts can increase component masses by a factor of about 2.66 over 0.2 Gyr.
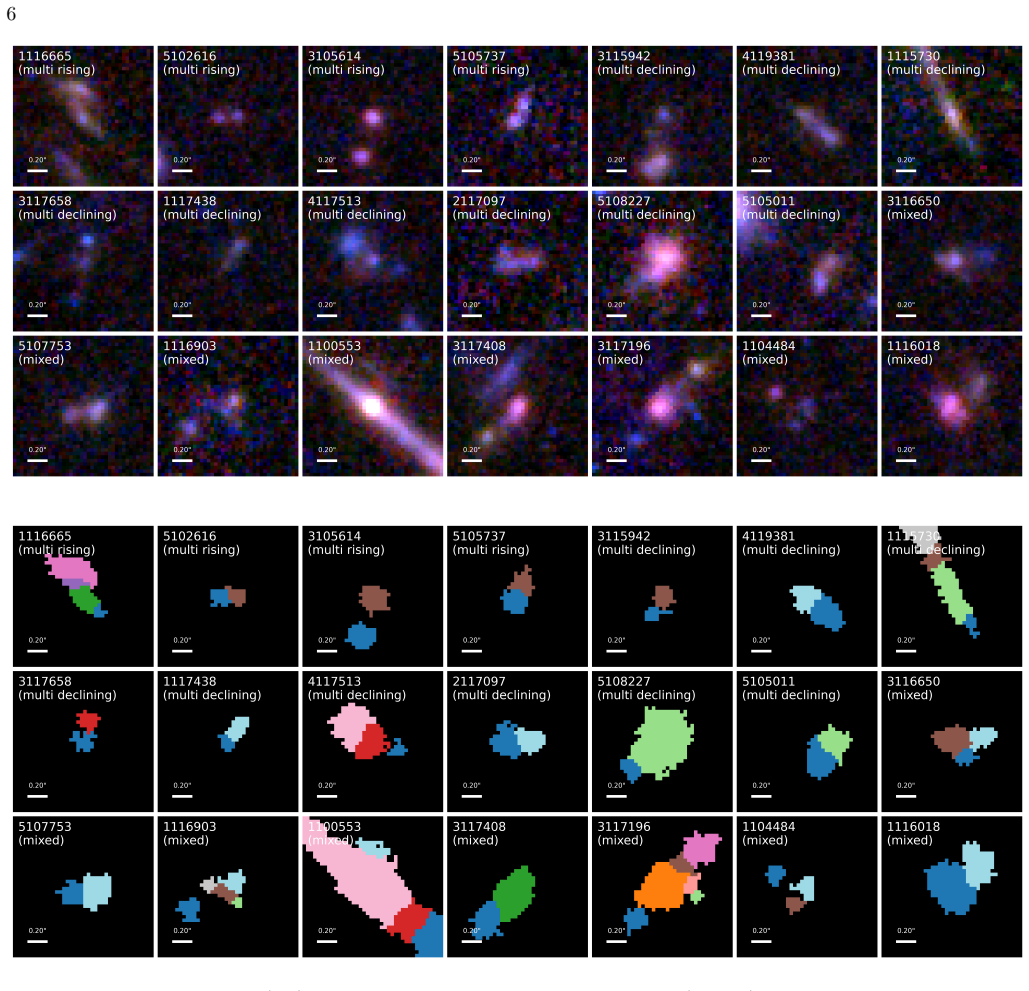
- Roughly 44 percent of galaxies in the z∼5 sample appear as close-interacting systems with separations less than or equal to 5 kpc.
- The new-star contribution during mergers is comparable in size to the pre-existing mass contribution.
Where Pith is reading between the lines
- Galaxy-formation simulations at z>5 would need to incorporate merger-triggered star formation to match observed mass assembly rates.
- The relative importance of this channel may change at lower redshifts where gas fractions and merger rates differ.
- If the bursts are confirmed, the stellar mass function at z∼5 could show an excess at the high-mass end traceable to recent interactions.
Load-bearing premise
The observed star-formation enhancements are caused by the galaxy interactions rather than other processes, and the interacting components will merge into single galaxies.
What would settle it
A direct comparison showing that star-formation rates in these close pairs are not elevated relative to isolated galaxies at the same redshift, or follow-up imaging showing that most such pairs at z∼5 do not coalesce.
Figures


read the original abstract
Galaxy interactions are a key ingredient in galaxy evolution; not only are they a primary pathway of galaxy growth and mass assembly, but also a key driver of processes such as star formation and quenching. We investigate the impact of galaxy-galaxy interactions on stellar mass assembly using JWST/NIRCam observations of a spectroscopically selected sample of galaxies at $5.0<z_{spec}<5.6$ from the Canadian NIRISS Unbiased Cluster Survey (CANUCS). Of the 48 galaxies in our parent sample, we visually classify 21 ($44\%$) as closely-interacting ($\lesssim$ 5 kpc) systems with two or more components. We evaluate the non-parametric star formation histories (SFHs) of these systems' components using the spectral energy distribution fitting code \textsc{Dense Basis}. We find that the components in these systems experience brief intervals ($\sim0.2$ Gyr) of strongly enhanced star formation that grow their stellar mass by $\sim2.66\pm0.85\times$, forming $\sim1.71\pm0.37\times$ of excess mass than expected compared to if there was no burst. Attributing these star formation rate enhancements to interactions and assuming that the components will merge, we find that mergers are responsible for $\sim42^{+20}_{-25}\%$ of the total stellar mass growth of galaxies at $z\sim5$. While about half of this contribution comes from the merging of the pre-existing stellar masses of the merging galaxies, half is due to stellar mass that is newly-formed during the interaction. We conclude that mergers, and their associated star formation bursts, are an important pathway for stellar mass growth in high-$z$ galaxies.
Editorial analysis
A structured set of objections, weighed in public.
Referee Report
Summary. The manuscript analyzes JWST/NIRCam observations of a spectroscopically selected sample of 48 galaxies at 5.0 < z_spec < 5.6 from CANUCS. Visual classification identifies 21 (44%) as closely interacting (≲5 kpc) systems with multiple components. Non-parametric SFHs are fit to the components using Dense Basis, revealing brief (~0.2 Gyr) enhanced star-formation episodes that produce a stellar-mass growth factor of ~2.66±0.85 and an excess-mass factor of ~1.71±0.37 relative to a no-burst baseline. Attributing the enhancements to interactions and assuming the components merge, the authors conclude that mergers account for ~42+20−25% of total stellar-mass growth at z~5, with roughly half arising from newly formed stars during the interaction.
Significance. If the causal attribution and merger assumption hold, the result would provide a quantitative observational constraint showing that galaxy interactions contribute substantially to stellar-mass assembly at z~5, with interaction-triggered star formation supplying a comparable fraction to the merging of pre-existing stellar mass. The spectroscopically confirmed parent sample and non-parametric SFH approach are strengths that allow direct measurement of burst durations and mass increments.
major comments (3)
- [Abstract / §4] Abstract and §4 (SFH analysis): The central 42% merger contribution is obtained by attributing the measured 2.66× growth and 1.71× excess exclusively to interactions in the 21 systems; no parallel Dense Basis run is reported on the 27 non-interacting galaxies in the same parent sample, leaving the causal link between interactions and the observed bursts untested and load-bearing for the claim.
- [Abstract] Abstract and classification section: The 42% figure further assumes that all classified components will merge; no merger probability, timescale, or fraction is quantified or cited, so the conversion from observed burst factors to a global mass-assembly percentage rests on an untested extrapolation whose uncertainty is not propagated beyond the reported +20−25% range.
- [Methods / Results] Methods / Results: The visual classification of 21/48 systems as interacting relies on a single <5 kpc separation criterion without reported robustness checks (e.g., multiple independent classifiers, quantitative asymmetry metrics, or tests against projection effects), directly affecting the numerator of the 42% calculation.
minor comments (1)
- [Abstract] The abstract states the growth and excess factors with uncertainties but does not explicitly define the no-burst baseline model used to compute the excess mass; a brief clarification would improve reproducibility.
Simulated Author's Rebuttal
We thank the referee for their constructive and detailed comments, which highlight important aspects of our methodology and assumptions. We respond point by point to the major comments below, indicating where the manuscript will be revised.
read point-by-point responses
-
Referee: [Abstract / §4] Abstract and §4 (SFH analysis): The central 42% merger contribution is obtained by attributing the measured 2.66× growth and 1.71× excess exclusively to interactions in the 21 systems; no parallel Dense Basis run is reported on the 27 non-interacting galaxies in the same parent sample, leaving the causal link between interactions and the observed bursts untested and load-bearing for the claim.
Authors: We acknowledge that a parallel analysis of the non-interacting galaxies would provide a stronger test of causality. Our parent sample is spectroscopically selected without morphological bias, and the analysis is deliberately focused on the interacting subset to quantify their contribution. The short burst durations (~0.2 Gyr) and their coincidence with the observed close pairs offer supporting circumstantial evidence for interaction-driven enhancement. We will revise §4 and the discussion to explicitly state this assumption, quantify its impact on the result, and note that a control-sample comparison is a priority for future work with expanded samples. revision: partial
-
Referee: [Abstract] Abstract and classification section: The 42% figure further assumes that all classified components will merge; no merger probability, timescale, or fraction is quantified or cited, so the conversion from observed burst factors to a global mass-assembly percentage rests on an untested extrapolation whose uncertainty is not propagated beyond the reported +20−25% range.
Authors: The manuscript states the merger assumption explicitly when converting the observed burst factors to a global fraction. The reported asymmetric uncertainty already incorporates sample variance and SFH fitting errors. While we did not add an extra term for merger probability, we will revise the abstract and §4 to cite high-redshift pair and merger studies that support high merger fractions for ≲5 kpc separations at z~5, and we will discuss how this assumption affects the quoted percentage. revision: partial
-
Referee: [Methods / Results] Methods / Results: The visual classification of 21/48 systems as interacting relies on a single <5 kpc separation criterion without reported robustness checks (e.g., multiple independent classifiers, quantitative asymmetry metrics, or tests against projection effects), directly affecting the numerator of the 42% calculation.
Authors: Visual classification using a close projected separation is standard for identifying likely interactions at these redshifts. We will revise the methods section to document that the classification was performed independently by two authors with agreement on all systems, and we will add a brief discussion of projection effects informed by cosmological simulations. These additions will be included in the revised manuscript. revision: yes
Circularity Check
No significant circularity; central fraction is a direct calculation from observations
full rationale
The paper measures SF enhancements (~2.66x mass growth, ~1.71x excess) via Dense Basis fits to the 21 interacting components, then multiplies by an assumed merger fraction to obtain the ~42% contribution. This is an arithmetic combination of measured quantities and an external assumption, not a self-definition, fitted parameter renamed as prediction, or reduction to prior self-citation. No equations or steps in the abstract or described chain equate the output fraction to its inputs by construction. The result remains falsifiable against independent merger-rate or control-sample data.
Axiom & Free-Parameter Ledger
free parameters (2)
- mass growth factor =
2.66
- excess mass factor =
1.71
axioms (2)
- domain assumption Visual classification at projected separation ≲5 kpc reliably identifies physically interacting systems at z~5
- domain assumption Dense Basis non-parametric SFH recovery from NIRCam SEDs accurately captures brief ~0.2 Gyr bursts
Reference graph
Works this paper leans on
-
[1]
2023, MNRAS, 523, L40, doi: 10.1093/mnrasl/slad054
Asada, Y., Sawicki, M., Desprez, G., et al. 2023, MNRAS, 523, L40, doi: 10.1093/mnrasl/slad054
-
[2]
2024, MNRAS, 527, 11372, doi: 10.1093/mnras/stad3902
Asada, Y., Sawicki, M., Abraham, R., et al. 2024, MNRAS, 527, 11372, doi: 10.1093/mnras/stad3902
-
[3]
Asada, Y., Desprez, G., Willott, C. J., et al. 2025, ApJL, 983, L2, doi: 10.3847/2041-8213/adc388 Astropy Collaboration, Robitaille, T. P., Tollerud, E. J., et al. 2013, A&A, 558, A33, doi: 10.1051/0004-6361/201322068 Astropy Collaboration, Price-Whelan, A. M., Sip˝ ocz, B. M., et al. 2018, AJ, 156, 123, doi: 10.3847/1538-3881/aabc4f Astropy Collaboration...
-
[4]
Barton, E. J., Geller, M. J., & Kenyon, S. J. 2000, ApJ, 530, 660, doi: 10.1086/308392
-
[5]
2008, Chinese Journal of Astronomy and Astrophysics Supplement, 8, 77
Beckman, J., Carretero, C., & Vazdekis, A. 2008, Chinese Journal of Astronomy and Astrophysics Supplement, 8, 77
2008
-
[6]
Bottrell, C., Yesuf, H. M., Popping, G., et al. 2024, MNRAS, 527, 6506, doi: 10.1093/mnras/stad2971
-
[7]
and Busko, Ivo and Donath, Axel and Günther, Hans Moritz and Cara, Mihai and Lim, P
Bradley, L., Sip˝ ocz, B., Robitaille, T., et al. 2025,, 2.2.0 Zenodo, doi: 10.5281/zenodo.14889440
-
[8]
2023,, 0.6.7 Zenodo, doi: 10.5281/zenodo.5012704 Calabr` o, A., Pentericci, L., Llerena, M., et al
Brammer, G. 2023,, 0.6.7 Zenodo, doi: 10.5281/zenodo.5012704 Calabr` o, A., Pentericci, L., Llerena, M., et al. 2026, arXiv e-prints, arXiv:2602.18068, doi: 10.48550/arXiv.2602.18068 Calder´ on-Castillo, P., & Smith, R. 2024, A&A, 691, A82, doi: 10.1051/0004-6361/202450473
-
[9]
The Dust Content and Opacity of Actively Star-Forming Galaxies
Calzetti, D., Armus, L., Bohlin, R. C., et al. 2000, ApJ, 533, 682, doi: 10.1086/308692
work page internal anchor Pith review doi:10.1086/308692 2000
-
[10]
Carnall, A. C., McLure, R. J., Dunlop, J. S., & Dav´ e, R. 2018, MNRAS, 480, 4379, doi: 10.1093/mnras/sty2169
work page internal anchor Pith review doi:10.1093/mnras/sty2169 2018
-
[11]
Casteels, K. R. V., Conselice, C. J., Bamford, S. P., et al. 2014, MNRAS, 445, 1157, doi: 10.1093/mnras/stu1799
-
[12]
2003, PASP, 115, 763, doi: 10.1086/376392
Chabrier, G. 2003, PASP, 115, 763, doi: 10.1086/376392
work page internal anchor Pith review doi:10.1086/376392 2003
-
[13]
Cole, S., Lacey, C. G., Baugh, C. M., & Frenk, C. S. 2000, MNRAS, 319, 168, doi: 10.1046/j.1365-8711.2000.03879.x
-
[14]
Conselice, C. J., & Arnold, J. 2009, MNRAS, 397, 208, doi: 10.1111/j.1365-2966.2009.14959.x
-
[15]
Conselice, C. J., Mundy, C. J., Ferreira, L., & Duncan, K. 2022, ApJ, 940, 168, doi: 10.3847/1538-4357/ac9b1a
-
[16]
J., Adams, N., Harvey, T., et al
Conselice, C. J., Adams, N., Harvey, T., et al. 2025, ApJ, 983, 30, doi: 10.3847/1538-4357/ada608
-
[17]
Curtis-Lake, E., McLure, R. J., Dunlop, J. S., et al. 2016, MNRAS, 457, 440, doi: 10.1093/mnras/stv3017
-
[18]
The Fraction of Clumpy Galaxies in JADES Over $2<z<9$
Dalmasso, N., Calabr` o, A., Leethochawalit, N., et al. 2024, MNRAS, 533, 4472, doi: 10.1093/mnras/stae2064 de la Vega, A., Mobasher, B., Manesh, F., et al. 2025, arXiv e-prints, arXiv:2508.14972, doi: 10.48550/arXiv.2508.14972
work page internal anchor Pith review Pith/arXiv arXiv doi:10.1093/mnras/stae2064 2024
-
[19]
2025, MNRAS, doi: 10.1093/mnras/staf1617
Khalid, A. 2025, MNRAS, doi: 10.1093/mnras/staf1617
-
[20]
A JWST study of pair fractions, merger rates, and stellar mass accretion rates at z = 4.5 11.5
Duan, Q., Conselice, C. J., Li, Q., et al. 2025, MNRAS, 540, 774, doi: 10.1093/mnras/staf638
-
[21]
Duan, Q., Conselice, C. J., Harvey, T., et al. 2026, MNRAS, 546, stag008, doi: 10.1093/mnras/stag008
-
[22]
Duncan, K., Conselice, C. J., Mundy, C., et al. 2019, ApJ, 876, 110, doi: 10.3847/1538-4357/ab148a
-
[23]
Ellison, S. L., & Ferreira, L. 2025, arXiv e-prints, arXiv:2511.21512, doi: 10.48550/arXiv.2511.21512
work page internal anchor Pith review Pith/arXiv arXiv doi:10.48550/arxiv.2511.21512 2025
-
[24]
Ellison, S. L., Patton, D. R., Simard, L., & McConnachie, A. W. 2008, AJ, 135, 1877, doi: 10.1088/0004-6256/135/5/1877
work page internal anchor Pith review doi:10.1088/0004-6256/135/5/1877 2008
-
[25]
Ferreira, L., Conselice, C. J., Duncan, K., et al. 2020, ApJ, 895, 115, doi: 10.3847/1538-4357/ab8f9b
-
[26]
Ferreira, L., Ellison, S. L., Patton, D. R., et al. 2025, MNRAS, 538, L31, doi: 10.1093/mnrasl/slaf004
-
[27]
2025, Nature Astronomy, doi: 10.1038/s41550-025-02592-w
Fujimoto, S., Ouchi, M., Kohno, K., et al. 2025, Nature Astronomy, doi: 10.1038/s41550-025-02592-w
-
[28]
Harikane, Y., Inoue, A. K., Ellis, R. S., et al. 2025, ApJ, 980, 138, doi: 10.3847/1538-4357/ad9b2c
-
[29]
Hopkins, P. F., Cox, T. J., Hernquist, L., et al. 2013, MNRAS, 430, 1901, doi: 10.1093/mnras/stt017
-
[30]
Hoyos, C., Arag´ on-Salamanca, A., Gray, M. E., et al. 2012, MNRAS, 419, 2703, doi: 10.1111/j.1365-2966.2011.19918.x Huˇ sko, F., Lacey, C. G., & Baugh, C. M. 2023, MNRAS, 518, 5323, doi: 10.1093/mnras/stac3152
-
[31]
2017, ApJ, 838, 127, doi: 10.3847/1538-4357/aa63f0
Iyer, K., & Gawiser, E. 2017, ApJ, 838, 127, doi: 10.3847/1538-4357/aa63f0
-
[32]
Iyer, K. G., Gawiser, E., Faber, S. M., et al. 2019, ApJ, 879, 116, doi: 10.3847/1538-4357/ab2052
-
[33]
Jakobsen, P., Ferruit, P., Alves de Oliveira, C., et al. 2022, A&A, 661, A80, doi: 10.1051/0004-6361/202142663
work page internal anchor Pith review doi:10.1051/0004-6361/202142663 2022
-
[34]
Kaviraj, S., Cohen, S., Windhorst, R. A., et al. 2013, MNRAS, 429, L40, doi: 10.1093/mnrasl/sls019
-
[35]
Kim, J.-h., Wise, J. H., & Abel, T. 2009, ApJL, 694, L123, doi: 10.1088/0004-637X/694/2/L123 14
-
[36]
G., Alonso, S., Mesa, V., & O’Mill, A
Lambas, D. G., Alonso, S., Mesa, V., & O’Mill, A. L. 2012, A&A, 539, A45, doi: 10.1051/0004-6361/201117900
-
[37]
Larson, R. L., Hutchison, T. A., Bagley, M., et al. 2023, ApJ, 958, 141, doi: 10.3847/1538-4357/acfed4
-
[38]
Speagle, J. S. 2019, ApJ, 876, 3, doi: 10.3847/1538-4357/ab133c
work page internal anchor Pith review doi:10.3847/1538-4357/ab133c 2019
-
[39]
M., Koekemoer, A., Coe, D., et al
Lotz, J. M., Koekemoer, A., Coe, D., et al. 2017, ApJ, 837, 97, doi: 10.3847/1538-4357/837/1/97
-
[40]
2020, ApJ, 904, 33, doi: 10.3847/1538-4357/abbfa7
Lower, S., Narayanan, D., Leja, J., et al. 2020, ApJ, 904, 33, doi: 10.3847/1538-4357/abbfa7
-
[41]
, archivePrefix = "arXiv", eprint =
Madau, P., & Dickinson, M. 2014, ARA&A, 52, 415, doi: 10.1146/annurev-astro-081811-125615 M´ erida, R. M., Sawicki, M., Iyer, K. G., et al. 2025, arXiv e-prints, arXiv:2509.22871, doi: 10.48550/arXiv.2509.22871
work page internal anchor Pith review doi:10.1146/annurev-astro-081811-125615 2014
-
[42]
Moreno, J., Torrey, P., Ellison, S. L., et al. 2015, MNRAS, 448, 1107, doi: 10.1093/mnras/stv094
-
[43]
2024, Nature, 636, 332, doi: 10.1038/s41586-024-08293-0
Mowla, L., Iyer, K., Asada, Y., et al. 2024, Nature, 636, 332, doi: 10.1038/s41586-024-08293-0
-
[44]
2024, ApJ, 975, 238, doi: 10.3847/1538-4357/ad7d0b
Nakazato, Y., Ceverino, D., & Yoshida, N. 2024, ApJ, 975, 238, doi: 10.3847/1538-4357/ad7d0b
-
[45]
2024, ApJ, 961, 73, doi: 10.3847/1538-4357/ad0966
Narayanan, D., Lower, S., Torrey, P., et al. 2024, ApJ, 961, 73, doi: 10.3847/1538-4357/ad0966
-
[46]
Oke, J. B., & Gunn, J. E. 1983, ApJ, 266, 713, doi: 10.1086/160817
-
[47]
C., Bottrell, C., Bellstedt, S., et al
Omori, K. C., Bottrell, C., Bellstedt, S., et al. 2025, ApJ, 989, 73, doi: 10.3847/1538-4357/ade989
-
[48]
Patton, D. R., Ellison, S. L., Simard, L., McConnachie, A. W., & Mendel, J. T. 2011, MNRAS, 412, 591, doi: 10.1111/j.1365-2966.2010.17932.x
-
[49]
Scudder, J. M. 2013, MNRAS, 433, L59, doi: 10.1093/mnrasl/slt058
-
[50]
, archivePrefix = "arXiv", eprint =
Postman, M., Coe, D., Ben´ ıtez, N., et al. 2012, ApJS, 199, 25, doi: 10.1088/0067-0049/199/2/25 Pusk´ as, D., Tacchella, S., Simmonds, C., et al. 2025a, MNRAS, 540, 2146, doi: 10.1093/mnras/staf813 Pusk´ as, D., Tacchella, S., Simmonds, C., et al. 2025b, arXiv e-prints, arXiv:2510.14743, doi: 10.48550/arXiv.2510.14743
-
[51]
2015, MNRAS, 446, 2038, doi: 10.1093/mnras/stu2208
Renaud, F., Bournaud, F., & Duc, P.-A. 2015, MNRAS, 446, 2038, doi: 10.1093/mnras/stu2208
-
[52]
Renaud, F., Bournaud, F., Kraljic, K., & Duc, P. A. 2014, MNRAS, 442, L33, doi: 10.1093/mnrasl/slu050
-
[53]
2017, A&A, 608, A16, doi: 10.1051/0004-6361/201630057
Ribeiro, B., Le F` evre, O., Cassata, P., et al. 2017, A&A, 608, A16, doi: 10.1051/0004-6361/201630057
-
[54]
Rieke, M. J., Kelly, D. M., Misselt, K., et al. 2023, PASP, 135, 028001, doi: 10.1088/1538-3873/acac53 Rodr´ ıguez Montero, F., Dav´ e, R., Wild, V., Angl´ es-Alc´ azar, D., & Narayanan, D. 2019, MNRAS, 490, 2139, doi: 10.1093/mnras/stz2580
-
[55]
R., Daisaka, H., Kokubo, E., et al
Saitoh, T. R., Daisaka, H., Kokubo, E., et al. 2009, PASJ, 61, 481, doi: 10.1093/pasj/61.3.481
-
[56]
Sarrouh, G. T. E., Asada, Y., Martis, N. S., et al. 2026, ApJS, 282, 3, doi: 10.3847/1538-4365/ae1611
-
[57]
Sawicki, M., & Yee, H. K. C. 1998, AJ, 115, 1329, doi: 10.1086/300291
-
[58]
2005, in Astrophysics and Space Science
Schweizer, F. 2005, in Astrophysics and Space Science
2005
-
[59]
329, Starbursts: From 30 Doradus to Lyman Break Galaxies, ed
Library, Vol. 329, Starbursts: From 30 Doradus to Lyman Break Galaxies, ed. R. de Grijs & R. M. Gonz´ alez Delgado, 143, doi: 10.1007/1-4020-3539-X 25
-
[60]
Silva, A., Marchesini, D., Silverman, J. D., et al. 2018, ApJ, 868, 46, doi: 10.3847/1538-4357/aae847
-
[61]
2018, MNRAS, 476, 1532, doi: 10.1093/mnras/sty186
Sorba, R., & Sawicki, M. 2018, MNRAS, 476, 1532, doi: 10.1093/mnras/sty186
-
[62]
2016, MNRAS, 462, 2418, doi: 10.1093/mnras/stw1793
Sparre, M., & Springel, V. 2016, MNRAS, 462, 2418, doi: 10.1093/mnras/stw1793
-
[63]
Stephenson, H. M. O., Stott, J. P., Pirie, C. A., et al. 2025, MNRAS, 544, 1412, doi: 10.1093/mnras/staf1725
-
[64]
2023, ApJL, 949, L23, doi: 10.3847/2041-8213/acd457
Strait, V., Brammer, G., Muzzin, A., et al. 2023, ApJL, 949, L23, doi: 10.3847/2041-8213/acd457
-
[65]
2019, MNRAS, 482, L55, doi: 10.1093/mnrasl/sly185
Antonio, B. 2019, MNRAS, 482, L55, doi: 10.1093/mnrasl/sly185
-
[66]
2017, A&A, 608, A9, doi: 10.1051/0004-6361/201731586
Ventou, E., Contini, T., Bouch´ e, N., et al. 2017, A&A, 608, A9, doi: 10.1051/0004-6361/201731586
-
[67]
J., Doyon, R., Albert, L., et al
Willott, C. J., Doyon, R., Albert, L., et al. 2022, PASP, 134, 025002, doi: 10.1088/1538-3873/ac5158
-
[68]
Yesuf, H. M., Ho, L. C., & Faber, S. M. 2021, ApJ, 923, 205, doi: 10.3847/1538-4357/ac27a7
discussion (0)
Sign in with ORCID, Apple, or X to comment. Anyone can read and Pith papers without signing in.