Vistas: A Visualization Interface for Particle Collision Simulations
Pith reviewed 2026-06-26 18:12 UTC · model grok-4.3
The pith
Vistas renders each Pythia collision stage as a separate set of interactive 3D momentum lines.
A machine-rendered reading of the paper's core claim, the machinery that carries it, and where it could break.
Core claim
Vistas converts the output of a Pythia simulation into an interactive three-dimensional graph in which the hard process, parton shower, hadronization, and subsequent decays appear as distinct, toggleable sets of lines, each line drawn along the three-momentum vector of the corresponding particle, with full support for rotation, zooming, particle selection, and kinematic filtering.
What carries the argument
Stage-separated 3D line rendering inside the Phoenix event display, where each Pythia computational stage maps to an independent, user-togglable collection of momentum vectors.
If this is right
- Students can isolate and compare the hard-process lines against the shower lines to see how initial-state radiation develops.
- Beam remnants and underlying-event activity become directly visible when the hadronization stage is toggled independently of earlier stages.
- Kinematic cuts applied across all stages allow rapid identification of particles that satisfy experimental selection criteria.
- The same interface supports both introductory demonstrations of color flow and advanced inspection of multiple parton interactions.
Where Pith is reading between the lines
- The same stage-toggling approach could be applied to events generated by other Monte Carlo programs to allow visual comparison of their modeling choices.
- Embedding Vistas inside online tutorials would let learners generate an event and immediately explore its internal structure without switching tools.
- Quantitative studies could measure whether repeated use of the 3D view improves students' ability to predict how changes in Pythia parameters affect final-state distributions.
Load-bearing premise
Representing the successive stages of a Monte Carlo simulation as separate three-dimensional line sets conveys the underlying physics logic without introducing visual distortions or false impressions of causality.
What would settle it
A side-by-side comparison in which students interpret the same Pythia event from Vistas versus from standard text output or two-dimensional plots, followed by a test that checks whether the 3D view produces systematic misconceptions about parton ordering or color connections.
Figures


read the original abstract
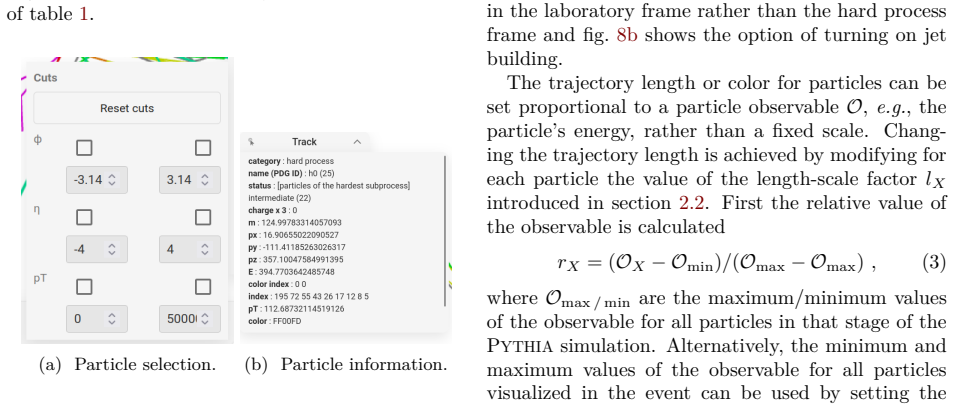
We introduce Vistas, a tool for visualizing high-energy particle physics collisions simulated by the Pythia Monte-Carlo event generator. Vistas utilizes the browser-based event display framework Phoenix to show distinct computational stages of a high-energy collision event simulation: the hard process, parton shower, hadronization, and particle decays. Particles produced from each of these stages are represented as lines in an interactive three-dimensional graph structure, where each line is along the direction of its particle's three-momentum vector. The event can be rotated, translated and zoomed, and details for each particle can be accessed by selecting the relevant particle line. Additionally, particle lines from all stages of the simulation can be toggled on and off and can be filtered by particle-level kinematic selection requirements. This interactive environment provides an intuitive interpretation of Pythia simulation output, including detailed features such as color flow, beam remnants, and multiple parton interactions, making it a useful tool in physics education settings, from outreach activities to graduate particle-physics courses.
Editorial analysis
A structured set of objections, weighed in public.
Referee Report
Summary. The paper introduces Vistas, a visualization tool built on the Phoenix browser-based event display framework for rendering Pythia Monte Carlo collision simulations. It displays the hard process, parton shower, hadronization, and particle decays as separate, toggleable sets of 3D lines along particle three-momenta, with support for rotation/zoom, particle selection for details, and kinematic filters. The tool is intended to aid intuitive interpretation of features such as color flow, beam remnants, and multiple parton interactions in educational contexts ranging from outreach to graduate courses.
Significance. If the rendering accurately separates and displays the simulation stages without introducing artifacts that misrepresent Pythia's Monte Carlo ordering, Vistas could provide a practical educational resource for making the multi-stage structure of event generation more accessible through interactive 3D visualization.
minor comments (1)
- [Abstract] Abstract: the claim that the tool visualizes 'detailed features such as color flow, beam remnants, and multiple parton interactions' is not supported by the described functionality (momentum lines with toggling and filtering); additional visual encodings or examples would be needed to substantiate this.
Simulated Author's Rebuttal
We thank the referee for their review and for recommending minor revision. We are pleased that the educational value of Vistas for illustrating the multi-stage structure of Pythia event generation is recognized.
Circularity Check
No significant circularity
full rationale
The paper is a pure tool-description manuscript introducing Vistas, a browser-based visualization layer on top of the Phoenix framework and Pythia event generator. It contains no equations, no fitted parameters, no predictions, and no derivation chain of any kind. All content is declarative description of rendering choices (stage separation, line representation, toggles, kinematic filters) and intended educational use. No self-citation is load-bearing; the work does not invoke uniqueness theorems, ansatzes, or prior results from the same authors to justify a central claim. The absence of any quantitative or deductive structure makes circularity impossible by construction.
Axiom & Free-Parameter Ledger
Reference graph
Works this paper leans on
-
[1]
General-purpose event generators for LHC physics,
A. Buckleyet al., “General-purpose event generators for LHC physics,”Phys. Rept.504 (2011) 145–233,arXiv:1101.2599 [hep-ph]
Pith/arXiv arXiv 2011
-
[2]
Event generators for high-energy physics experiments,
J. M. Campbellet al., “Event generators for high-energy physics experiments,”SciPost Phys.16no. 5, (2024) 130,arXiv:2203.11110 [hep-ph]
arXiv 2024
-
[3]
ROOT: An object oriented data analysis framework,
R. Brun and F. Rademakers, “ROOT: An object oriented data analysis framework,”Nucl. Instrum. Meth. A389(1997) 81–86
1997
-
[4]
The Atlantis event visualisation program for the ATLAS experiment,
N. Konstantinidiset al., “The Atlantis event visualisation program for the ATLAS experiment,” in14th International Conference on Computing in High-Energy and Nuclear Physics, pp. 361–364. 2005
2005
-
[5]
The Atlantis Event Display Web Site
ATLAS Collaboration, “The Atlantis Event Display Web Site. ” http://atlantis.web.cern.ch/. Accessed: 2026-05-28
2026
-
[6]
Event visualisation in ALICE - current status and strategy for Run 3,
J. Niedziela and B. von Haller, “Event visualisation in ALICE - current status and strategy for Run 3,”J. Phys. Conf. Ser.898 no. 7, (2017) 072008
2017
-
[7]
RenderCore – a new WebGPU-based rendering engine for ROOT-EVE,
C. Bohak, D. Kovalskyi, S. Linev, A. M. Tadel, S. Strban, M. Tadel, and A. Yagil, “RenderCore – a new WebGPU-based rendering engine for ROOT-EVE,”EPJ Web Conf.295(2024) 03035,arXiv:2312.11729 [hep-ex]
arXiv 2024
-
[8]
iSpy Event Display
CMS Collaboration, “iSpy Event Display. ” https://ispy-webgl.web.cern.ch/. Accessed: 2026-05-28
2026
-
[9]
LHCb Event display,
A. Trisovic, “LHCb Event display,” . [10]A TLASCollaboration, R. M. Bianchi, J. Boudreau, N. Konstantinidis, A. C. Martyniuk, E. Moyse, J. Thomas, B. M. Waugh, and D. P. Yallup, “Event visualization in ATLAS,”J. Phys. Conf. Ser.898no. 7, (2017) 072014
2017
-
[10]
The virtual point 1 event display for the ATLAS experiment,
T. H. Kittelmann, V. Tsulaia, J. Boudreau, and E. Moyse, “The virtual point 1 event display for the ATLAS experiment,”J. Phys. Conf. Ser. 219(2010) 032012
2010
-
[11]
The VP1 ATLAS 3D Event Display
ATLAS Collaboration, “The VP1 ATLAS 3D Event Display. ” http://atlas-vp1.web.cern.ch/. Accessed: 2026-05-28
2026
-
[12]
iSpy: A Powerful and Lightweight Event Display,
G. Alverson, G. Eulisse, T. McCauley, and L. Taylor, “iSpy: A Powerful and Lightweight Event Display,”J. Phys. Conf. Ser.396(2012) 022002
2012
-
[13]
J. Alwall, R. Frederix, S. Frixione, V. Hirschi, F. Maltoni, O. Mattelaer, H. S. Shao, T. Stelzer, P. Torrielli, and M. Zaro, “The automated computation of tree-level and next-to-leading order differential cross sections, and their matching to parton shower simulations,”JHEP07(2014) 079, arXiv:1405.0301 [hep-ph]
Pith/arXiv arXiv 2014
-
[14]
Space - time approach to quantum electrodynamics,
R. P. Feynman, “Space - time approach to quantum electrodynamics,”Phys. Rev.76 (1949) 769–789
1949
-
[15]
A comprehensive guide to the physics and usage of PYTHIA 8.3
C. Bierlichet al., “A comprehensive guide to the physics and usage of PYTHIA 8.3”SciPost Phys. Codeb.2022(2022) 8, arXiv:2203.11601 [hep-ph]
Pith/arXiv arXiv 2022
-
[16]
The Phoenix event display framework,
E. Moyse, F. Ali, E. Cortina, R. M. Bianchi, and B. Couturier, “The Phoenix event display framework,”EPJ Web Conf.251(2021) 01007
2021
-
[17]
Phoenix: A browser-based event display framework
HEP Software Foundation, “Phoenix: A browser-based event display framework. ” https://github.com/HSF/phoenix. Accessed: 2026-05-28. [19]A TLASCollaboration, G. Aadet al., “The ATLAS Experiment at the CERN Large Hadron Collider,”JINST3(2008) S08003. [20]CMSCollaboration, S. Chatrchyanet al., “The CMS Experiment at the CERN LHC,”JINST3 (2008) S08004
2026
-
[18]
M. Bahret al., “Herwig++ Physics and Manual,”Eur. Phys. J. C58(2008) 639–707, arXiv:0803.0883 [hep-ph]. [22]SherpaCollaboration, E. Bothmannet al., “Event generation with Sherpa 3,”JHEP12 (2024) 156,arXiv:2410.22148 [hep-ph]
Pith/arXiv arXiv 2008
-
[19]
PYTHIA 6.4 Physics and Manual,
T. Sjostrand, S. Mrenna, and P. Z. Skands, “PYTHIA 6.4 Physics and Manual,”JHEP05 (2006) 026,arXiv:hep-ph/0603175. 16 IOP Publishingsubmitted to Physics EducationMLhadCollaboration
Pith/arXiv arXiv 2006
-
[20]
T. Sj¨ ostrand, S. Ask, J. R. Christiansen, R. Corke, N. Desai, P. Ilten, S. Mrenna, S. Prestel, C. O. Rasmussen, and P. Z. Skands, “An introduction to PYTHIA 8.2”Comput. Phys. Commun.191(2015) 159–177, arXiv:1410.3012 [hep-ph]. [25]Particle Data GroupCollaboration, S. Navas et al., “Review of particle physics,”Phys. Rev. D110no. 3, (2024) 030001
Pith/arXiv arXiv 2015
-
[21]
A Planar Diagram Theory for Strong Interactions,
G. ’t Hooft, “A Planar Diagram Theory for Strong Interactions,”Nucl. Phys. B72(1974) 461
1974
-
[22]
Chartrand,Introductory Graph Theory
G. Chartrand,Introductory Graph Theory. Dover Books on Mathematics. Dover Publications, Mineola, New York, unabridged ed., 1984
1984
-
[23]
The HepMC3 event record library for Monte Carlo event generators,
A. Buckley, P. Ilten, D. Konstantinov, L. L¨ onnblad, J. Monk, W. Pokorski, T. Przedzinski, and A. Verbytskyi, “The HepMC3 event record library for Monte Carlo event generators,”Comput. Phys. Commun. 260(2021) 107310,arXiv:1912.08005 [hep-ph]
arXiv 2021
-
[24]
Transverse-momentum-ordered showers and interleaved multiple interactions,
T. Sjostrand and P. Z. Skands, “Transverse-momentum-ordered showers and interleaved multiple interactions,”Eur. Phys. J. C39(2005) 129–154,arXiv:hep-ph/0408302
Pith/arXiv arXiv 2005
-
[25]
Very high-energy collisions of hadrons,
R. P. Feynman, “Very high-energy collisions of hadrons,”Phys. Rev. Lett.23(1969) 1415–1417
1969
-
[26]
Inelastic Electron Proton and gamma Proton Scattering, and the Structure of the Nucleon,
J. D. Bjorken and E. A. Paschos, “Inelastic Electron Proton and gamma Proton Scattering, and the Structure of the Nucleon,”Phys. Rev. 185(1969) 1975–1982
1969
-
[27]
Factorization for Short Distance Hadron - Hadron Scattering,
J. C. Collins, D. E. Soper, and G. F. Sterman, “Factorization for Short Distance Hadron - Hadron Scattering,”Nucl. Phys. B261(1985) 104–142
1985
-
[28]
A Model for Parton Showers in QCD,
G. C. Fox and S. Wolfram, “A Model for Parton Showers in QCD,”Nucl. Phys. B168 (1980) 285–295
1980
-
[29]
A Model for Initial State Parton Showers,
T. Sjostrand, “A Model for Initial State Parton Showers,”Phys. Lett. B157(1985) 321–325
1985
-
[30]
A QCD Model for Jet Fragmentation Including Soft Gluon Interference,
B. R. Webber, “A QCD Model for Jet Fragmentation Including Soft Gluon Interference,”Nucl. Phys. B238(1984) 492–528
1984
-
[31]
Parton Fragmentation and String Dynamics,
B. Andersson, G. Gustafson, G. Ingelman, and T. Sjostrand, “Parton Fragmentation and String Dynamics,”Phys. Rept.97(1983) 31–145
1983
-
[32]
Van Rossum and F
G. Van Rossum and F. L. Drake,Python 3 Reference Manual. CreateSpace, 2009
2009
-
[33]
Pythia HTML Manual
Pythia Collaboration, “Pythia HTML Manual. ” https://pythia.org//latest-manual/ Welcome.html. Accessed: 2026-05-28
2026
-
[34]
Dispelling the N 3 myth for thek t jet-finder,
M. Cacciari and G. P. Salam, “Dispelling the N 3 myth for thek t jet-finder,”Phys. Lett. B 641(2006) 57–61,arXiv:hep-ph/0512210
Pith/arXiv arXiv 2006
-
[35]
M. Cacciari, G. P. Salam, and G. Soyez, “FastJet User Manual,”Eur. Phys. J. C72 (2012) 1896,arXiv:1111.6097 [hep-ph]
Pith/arXiv arXiv 2012
-
[36]
The Python Package Index
Python Software Foundation, “The Python Package Index. ”https://pypi.org. Accessed: 2026-05-28
2026
-
[37]
" " Re di rec t stdout to file
K. Thomaset al.,Jupyter Notebooks: A publishing format for reproducible computational workflows, pp. 87–90. IOS Press Books, 2016. A Code The VISTAScode and an associated tutorial are avail- able at the following repositories. •The code for V ISTASused in this paper is available at: https://gitlab.com/Pythia8/releases/-/ blob/pythia8318/plugins/python/ext...
2016
discussion (0)
Sign in with ORCID, Apple, or X to comment. Anyone can read and Pith papers without signing in.