From filaments to clumps: filament properties with synthetic Herschel observations
Pith reviewed 2026-06-27 18:00 UTC · model grok-4.3
The pith
Filaments host 94 percent of clumps and 93 percent of stars in synthetic star formation observations.
A machine-rendered reading of the paper's core claim, the machinery that carries it, and where it could break.
Core claim
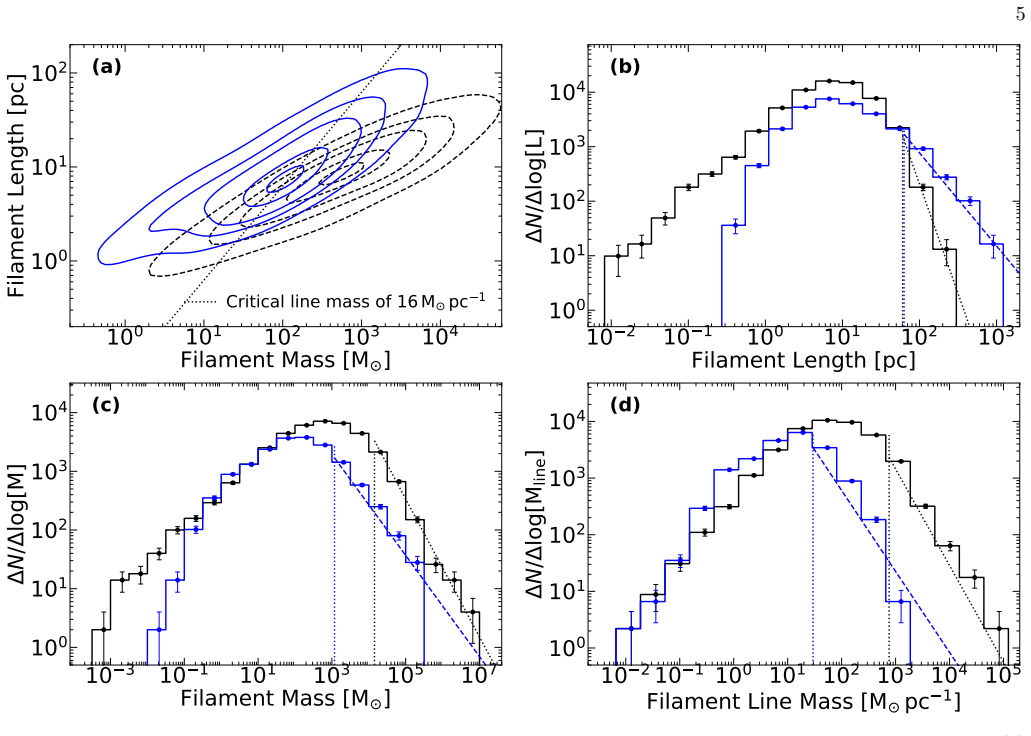
Processing synthetic column density maps from 3D simulations with FILFINDER yields 8832 filaments that host 94 percent of clumps and 93 percent of stars. Filaments hosting clumps have median column density 1.1 times 10 to the 21 cm minus 2, compared with 3.8 times 10 to the 20 cm minus 2 for those without clumps. Filament masses and lengths obey power-law distributions with indices alpha_M equals minus 0.86 and alpha_L equals minus 1.71, while filament density scales with background density as N_fs proportional to N_bs to the 0.78, reproducing the statistics of the real Hi-GAL filament catalogue.
What carries the argument
The FILFINDER algorithm applied to synthetic column density maps to identify filaments and measure their correlation with embedded clumps.
If this is right
- Filaments serve as the dominant sites for clump and star formation in the simulated volume.
- Only higher-column-density filaments tend to contain clumps.
- Synthetic filament mass and length distributions reproduce the observed power-law forms.
- The scaling N_fs proportional to N_bs to the 0.78 appears in both the simulation and the Hi-GAL survey.
Where Pith is reading between the lines
- The match between synthetic and observed statistics supports using the same filament-finding method on future wide-field surveys.
- If the underlying simulation physics capture the dominant processes, real Milky Way filaments should show comparable clump-hosting fractions.
- Varying the simulation resolution or feedback prescriptions could test how sensitive the 94 percent hosting fraction is to those choices.
Load-bearing premise
The FILFINDER algorithm applied to the synthetic column density maps accurately recovers filaments whose properties represent those seen in real Herschel observations.
What would settle it
Finding that the same FILFINDER procedure applied to actual Hi-GAL maps associates substantially fewer than 94 percent of clumps with filaments would falsify the claim that filaments are central to clump formation.
Figures


read the original abstract
Systematic surveys of filaments have been conducted to study their properties and their relationship to the process of star formation. In this paper, we use synthetic Herschel observations derived from 3D numerical simulations to compute column density maps, then use the \texttt{FILFINDER} algorithm to identify filaments. We obtain a large sample of 8,832 filaments that we further decompose into 110,193 branches. We characterize the physical properties of these filamentary structures and explore their correlations with embedded clumps. Furthermore, we directly compare our synthetic results with an observational catalogue of 32,059 filaments from the Herschel Infrared Galactic Plane Survey (Hi-GAL). Our results show that filaments are central to the star formation process, hosting $94\%$ of clumps from synthetic observations and $93\%$ of stars from our 3D numerical simulation. Filaments that host clumps have higher median column densities ($1.1\times10^{21}\,\rm{cm}^{-2}$) than those without ($3.8\times10^{20}\,\rm{cm}^{-2}$). We find power-law distributions for our synthetic filament masses and lengths, with power-law indexes of $\alpha_{\rm M}=-0.86$ and $\alpha_{\rm L} = -1.71$, respectively. We also find that the relation between the density of filaments and the background density is $N_{\rm{fs}} \propto N_{\rm{bs}}^{0.78}$. The measured properties of the filaments from the 2D synthetic observations are qualitatively consistent with those of the filaments from the Hi-GAL survey.
Editorial analysis
A structured set of objections, weighed in public.
Referee Report
Summary. The paper uses 3D numerical simulations to generate synthetic Herschel column-density maps, applies the FILFINDER algorithm to extract 8,832 filaments (decomposed into 110,193 branches), and compares their properties to the Hi-GAL catalog of 32,059 filaments. Central results include filaments hosting 94% of synthetic clumps and 93% of 3D-simulated stars, higher median column density for clump-hosting filaments (1.1e21 vs 3.8e20 cm^{-2}), power-law indices alpha_M = -0.86 and alpha_L = -1.71, and the scaling N_fs proportional to N_bs^{0.78}, with qualitative agreement to observations.
Significance. If the 2D-3D association holds, the work supplies a statistically large bridge between simulations and observations, quantifying the role of filaments in hosting star-forming clumps and providing power-law and scaling benchmarks that can be tested against future surveys or higher-resolution simulations. The direct Hi-GAL comparison and use of synthetic observations are clear strengths.
major comments (2)
- [Abstract and Methods] Abstract and Methods: The central claim that 93% of stars from the 3D simulation are hosted by filaments rests on matching 3D stellar positions to 2D FILFINDER skeletons extracted from projected column-density maps. No validation is described that compares these 2D masks to the underlying 3D density ridges or velocity-coherent structures, leaving open the possibility that line-of-sight projections inflate the reported fraction.
- [Abstract] Abstract: The reported fractions (94% clumps, 93% stars) and median column densities are given without uncertainties, bootstrap errors, or explicit definitions of 'hosting' (e.g., spatial overlap threshold or column-density cut). These quantities are load-bearing for the conclusion that filaments are central to star formation.
minor comments (1)
- [Abstract] The abstract would be strengthened by stating the precise criteria used to associate clumps and stars with filaments and by reporting uncertainties on the power-law indices and scaling exponent.
Simulated Author's Rebuttal
We thank the referee for their constructive comments on our manuscript. We address each major comment below, indicating where revisions will be incorporated.
read point-by-point responses
-
Referee: [Abstract and Methods] Abstract and Methods: The central claim that 93% of stars from the 3D simulation are hosted by filaments rests on matching 3D stellar positions to 2D FILFINDER skeletons extracted from projected column-density maps. No validation is described that compares these 2D masks to the underlying 3D density ridges or velocity-coherent structures, leaving open the possibility that line-of-sight projections inflate the reported fraction.
Authors: We acknowledge the referee's point that our 2D-3D association relies on projected positions without explicit validation against 3D density ridges. Our procedure projects 3D star and clump coordinates onto the synthetic column-density maps and checks for spatial overlap with the FILFINDER skeletons. We will revise the Methods section to explicitly describe this projection matching, including the one-pixel overlap criterion used to define 'hosting'. A full comparison to 3D ridges or velocity-coherent structures is not included, as the study focuses on replicating observational analysis pipelines; such validation would require substantial new post-processing and is noted as a limitation for future work. revision: partial
-
Referee: [Abstract] Abstract: The reported fractions (94% clumps, 93% stars) and median column densities are given without uncertainties, bootstrap errors, or explicit definitions of 'hosting' (e.g., spatial overlap threshold or column-density cut). These quantities are load-bearing for the conclusion that filaments are central to star formation.
Authors: We agree that uncertainties and explicit definitions are needed. In the revised manuscript we will add bootstrap resampling uncertainties to the reported fractions (94% clumps, 93% stars) and median column densities. We will also include a clear definition of 'hosting' in the Methods: a 3D clump or star is hosted if its projected position overlaps the 2D filament mask within one pixel (matching the map resolution). No additional column-density cut is imposed beyond the FILFINDER extraction itself. These additions will be reflected in both the Methods and Abstract. revision: yes
Circularity Check
No significant circularity; results are direct measurements from simulation and external catalog comparison
full rationale
The paper applies the FILFINDER algorithm to synthetic 2D column-density maps generated from an independent 3D numerical simulation, then reports measured fractions (94% clumps, 93% stars), median column densities, power-law indices, and the N_fs ∝ N_bs^0.78 scaling as direct outputs of that analysis. These are compared to the external Hi-GAL catalog. No derivation chain, first-principles prediction, self-citation load-bearing step, or uniqueness theorem is present; the reported quantities are statistical summaries of the processed synthetic sample rather than quantities forced by construction from the inputs.
Axiom & Free-Parameter Ledger
free parameters (3)
- mass power-law index =
-0.86
- length power-law index =
-1.71
- density scaling exponent =
0.78
axioms (2)
- domain assumption The 3D numerical simulation accurately captures the physical processes that produce filaments and embedded clumps in real molecular clouds.
- domain assumption FILFINDER applied to 2D column density maps recovers the same filament population that would be identified in real Herschel data.
Reference graph
Works this paper leans on
-
[1]
Alstott, J., Bullmore, E., & Plenz, D. 2014, PLoS ONE, 9, e85777, doi: 10.1371/journal.pone.0085777 Andr´ e, P., Arzoumanian, D., K¨ onyves, V., Shimajiri, Y., &
-
[2]
Palmeirim, P. 2019, A&A, 629, L4, doi: 10.1051/0004-6361/201935915 17 1019 1020 1021 1022 Average Branch Column Density [cm 2] 0.00 0.02 0.04 0.06 0.08Normalized Number Hi-GAL with Clumps Hi-GAL without Clumps This Work with Clumps This Work without Clumps Figure A2.Column density histograms for synthetic branches (blue lines) and the Hi-GAL filaments fro...
-
[3]
Klessen, C. P. Dullemond, & T. Henning, 27–51, doi: 10.2458/azu uapress 9780816531240-ch002 Andr´ e, P., Men’shchikov, A., Bontemps, S., et al. 2010, A&A, 518, L102, doi: 10.1051/0004-6361/201014666
work page doi:10.2458/azu 2010
-
[4]
A&A , archivePrefix = "arXiv", eprint =
Arzoumanian, D., Andr´ e, P., Didelon, P., et al. 2011, A&A, 529, L6, doi: 10.1051/0004-6361/201116596
-
[5]
2019, A&A, 621, A42, doi: 10.1051/0004-6361/201832725
Arzoumanian, D., Andr´ e, P., K¨ onyves, V., et al. 2019, A&A, 621, A42, doi: 10.1051/0004-6361/201832725
-
[6]
2019, ApJL, 881, L15, doi: 10.3847/2041-8213/ab3416
Auddy, S., Basu, S., & Kudoh, T. 2019, ApJL, 881, L15, doi: 10.3847/2041-8213/ab3416
-
[7]
Bergin, E. A., & Tafalla, M. 2007, ARA&A, 45, 339, doi: 10.1146/annurev.astro.45.071206.100404
-
[8]
Beuther, H., Kuiper, R., & Tafalla, M. 2025, ARA&A, 63, 1, doi: 10.1146/annurev-astro-013125-122023
-
[9]
V., van Leeuwen, J., Maan, Y., et al
Bilous, A. V., van Leeuwen, J., Maan, Y., et al. 2025, A&A, 696, A194, doi: 10.1051/0004-6361/202451413
-
[10]
Bonnell, I. A., & Bate, M. R. 2006, MNRAS, 370, 488, doi: 10.1111/j.1365-2966.2006.10495.x
-
[11]
Butler, M. J., & Tan, J. C. 2012, ApJ, 754, 5, doi: 10.1088/0004-637X/754/1/5
-
[12]
2009, ApJS, 181, 360, doi: 10.1088/0067-0049/181/2/360
Simon, R. 2009, ApJS, 181, 360, doi: 10.1088/0067-0049/181/2/360
-
[13]
Chen, H.-R. V., Zhang, Q., Wright, M. C. H., et al. 2019, ApJ, 875, 24, doi: 10.3847/1538-4357/ab0f3e
-
[14]
Hubber, D. A. 2017, MNRAS, 468, 2489, doi: 10.1093/mnras/stx637
-
[15]
2013, ApJ, 772, 45, doi: 10.1088/0004-637X/772/1/45
Elia, D., Molinari, S., Fukui, Y., et al. 2013, ApJ, 772, 45, doi: 10.1088/0004-637X/772/1/45
-
[16]
2017, MNRAS, 471, 100, doi: 10.1093/mnras/stx1357
Elia, D., Molinari, S., Schisano, E., et al. 2017, MNRAS, 471, 100, doi: 10.1093/mnras/stx1357
-
[17]
The 360 catalogue of clump physical properties
Elia, D., Merello, M., Molinari, S., et al. 2021, MNRAS, 504, 2742, doi: 10.1093/mnras/stab1038
-
[18]
2016, MNRAS, 457, 375, doi: 10.1093/mnras/stv2880
Federrath, C. 2016, MNRAS, 457, 375, doi: 10.1093/mnras/stv2880
-
[19]
S., Schmidt, W., & Mac Low, M.-M
Federrath, C., Roman-Duval, J., Klessen, R. S., Schmidt, W., & Mac Low, M.-M. 2010, A&A, 512, A81, doi: 10.1051/0004-6361/200912437
-
[20]
Feng, J., Smith, R. J., Hacar, A., Clark, S. E., & Seifried, D. 2024, MNRAS, 528, 6370, doi: 10.1093/mnras/stae407
-
[21]
A., Mackey, J., Grassitelli, L., Romano-D´ ıaz, E., & Porciani, C
Fichtner, Y. A., Mackey, J., Grassitelli, L., Romano-D´ ıaz, E., & Porciani, C. 2024, A&A, 690, A72, doi: 10.1051/0004-6361/202449638
-
[22]
Fiege, J. D., & Pudritz, R. E. 2000, MNRAS, 311, 85, doi: 10.1046/j.1365-8711.2000.03066.x
-
[23]
2023, A&A, 675, A119, doi: 10.1051/0004-6361/202245784 18
Ge, Y., Wang, K., Duarte-Cabral, A., et al. 2023, A&A, 675, A119, doi: 10.1051/0004-6361/202245784 18
-
[24]
Geen, S., Watson, S. K., Rosdahl, J., et al. 2018, MNRAS, 481, 2548, doi: 10.1093/mnras/sty2439 G´ omez, G. C., & V´ azquez-Semadeni, E. 2014, ApJ, 791, 124, doi: 10.1088/0004-637X/791/2/124
-
[25]
Hacar, A., Clark, S. E., Heitsch, F., et al. 2023, in Astronomical Society of the Pacific Conference Series, Vol. 534, Protostars and Planets VII, ed. S. Inutsuka, Y. Aikawa, T. Muto, K. Tomida, & M. Tamura, 153, doi: 10.48550/arXiv.2203.09562
-
[26]
2020, MNRAS, 495, 758, doi: 10.1093/mnras/staa1202
Heigl, S., Gritschneder, M., & Burkert, A. 2020, MNRAS, 495, 758, doi: 10.1093/mnras/staa1202
-
[27]
D., Caselli, P., Fontani, F., Jim´ enez-Serra, I., & Tan, J
Henshaw, J. D., Caselli, P., Fontani, F., Jim´ enez-Serra, I., & Tan, J. C. 2014, MNRAS, 440, 2860, doi: 10.1093/mnras/stu446
-
[28]
Hildebrand, R. H. 1983, QJRAS, 24, 267
1983
-
[29]
Howard, A. D. P., Whitworth, A. P., Griffin, M. J., Marsh, K. A., & Smith, M. W. L. 2021, MNRAS, 504, 6157, doi: 10.1093/mnras/stab1166 Ib´ a˜ nez-Mej´ ıa, J. C., Mac Low, M.-M., Klessen, R. S., &
-
[30]
2017, ApJ, 850, 62, doi: 10.3847/1538-4357/aa93fe
Baczynski, C. 2017, ApJ, 850, 62, doi: 10.3847/1538-4357/aa93fe
-
[31]
2019, A&A, 622, A79, doi: 10.1051/0004-6361/201834354
Juvela, M. 2019, A&A, 622, A79, doi: 10.1051/0004-6361/201834354
-
[32]
2009, A&A, 508, L35, doi: 10.1051/0004-6361/200913605
Kainulainen, J., Beuther, H., Henning, T., & Plume, R. 2009, A&A, 508, L35, doi: 10.1051/0004-6361/200913605
-
[33]
Kainulainen, J., & Tan, J. C. 2013, A&A, 549, A53, doi: 10.1051/0004-6361/201219526
-
[34]
Kauffmann, J., Bertoldi, F., Bourke, T. L., Evans, N. J., I., & Lee, C. W. 2008, A&A, 487, 993, doi: 10.1051/0004-6361:200809481
-
[35]
Kelly, B. C. 2007, ApJ, 665, 1489, doi: 10.1086/519947
-
[36]
Kirk, H., Myers, P. C., Bourke, T. L., et al. 2013, ApJ, 766, 115, doi: 10.1088/0004-637X/766/2/115
-
[37]
Koch, E. W., & Rosolowsky, E. W. 2015, MNRAS, 452, 3435, doi: 10.1093/mnras/stv1521 K¨ onyves, V., Andr´ e, P., Men’shchikov, A., et al. 2015, A&A, 584, A91, doi: 10.1051/0004-6361/201525861
-
[38]
Kritsuk, A. G., Norman, M. L., & Wagner, R. 2011, ApJL, 727, L20, doi: 10.1088/2041-8205/727/1/L20
-
[39]
Krumholz, M. R., & McKee, C. F. 2008, Nature, 451, 1082, doi: 10.1038/nature06620
-
[40]
Kumar, M. S. N., Arzoumanian, D., Men’shchikov, A., et al. 2022, A&A, 658, A114, doi: 10.1051/0004-6361/202140363
-
[41]
Inutsuka, S. I. 2020, A&A, 642, A87, doi: 10.1051/0004-6361/202038232
-
[42]
A., Strom, K
Lada, E. A., Strom, K. M., & Myers, P. C. 1993, in Protostars and Planets III, ed. E. H. Levy & J. I. Lunine, 245
1993
-
[43]
Larson, R. B. 1985, MNRAS, 214, 379, doi: 10.1093/mnras/214.3.379
-
[44]
Li, G.-X., Urquhart, J. S., Leurini, S., et al. 2016, A&A, 591, A5, doi: 10.1051/0004-6361/201527468
-
[45]
Lu, X., Zhang, Q., Liu, H. B., et al. 2018, ApJ, 855, 9, doi: 10.3847/1538-4357/aaad11
-
[46]
2022, MNRAS, 510, 1697, doi: 10.1093/mnras/stab3517
Lu, Z.-J., Pelkonen, V.-M., Juvela, M., et al. 2022, MNRAS, 510, 1697, doi: 10.1093/mnras/stab3517
-
[47]
2020, ApJ, 904, 58, doi: 10.3847/1538-4357/abbd8f
Lu, Z.-J., Pelkonen, V.-M., Padoan, P., et al. 2020, ApJ, 904, 58, doi: 10.3847/1538-4357/abbd8f
-
[48]
2023, A&A, 676, A15, doi: 10.1051/0004-6361/202346248
Ma, Y., Zhou, J., Esimbek, J., et al. 2023, A&A, 676, A15, doi: 10.1051/0004-6361/202346248
-
[49]
McKee, C. F., & Tan, J. C. 2002, Nature, 416, 59, doi: 10.1038/416059a
-
[50]
2011, A&A, 530, A133, doi: 10.1051/0004-6361/201014752
Molinari, S., Schisano, E., Faustini, F., et al. 2011, A&A, 530, A133, doi: 10.1051/0004-6361/201014752
-
[51]
2010, A&A, 518, L100, doi: 10.1051/0004-6361/201014659
Molinari, S., Swinyard, B., Bally, J., et al. 2010, A&A, 518, L100, doi: 10.1051/0004-6361/201014659
-
[52]
2018, ARA&A, 56, 41, doi: 10.1146/annurev-astro-091916-055235
Motte, F., Bontemps, S., & Louvet, F. 2018, ARA&A, 56, 41, doi: 10.1146/annurev-astro-091916-055235
-
[53]
Myers, P. C. 2009, ApJ, 700, 1609, doi: 10.1088/0004-637X/700/2/1609
-
[54]
1994, A&A, 291, 943
Ossenkopf, V., & Henning, T. 1994, A&A, 291, 943
1994
-
[55]
1964, ApJ, 140, 1056, doi: 10.1086/148005
Ostriker, J. 1964, ApJ, 140, 1056, doi: 10.1086/148005
-
[56]
2017, ApJ, 840, 48, doi: 10.3847/1538-4357/aa6afa
Padoan, P., Haugbølle, T., Nordlund, ˚A., & Frimann, S. 2017, ApJ, 840, 48, doi: 10.3847/1538-4357/aa6afa
-
[57]
2016a, ApJ, 826, 140, doi: 10.3847/0004-637X/826/2/140
Padoan, P., Juvela, M., Pan, L., Haugbølle, T., & Nordlund, ˚A. 2016a, ApJ, 826, 140, doi: 10.3847/0004-637X/826/2/140
-
[58]
Padoan, P., Nordlund, A., & Jones, B. J. T. 1997, MNRAS, 288, 145, doi: 10.1093/mnras/288.1.145
-
[59]
2016b, ApJ, 822, 11, doi: 10.3847/0004-637X/822/1/11
Padoan, P., Pan, L., Haugbølle, T., & Nordlund, ˚A. 2016b, ApJ, 822, 11, doi: 10.3847/0004-637X/822/1/11
-
[60]
2020, ApJ, 900, 82, doi: 10.3847/1538-4357/abaa47
Padoan, P., Pan, L., Juvela, M., Haugbølle, T., & Nordlund, ˚A. 2020, ApJ, 900, 82, doi: 10.3847/1538-4357/abaa47
-
[61]
2023, MNRAS, 522, 3548, doi: 10.1093/mnras/stad1213
Padoan, P., Pelkonen, V.-M., Juvela, M., Haugbølle, T., & Nordlund, ˚A. 2023, MNRAS, 522, 3548, doi: 10.1093/mnras/stad1213
-
[62]
2016, ApJ, 825, 30, doi: 10.3847/0004-637X/825/1/30
Pan, L., Padoan, P., Haugbølle, T., & Nordlund, ˚A. 2016, ApJ, 825, 30, doi: 10.3847/0004-637X/825/1/30
-
[63]
Andrews, J. J. 2017, MNRAS, 466, 2529, doi: 10.1093/mnras/stw3060
-
[64]
1998, PhRvE, 58, 4501, doi: 10.1103/PhysRevE.58.4501
Passot, T., & V´ azquez-Semadeni, E. 1998, PhRvE, 58, 4501, doi: 10.1103/PhysRevE.58.4501
-
[65]
Peretto, N., Fuller, G. A., Duarte-Cabral, A., et al. 2013, A&A, 555, A112, doi: 10.1051/0004-6361/201321318
-
[66]
Peretto, N., Fuller, G. A., Andr´ e, P., et al. 2014, A&A, 561, A83, doi: 10.1051/0004-6361/201322172 19
-
[67]
Pillsworth, R., & Pudritz, R. E. 2024, MNRAS, 528, 209, doi: 10.1093/mnras/stae002
-
[68]
Pillsworth, R., Roscoe, E., Pudritz, R. E., & Koch, E. W. 2025a, ApJ, 987, 20, doi: 10.3847/1538-4357/add68a —. 2025b, ApJ, 989, 233, doi: 10.3847/1538-4357/adf62c
-
[69]
Potdar, A., Das, S. R., Issac, N., et al. 2022, MNRAS, 510, 658, doi: 10.1093/mnras/stab3479
-
[70]
Rawat, V., Samal, M. R., Zavagno, A., et al. 2025, MNRAS, 540, 2377, doi: 10.1093/mnras/staf807
-
[71]
Rawat, V., Samal, M. R., Walker, D. L., et al. 2024, MNRAS, 528, 2199, doi: 10.1093/mnras/stae060
-
[72]
Schisano, E., Rygl, K. L. J., Molinari, S., et al. 2014, ApJ, 791, 27, doi: 10.1088/0004-637X/791/1/27
-
[73]
2020, MNRAS, 492, 5420, doi: 10.1093/mnras/stz3466
Schisano, E., Molinari, S., Elia, D., et al. 2020, MNRAS, 492, 5420, doi: 10.1093/mnras/stz3466
-
[74]
The spatial distribution of dense cores during the evolution of cluster-forming massive clumps
Schisano, E., Molinari, S., Coletta, A., et al. 2026, A&A, 707, A221, doi: 10.1051/0004-6361/202555619
-
[75]
2010, A&A, 520, A49, doi: 10.1051/0004-6361/201014481
Schneider, N., Csengeri, T., Bontemps, S., et al. 2010, A&A, 520, A49, doi: 10.1051/0004-6361/201014481
-
[76]
2012, A&A, 540, L11, doi: 10.1051/0004-6361/201118566
Schneider, N., Csengeri, T., Hennemann, M., et al. 2012, A&A, 540, L11, doi: 10.1051/0004-6361/201118566
-
[77]
2013, ApJL, 766, L17, doi: 10.1088/2041-8205/766/2/L17
Schneider, N., Andr´ e, P., K¨ onyves, V., et al. 2013, ApJL, 766, L17, doi: 10.1088/2041-8205/766/2/L17
-
[78]
2015, A&A, 575, A79, doi: 10.1051/0004-6361/201423569
Schneider, N., Ossenkopf, V., Csengeri, T., et al. 2015, A&A, 575, A79, doi: 10.1051/0004-6361/201423569
-
[79]
2022, A&A, 666, A165, doi: 10.1051/0004-6361/202039610
Schneider, N., Ossenkopf-Okada, V., Clarke, S., et al. 2022, A&A, 666, A165, doi: 10.1051/0004-6361/202039610
-
[80]
2017, MNRAS, 467, 4467, doi: 10.1093/mnras/stx399
Seifried, D., S´ anchez-Monge,´A., Suri, S., & Walch, S. 2017, MNRAS, 467, 4467, doi: 10.1093/mnras/stx399
discussion (0)
Sign in with ORCID, Apple, or X to comment. Anyone can read and Pith papers without signing in.