REVIEW 3 major objections 5 minor 20 references
Dashboard2Code: Evaluating Multimodal Models on Reconstructing Interactive Dashboards
T0 review · 3 major / 5 minor · reviewed 2026-07-11 · grok-4.5
Pith's one-line read Even the strongest multimodal models struggle to rebuild interactive dashboards by actively exploring them and writing faithful code.
desk verdict Useful new proactive-exploration-to-code task and Plotly+Dash benchmark; the hardness and open/closed gap claims are well supported, with narrow but honest scope limits. read the letter →
The pith
A machine-rendered reading of the paper's core claim, the machinery that carries it, and where it could break.
The reading
What carries the argument
The Dashboard2Code active-exploration loop (model navigates the live dashboard, collects its own interaction feedback, then emits reproducing Plotly+Dash code) together with the DashboardMimic benchmark and the hybrid automated evaluator that combines code-semantics scores with dynamic figure-similarity and behavior-consistency tests.
What would settle it
A new model that scores high on the automated metric yet is consistently rated by human judges as mismatched in interaction logic or visual detail on the same human-rated sample set would falsify both the metric's validity and the reported performance gaps.
Extended reading notes
Core claim
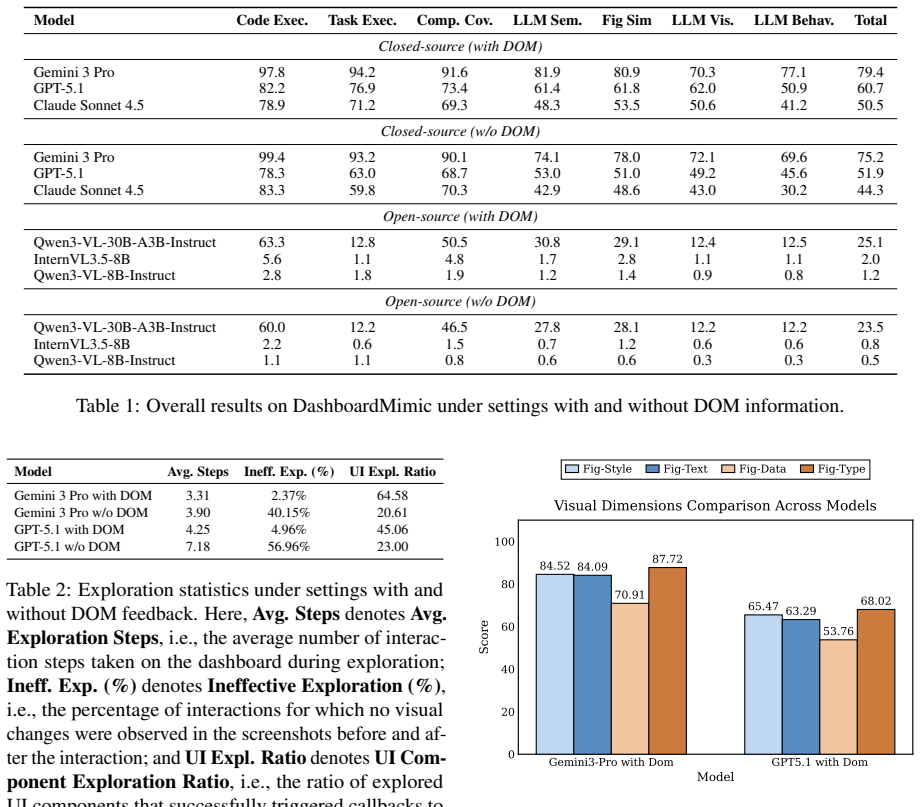
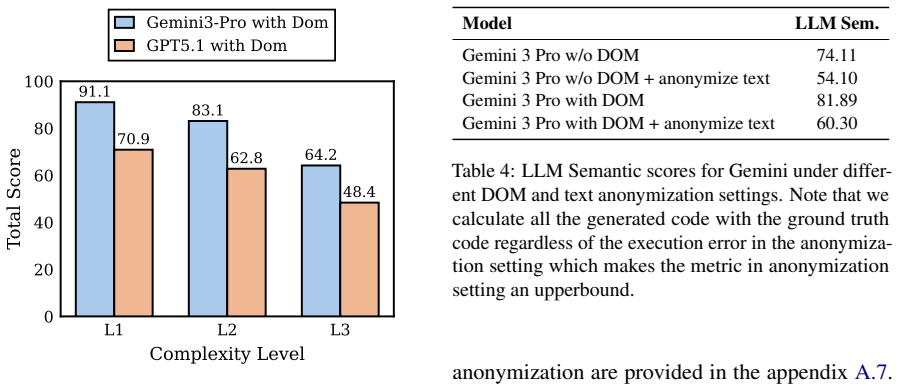
Dashboard2Code is a genuine open challenge: even the strongest evaluated multimodal systems achieve only middling overall fidelity and drop further on high-complexity multi-callback dashboards, while open-source models remain far behind, especially when forced to rely on screenshots alone or when textual labels are anonymized.
Load-bearing premise
The weighted automated metric, tuned and validated on a human-rated subset of ninety dashboards, is assumed to remain a faithful proxy for true visual-and-interaction fidelity across the full benchmark and future models.
Editorial extensions
If this is right
- Static chart-to-code benchmarks understate the difficulty of programming real interactive data interfaces.
- GUI agents will need stronger long-horizon exploration and causal-graph recovery before they can reliably reverse-engineer dashboards.
- Removing structured UI trees or control labels exposes heavy reliance on surface text cues rather than true interaction semantics.
- Hybrid static-plus-dynamic evaluation will become necessary for any claim of faithful interactive UI reconstruction.
- The open-versus-closed performance gap on this task points to missing capabilities in open multimodal models beyond simple visual recognition.
Reading between the lines
- Improvements in exploration completeness may yield larger gains than pure code-generation skill for reverse-engineering interactive apps.
- The same active-reconstruction protocol could diagnose similar gaps in other stateful interfaces such as spreadsheets or multi-step forms.
- Synthetic dashboards generated under controlled taxonomies may systematically under- or over-estimate difficulty relative to messy production systems.
- Text anonymization results suggest many current systems still shortcut via label heuristics rather than learning callback graphs from trajectories.
Editorial analysis
A structured set of objections, weighed in public.
Referee Report
Summary. The paper introduces Dashboard2Code: a multimodal agent must proactively explore a live interactive dashboard (click, filter, drag, etc.), integrate its own interaction feedback, and emit Plotly+Dash code that reproduces both visual appearance and callback logic. To support the task it releases DashboardMimic (180 manually verified dashboard–code pairs: 58 real + 122 LLM-augmented), spanning three callback-complexity levels and eight interaction patterns, plus an automated evaluation stack that mixes static code-semantic metrics with dynamic task-based testing (Figure Similarity, LLM-visual, LLM-behavior). Experiments on closed- and open-source VLMs show that even Gemini 3 Pro reaches only 79.4 overall and 64.2 on Complexity L3, that open-source models lag sharply, and that removing DOM or anonymizing control text substantially degrades semantic/callback fidelity.
Significance. If the empirical picture holds, the work supplies a missing intermediate benchmark between static chart-to-code and open-ended GUI agents, with a concrete, reproducible Python target (Plotly+Dash under MIT). Strengths that should be credited include: explicit filtering principles and dual human recheck; multi-generator synthesis plus a rewrite-and-refactor contamination pipeline with n-gram/embedding checks; a judge-free Figure Similarity metric; human correlation of the aggregate score (Pearson r=0.78 on 90 dashboards); and a useful suite of ablations (DOM on/off, text anonymization, role separation, error typology). These make DashboardMimic a practical resource for measuring active exploration, long-horizon visual reasoning, and interactive code generation.
major comments (3)
- [§4.4, A.4.2] §4.4 and A.4.2: the final Score weights (0.1 KCC + 0.3 LLM-sem + 0.2 FigSim + 0.2 LLM-vis + 0.2 LLM-beh) are obtained by optimizing correlation against human ratings on the same 90-dashboard set used for validation. This is a mild circularity risk for the meta-metric. Please report (i) leave-one-out or held-out weight stability, (ii) unweighted / equal-weight aggregates, and (iii) primary model rankings under the judge-free components alone (Code Exec., Comp. Cov., FigSim). The central hardness claim is already visible in those components, so this is a transparency fix rather than a redesign.
- [Table 1, §5.2] Table 1 / §5.2: open-source models show very low Code Exec. rates (e.g., InternVL3.5-8B 5.6%, Qwen3-VL-8B 2.8%). The reported open/closed gap therefore conflates general executable-code generation skill with the Dashboard2Code-specific abilities (active exploration, callback recovery). A controlled follow-up—e.g., providing a layout skeleton or measuring only among successfully executing generations—would better isolate the contribution of interactive exploration. Without it, the claim that open-source models specifically fail at Dashboard2Code remains only partially supported.
- [§3.4, A.3.5] §3.4 and A.3.5: 122/180 dashboards are LLM-synthesized (including Gemini/GPT/Claude families that are also evaluated). Although multi-generator synthesis and human filtering reduce single-model bias, the paper should report a real-seed (n=58) vs. synthetic (n=122) performance split for at least the top closed-source models. If rankings or absolute scores differ materially on the real subset, that should be stated; if they do not, the split still strengthens the contamination/favoritism defense.
minor comments (5)
- [A.4.3] A.4.3 cross-judge table is helpful but only covers Gemini 3 Pro and GPT-5.1 generators. Extending the same GPT-5.1-as-judge check to Claude Sonnet 4.5 (or reporting Spearman rank agreement across judges) would further reassure readers about self-preference.
- [Figure 5, §5.3.4] Figure 5 error typology is informative; adding absolute counts (not only percentages) per complexity level would make the L3 shift toward State Misinterpretation easier to interpret.
- [§4.4, A.4.5] Eq. (5) and Eq. (6) use free sub-weights (FigureSimilarity: 0.3 Data / 0.2 Style / 0.2 Type / 0.3 Text). Briefly justify these choices or show sensitivity; they are currently listed without derivation.
- [Limitations] Limitations correctly note Plotly+Dash-only scope; a short forward-looking paragraph on what would change under React/Tableau targets would help readers gauge generalizability without overclaiming.
- [§1, A.1] Minor typography: “end -to-end”, “front -end”, “multi -modal” spacing inconsistencies appear in the introduction and related-work sections; unify hyphenation.
Circularity Check
No significant circularity: empirical benchmark paper whose claims are measured model scores, not derivations forced by inputs or self-citation.
full rationale
Dashboard2Code / DashboardMimic is a systems and evaluation paper. Its central claims (task hardness, Gemini 3 Pro at 79.4 overall / 64.2 on L3, open-source gap, DOM and text-anonymization ablations) are direct experimental measurements on a constructed benchmark of 180 dashboard–code pairs, reported via multiple sub-metrics (code exec, task exec, component coverage, FigSim, LLM-sem/vis/beh) plus human correlation. There is no mathematical derivation chain, no uniqueness theorem, and no result that reduces by construction to a fitted parameter or self-cited premise. Metric weights (Eq. 5) are optimized once against human ratings on 90 samples to maximize Pearson correlation (r=0.78); this is ordinary composite-metric calibration and is not used to “predict” a quantity that was itself the fit target. Synthetic dashboards are LLM-generated then human-filtered; that is construction bias risk, not definitional circularity. Self-citations (e.g., Chart2Code53) appear only in related work and are not load-bearing. The paper is therefore self-contained against its own external measurements; score 0 is the correct honest finding.
Assumptions & free parameters
free parameters (3)
- Final score metric weights (0.1 KCC, 0.3 LLM-sem, 0.2 FigSim, 0.2 LLM-vis, 0.2 LLM-beh)
- FigureSimilarity sub-weights (0.3 Data, 0.2 Style, 0.2 Type, 0.3 Text)
- Interaction step limit (25) and viewport (1920×1080)
assumptions (4)
- domain assumption Plotly+Dash with a restricted library set is a sufficient controlled proxy for studying interactive dashboard reconstruction.
- domain assumption Eight callback-topology subtypes in three levels cover common real-world dashboard interaction patterns.
- domain assumption LLM-as-judge scores (semantic/visual/behavior) plus figure-JSON similarity are valid proxies when correlated with human raters.
- standard math Standard multimodal agent action space (click, drag, scroll, etc.) and Selenium Chrome rendering faithfully expose dashboard state.
invented entities (3)
-
Dashboard2Code task
independent evidence
-
DashboardMimic benchmark (180 pairs)
independent evidence
-
Dashboard-specific automated evaluation framework
independent evidence
Cite this review
Pith. "Pith review of Dashboard2Code: Evaluating Multimodal Models on Reconstructing Interactive Dashboards." pith.science (2026). https://pith.science/paper/JJQXGDBP
@misc{pith2026260704727,
  author       = {Pith},
  title        = {Pith review of: Dashboard2Code: Evaluating Multimodal Models on Reconstructing Interactive Dashboards},
  year         = {2026},
  howpublished = {\url{https://pith.science/paper/JJQXGDBP}},
  note         = {Machine review of arXiv:2607.04727}
}
read the original abstract
Automatic data visualization generation has advanced rapidly with multi-modal large language models, yet existing efforts largely focus on static charts and overlook the interactive dashboards commonly used for real-world data exploration. We introduce Dashboard2Code, a novel task that requires a model to proactively explore an interactive dashboard, acquire and integrate feedback from its own interactions (e.g., clicking and filtering), and generate code that reproduces the target dashboard. To support comprehensive evaluation, we present DashboardMimic, the first Plotly+Dash benchmark for Dashboard2Code, comprising 180 carefully designed and manually verified dashboard-code pairs spanning three difficulty levels and covering eight common real-world interaction patterns. We further propose an automated evaluation framework tailored to dashboards that combines code semantic analysis with dynamic interaction-based testing to assess visual and interaction consistency, showing strong agreement with human judgments. Experiments across a range of open- and closed-source multi-modal models reveal that even the strongest systems struggle on high-complexity dashboards and that a substantial performance gap remains between open-source and closed-source models on the Dashboard2Code task.
Figures


Figures from the paper (30 more)




Reference graph
Works this paper leans on
-
[1]
End-to-end chart summarization via vi- sual chain-of-thought in vision-language models. Preprint, arXiv:2502.17589. Aaryaman Kartha, Ahmed Masry, Mohammed Saidul Islam, Thinh Lang, Shadikur Rahman, Ridwan Mah- bub, Mizanur Rahman, Mahir Ahmed, Md Rizwan Parvez, Enamul Hoque, and Shafiq Joty. 2025. Dash- boardqa: Benchmarking multimodal agents for ques- ti...
arXiv 2025
-
[2]
toy datasets
focus on evaluating the capability to gen- erate code from static front -end representations. More recently, multi-modal code generation has been expanded to multiple domains, including image-to-CAD, chart-to-code (Yang et al., 2025; Tang et al., 2025a; Niu et al., 2025; Zhao et al., 2025), slide -to-code (Tang et al., 2025b), and paper-to-poster (Pang et...
2025
-
[3]
System Instruction:A static definition of the agent’s role, action space (Click, Scroll, Drag, etc.), and strict JSON output format
-
[4]
To optimize memory usage and enhance rea- soning reliability, we implement an optional Context Compression mechanism
Conversation History (Context Compres- sion):A chronological log of previous turns. To optimize memory usage and enhance rea- soning reliability, we implement an optional Context Compression mechanism. When en- abled, screenshots in the user’s history mes- sages are resized to a lower resolution (480×
-
[5]
before being stored. Empirical Benefit:Our experiments indicate that this strategy serves a dual purpose: it reduces token consumption and, more impor- tantly, channels the model’s attention toward the current observation. By reducing the vi- sual saliency of past states, the agent is less prone to hallucinations derived from obsolete visual details, ther...
-
[6]
This includes: • The High-Resolution screenshot (1920×
Current Observation:The active input for the current stept. This includes: • The High-Resolution screenshot (1920×
1920
-
[7]
thinking
to ensure fine-grained visual de- tails are legible for the immediate task. • (Optional) The extracted DOM list is in- jected as text into the user prompt, ex- plicitly informing the agent of the exact coordinates of valid interactive zones. Prompts and ExamplesWe show the prompt for evaluation in Figure 11, the example for evaluation generation process i...
-
[8]
Visual View (Screenshot Crop)
Show all 20 references
-
[9]
box": [337, 349, 366, 14],
Pruned DOM Representation (Input to Agent) [ { "box": [337, 349, 366, 14], "id": 0, "role": "slider_container" }, { "box": [330, 349, 14, 14], "id": 1, "role": "slider_handle" }, { "box": [696, 349, 14, 14], "id": 2, "role": "slider_handle" }, { "box": [312, 444, 416, 36], "id...
1919
-
[10]
amount": int,
scroll: Perform a vertical scroll action. If x/y are provided, moves mouse there first. Params: {"amount": int, "x": int (optional), "y": int (optional)}(-up, +down)
-
[11]
from_x": int,
drag: Perform a click-and-drag operation from start to end coordinates. Params: {"from_x": int, "from_y": int, "to_x": int, "to_y": int}
-
[12]
x": int,
replace_text: Click at a coordinate, select all existing text (Ctrl+A), and type new text. Params: {"x": int, "y": int, "text": str} 7.mark: visually mark a coordinate for reference in the next step. Params:{"x": int, "y": int} 8.DONE: Exploration finished. Params: None. (Requ...
-
[13]
Layout & Components (0-20): Are all figures and interactive components present? Does the arrangement match the GT image? 2.Chart Types (0-20): Are all chart types correct (e.g., Bar vs Line vs Scatter)? 3.Text Content (0-10): Do the Main Titles, Axis Titles, Legend Texts and A...
-
[14]
layout_score
Style & Aesthetics (0-20): Does the GEN match the GT in terms of colors, marker types, legends, grids, and backgrounds? 6.Clarity (0-10): Is the layout clean? Are there any overlapping elements or broken CSS? ### Output Format: Return a JSON object with specific scores and spe...
-
[15]
GT Start (Before Task)
-
[16]
GEN Start (Before Task)
-
[17]
dynamic_behavior_consistency_score
GEN End (After Task) Your task: Compare the CHANGES from Image 1→2 (GT Delta) with the CHANGES from Image 3→4 (GEN Delta). Focus ONLY on behavior consistency: • Did the same data values change in both? • Did the same visual elements get highlighted/updated? • Did the same cont...
-
[18]
Do not modify the code logic, variable names, callback functions, chart contents, or data processing parts
-
[19]
Only modify the displayed text in the layout to anonymized labels
-
[20]
Global Controller
The anonymized text should be meaningful (not empty), but should be as generic as possible so that it’s hard to infer any specific functionality or logic from the text. Here is the code: {python code} Figure 18: Prompt for Anonymize the text in dash app layout. (a) Initial sta...
Reviewed July 11, 2026 · model on record in the stance chip above.
Discussion (0). Sign in to comment.