What Can Eye Gaze Teach Us About Real-World Cycling? Insights From the Oxford RobotCycle Project
Pith reviewed 2026-06-28 04:13 UTC · model grok-4.3
The pith
Eye gaze patterns change across bike lanes, car lanes, and bus lanes, showing different cognitive challenges for cyclists.
A machine-rendered reading of the paper's core claim, the machinery that carries it, and where it could break.
Core claim
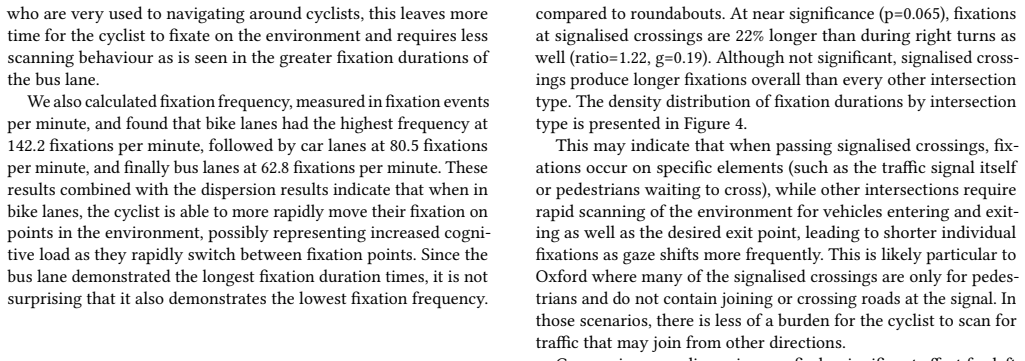
Eye gaze patterns change between using bike lanes, car lanes and shared bus lanes, representing different cognitive challenges of each lane type. Different intersections have significantly different eye gaze patterns which may have implications for cyclist stress. Eye gaze patterns differ in the presence of events such as passes and pedestrians in the road compared to when cycling with no events. This shows wearable eye trackers can estimate stress and workload in real cycling conditions.
What carries the argument
Wearable eye tracking glasses that record gaze direction to expose subconscious cognitive demands in varying road environments.
If this is right
- Cyclists encounter distinct cognitive loads in bike lanes versus car lanes or shared bus lanes.
- Certain intersections produce gaze patterns that may correspond to higher stress.
- Events such as vehicle passes or pedestrians alter gaze compared with uneventful segments.
- Wearable eye trackers provide a practical method to measure real-world cyclist workload.
Where Pith is reading between the lines
- Planners could use aggregated gaze data to rank and redesign high-demand intersections or lane types.
- The same eye-tracking approach might transfer to studying perceived safety for pedestrians or drivers.
- Pairing gaze with additional sensors would test whether the patterns truly track stress levels.
Load-bearing premise
Shifts in eye gaze patterns reliably indicate subconscious perceived danger or stress.
What would settle it
A follow-up experiment that pairs eye gaze recordings with simultaneous self-reported stress scores or heart-rate measures on the same routes and checks whether the two align.
Figures


read the original abstract
Although much is known about the physical danger of cycling situations, less is understood about the perceived danger of cycling. Furthermore, perception of danger may be filtered at a subconscious level and therefore difficult for one to self-report. To this end, these subconscious perceptions can be revealed through physiological metrics such as eye gaze. This paper explores the perceived safety of cycling in Oxford, United Kingdom and explores the ability of wearable eye tracking glasses to produce insights about the differences in perception under different environments and events. This paper finds that eye gaze patterns change between using bike lanes, car lanes and shared bus lanes, representing different cognitive challenges of each lane type. This paper presents that different intersections have significantly different eye gaze patterns which may have implications for cyclist stress. Finally, eye gaze patterns differ in the presence of events such as passes and pedestrians in the road compared to when cycling with no events. This paper draws conclusions on the benefits and limitations of using wearable eye trackers to estimate stress and cyclist workload.
Editorial analysis
A structured set of objections, weighed in public.
Referee Report
Summary. The manuscript reports on the Oxford RobotCycle Project, using wearable eye-tracking glasses to examine subconscious perceptions of danger during real-world cycling in Oxford, UK. It claims that eye gaze patterns (fixation duration, saccades, distribution) differ across bike lanes, car lanes, and shared bus lanes, reflecting distinct cognitive challenges; that gaze patterns vary significantly across different intersections with possible implications for cyclist stress; and that gaze changes occur during events such as vehicle passes and pedestrians relative to baseline no-event cycling. The paper discusses the benefits and limitations of eye trackers for estimating stress and workload.
Significance. If the gaze differences can be shown to reliably index perceived danger or workload with proper statistical support and external validation, the work could contribute to naturalistic studies of cyclist cognition and infrastructure safety using physiological signals. The approach of collecting eye data in real traffic is a strength for ecological validity, but the absence of reported sample sizes, tests, or calibration against other measures currently limits the strength of the conclusions.
major comments (3)
- [Abstract] Abstract: The abstract asserts 'significantly different' eye gaze patterns across lane types, intersections, and events, yet reports no participant count, ride count, statistical tests, p-values, effect sizes, or error bars. This absence makes it impossible to evaluate whether the central claims of difference and stress implications are supported by the data.
- [Discussion] Discussion (or Results section on interpretation): The mapping from observed gaze metric shifts to 'different cognitive challenges' and 'implications for cyclist stress/perceived danger' is presented without any reported correlation or calibration against concurrent self-report instruments (e.g., NASA-TLX), heart-rate variability, or skin conductance collected on the same rides. This validation step is load-bearing for the claim that gaze serves as a proxy for subconscious workload.
- [Methods] Methods: No description is supplied of how events (passes, pedestrians) were annotated, how gaze data were processed or filtered, or the total number of participants and trials, preventing assessment of statistical power or generalizability of the lane-type and intersection comparisons.
minor comments (1)
- [Abstract] The abstract and conclusions could more clearly separate descriptive observations from interpretive claims about stress to avoid overstatement.
Simulated Author's Rebuttal
We thank the referee for their constructive feedback on our manuscript. We address each major comment below, indicating revisions where appropriate to improve clarity, statistical transparency, and methodological detail while preserving the exploratory nature of the work.
read point-by-point responses
-
Referee: [Abstract] Abstract: The abstract asserts 'significantly different' eye gaze patterns across lane types, intersections, and events, yet reports no participant count, ride count, statistical tests, p-values, effect sizes, or error bars. This absence makes it impossible to evaluate whether the central claims of difference and stress implications are supported by the data.
Authors: We agree that the abstract should include key quantitative details to support evaluation of the claims. In the revised version we will expand the abstract to report the number of participants, number of rides, and the primary statistical results (including tests, p-values, and effect sizes) for the lane-type, intersection, and event comparisons. revision: yes
-
Referee: [Discussion] Discussion (or Results section on interpretation): The mapping from observed gaze metric shifts to 'different cognitive challenges' and 'implications for cyclist stress/perceived danger' is presented without any reported correlation or calibration against concurrent self-report instruments (e.g., NASA-TLX), heart-rate variability, or skin conductance collected on the same rides. This validation step is load-bearing for the claim that gaze serves as a proxy for subconscious workload.
Authors: The referee is correct that we did not collect concurrent self-report or additional physiological measures on the same rides. Our interpretations of gaze shifts as reflecting different cognitive challenges draw on prior literature linking fixation duration and saccade patterns to workload, but remain interpretive. We will revise the discussion to (1) explicitly state that direct validation against NASA-TLX, HRV, or skin conductance was not performed, (2) frame the stress/perceived-danger implications more cautiously as hypotheses for future work, and (3) strengthen the limitations paragraph on the current lack of external calibration. revision: partial
-
Referee: [Methods] Methods: No description is supplied of how events (passes, pedestrians) were annotated, how gaze data were processed or filtered, or the total number of participants and trials, preventing assessment of statistical power or generalizability of the lane-type and intersection comparisons.
Authors: We acknowledge the omission. The revised methods section will add: (a) a full description of event annotation (video-based labeling of vehicle passes and pedestrian encounters with inter-rater reliability), (b) details of gaze-data processing including filtering criteria, calibration procedures, and quality thresholds, and (c) the exact participant count, ride count, and trial numbers used in each analysis. These additions will enable readers to evaluate statistical power and generalizability. revision: yes
Circularity Check
No circularity: purely descriptive observational analysis with no derivations or fitted predictions
full rationale
The paper contains no equations, models, or derivations. It reports statistical comparisons of eye-gaze metrics (fixation duration, saccades, distribution) across lane types, intersections, and events. These comparisons are direct empirical observations from the collected data and do not reduce to any author-defined inputs or self-citations by construction. The interpretive link to 'cognitive challenges' and 'stress' is stated as a possible implication but is not presented as a derived result or prediction; it remains an external reading of the descriptive statistics. No self-citation load-bearing, ansatz smuggling, or renaming of known results occurs. The work is self-contained as an observational study.
Axiom & Free-Parameter Ledger
Reference graph
Works this paper leans on
-
[1]
Nima Ahmadi, Farzan Sasangohar, Jing Yang, Denny Yu, Valerie Danesh, Steven Klahn, and Faisal Masud. 2024. Quantifying workload and stress in intensive care unit nurses: preliminary evaluation using continuous eye-tracking.Human factors66, 3 (2024), 714–728
2024
-
[2]
Rachel Aldred, Anna Goodman, John Gulliver, and James Woodcock. 2018. Cy- cling injury risk in London: A case-control study exploring the impact of cycle volumes, motor vehicle volumes, and road characteristics including speed limits. Accident Analysis & Prevention117 (2018), 75–84
2018
-
[3]
Richard Andersson, Linnea Larsson, Kenneth Holmqvist, Martin Stridh, and Marcus Nyström. 2017. One algorithm to rule them all? An evaluation and discussion of ten eye movement event-detection algorithms.Behavior research methods49, 2 (2017), 616–637
2017
-
[4]
Mahnaz Behroozi and Chris Parnin. 2018. Can we predict stressful technical interview settings through eye-tracking?. InProceedings of the workshop on eye movements in programming. 1–5
2018
-
[5]
Julia Bend, Markus Gödker, Elise Sophie Banach, and Thomas Franke. 2026. Comparing Eye-Tracking Metrics with the Driver Activity Load Index.Journal of Eye Movement Research19, 2 (2026), 28
2026
-
[6]
Alvaro Caviedes and Miguel Figliozzi. 2018. Modeling the impact of traffic conditions and bicycle facilities on cyclists’ on-road stress levels.Transportation Research Part F: Traffic Psychology and Behaviour58 (2018), 488–499. doi:10.1016/ j.trf.2018.06.032
2018
-
[7]
Jakob Engel, Kiran Somasundaram, Michael Goesele, Albert Sun, Alexander Gamino, Andrew Turner, Arjang Talattof, Arnie Yuan, Bilal Souti, Brighid Mered- ith, et al. 2023. Project aria: A new tool for egocentric multi-modal ai research. arXiv preprint arXiv:2308.13561(2023)
Pith/arXiv arXiv 2023
-
[8]
John M Franchak, Brianna McGee, and Gabrielle Blanch. 2021. Adapting the coordination of eyes and head to differences in task and environment during fully-mobile visual exploration.PLoS one16, 8 (2021), e0256463
2021
-
[9]
April Gadsby, Marjan Hagenzieker, and Kari Watkins. 2021. An international comparison of the self-reported causes of cyclist stress using quasi-naturalistic cycling.Journal of Transport Geography91 (2021), 102932. doi:10.1016/j.jtrangeo. 2020.102932
-
[10]
Donna Chen, and Arsalan Heydarian
Xiang Guo, Arash Tavakoli, T. Donna Chen, and Arsalan Heydarian. 2024. Unveil- ing the Impact of Cognitive Distraction on Cyclists Psycho-Behavioral Responses in an Immersive Virtual Environment.IEEE Transactions on Intelligent Trans- portation Systems25, 8 (2024), 10274–10285. doi:10.1109/TITS.2024.3366777
-
[11]
Ignace TC Hooge, Diederick C Niehorster, Roy S Hessels, Jeroen S Benjamins, and Marcus Nyström. 2023. How robust are wearable eye trackers to slow and fast head and body movements?Behavior Research Methods55, 8 (2023), 4128–4142
2023
-
[12]
C. Jyotsna and J. Amudha. 2018. Eye Gaze as an Indicator for Stress Level Analysis in Students. In2018 International Conference on Advances in Computing, Communications and Informatics (ICACCI). 1588–1593. doi:10.1109/ICACCI.2018. 8554715
-
[13]
Krakowczyk, David R
Daniel G. Krakowczyk, David R. Reich, Jakob Chwastek, Deborah N. Jakobi, Paul Prasse, Assunta Süss, Oleksii Turuta, Paweł Kasprowski, and Lena A. Jäger
-
[14]
In 2023 Symposium on Eye Tracking Research and Applications(Tubingen, Germany) (ETRA ’23)
pymovements: A Python Package for Processing Eye Movement Data. In 2023 Symposium on Eye Tracking Research and Applications(Tubingen, Germany) (ETRA ’23). Association for Computing Machinery, New York, NY, USA. doi:10. 1145/3588015.3590134
arXiv 2023
-
[15]
Fan Li, Gangyan Xu, and Shanshan Feng. 2021. Eye Tracking Analytics for Mental States Assessment – A Review. In2021 IEEE International Conference on Systems, Man, and Cybernetics (SMC). 2266–2271. doi:10.1109/SMC52423.2021.9658674
-
[16]
Shiyu Ma, Wenwen Zhang, Robert B. Noland, and Clinton J. Andrews. 2024. Eye tracking measures of bicyclists’ behavior and perception: A systematic review. Transportation Research Part F: Traffic Psychology and Behaviour107 (2024), 52–68. doi:10.1016/j.trf.2024.08.026
-
[17]
Alessandra Mantuano, Silvia Bernardi, and Federico Rupi. 2017. Cyclist gaze behavior in urban space: An eye-tracking experiment on the bicycle network of Bologna.Case Studies on Transport Policy5, 2 (2017), 408–416. doi:10.1016/j.cstp. 2016.06.001
-
[18]
Nijmegen: Max Planck Institute for Psycholinguistics. 2026. ELAN (Version 7.1). Computer software. https://archive.mpi.nl/tla/elan Retrieved from https://archive.mpi.nl/tla/elan
2026
-
[19]
Javier Yesid Mahecha Nuñez, Inaian Pignatti Teixeira, Antônio Nélson Ro- drigues da Silva, Peter Zeile, Luc Dekoninck, and Dick Botteldooren. 2018. The Influence of Noise, Vibration, Cycle Paths, and Period of Day on Stress Experi- enced by Cyclists.Sustainability10, 7 (2018). doi:10.3390/su10072379
-
[20]
Andrea Němcová, Veronika Svozilová, Kateřina Bucsuházy, Radovan Smíšek, Martin Mézl, Branislav Hesko, Michal Belák, Martin Bilík, Pavel Maxera, Mar- tin Seitl, Tomáš Dominik, Marek Semela, Matúš Šucha, and Radim Kolář
-
[21]
IEEE Transactions on Intelligent Transportation Systems22, 6 (2021), 3214–3233
Multimodal Features for Detection of Driver Stress and Fatigue: Review. IEEE Transactions on Intelligent Transportation Systems22, 6 (2021), 3214–3233. doi:10.1109/TITS.2020.2977762
-
[22]
Efimia Panagiotaki, Divya Thuremella, Jumana Baghabrah, Samuel Sze, Lanke Frank Tarimo Fu, Benjamin Hardin, Tyler Reinmund, Tobit Flatscher, Daniel Marques, Chris Prahacs, Lars Kunze, and Daniele de Martini. 2025. The Oxford RobotCycle Project: A Multimodal Urban Cycling Dataset for Assessing the Safety of Vulnerable Road Users.IEEE Transactions on Field ...
-
[23]
James Joseph Rawson. 2025. Eyes on the Road: Disentangling Cyclist Mental Workload at Intersections. (2025)
2025
-
[24]
Sara Rivera Olsson and Erik Elldér. 2023. Are bicycle streets cyclist-friendly? Micro-environmental factors for improving perceived safety when cycling in mixed traffic.Accident Analysis & Prevention184 (2023), 107007. doi:10.1016/j. aap.2023.107007
work page doi:10.1016/j 2023
-
[25]
Federico Rupi and Kevin J. Krizek. 2019. Visual Eye Gaze While Cycling: Analyz- ing Eye Tracking at Signalized Intersections in Urban Conditions.Sustainability 11, 21 (2019). doi:10.3390/su11216089 6
-
[26]
Dario D Salvucci and Joseph H Goldberg. 2000. Identifying fixations and saccades in eye-tracking protocols. InProceedings of the 2000 symposium on Eye tracking research & applications. 71–78
2000
-
[27]
Rul von Stülpnagel. 2020. Gaze behavior during urban cycling: Effects of subjec- tive risk perception and vista space properties.Transportation research part F: traffic psychology and behaviour75 (2020), 222–238
2020
-
[28]
Rul von Stülpnagel and Jonas Lucas. 2020. Crash risk and subjective risk per- ception during urban cycling: Evidence for congruent and incongruent sources. Accident Analysis & Prevention142 (2020), 105584
2020
-
[29]
Tongyun Yang, Bishwas Regmi, Lingyu Du, Andreas Bulling, Xucong Zhang, and Guohao Lan. 2025. Through the Eyes of Emotion: A Multi-faceted Eye Tracking Dataset for Emotion Recognition in Virtual Reality.Proc. ACM Interact. Mob. Wearable Ubiquitous Technol.9, 3, Article 143 (Sept. 2025), 41 pages. doi:10.1145/ 3749545
2025
-
[30]
Mansoureh Seyed Yousefi, Farnoush Reisi, Mohammad Reza Daliri, and Vahid Shalchyan. 2022. Stress Detection Using Eye Tracking Data: An Evaluation of Full Parameters.IEEE Access10 (2022), 118941–118952. doi:10.1109/ACCESS. 2022.3221179 7
discussion (0)
Sign in with ORCID, Apple, or X to comment. Anyone can read and Pith papers without signing in.