Far-ultraviolet flux distribution in Orion and its relation to stellar accretion
Pith reviewed 2026-06-30 04:08 UTC · model grok-4.3
The pith
External FUV radiation from massive stars in Orion causes faster depletion of accretion discs around young stars.
A machine-rendered reading of the paper's core claim, the machinery that carries it, and where it could break.
Core claim
By computing FUV fluxes at stellar positions in Orion with statistical correction for parallax uncertainties and 2D sub-cluster geometry for 3D separations, the study shows that Gaia-inferred accretion luminosities decrease with age and that the Ha detection fraction declines more rapidly in strongly irradiated regions, broadly consistent with population synthesis models of viscous discs undergoing external photoevaporation.
What carries the argument
The 2D sub-cluster geometry combined with statistical parallax correction to compute reliable 3D separations from OBA stars and thus FUV fluxes at each star's position.
If this is right
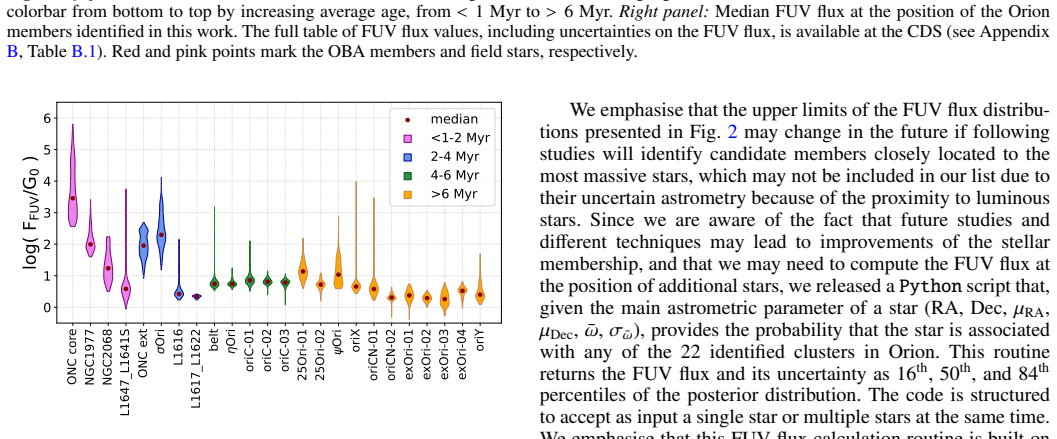
- Most stars in Orion experience weak FUV irradiation below 100 G0, with 35% intermediate and 5% above 10,000 G0.
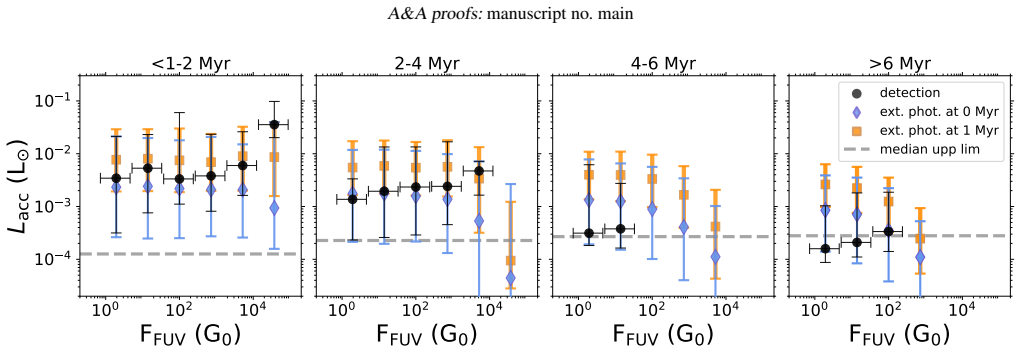
- Accretion luminosity inferred from Gaia XP spectra decreases with stellar age.
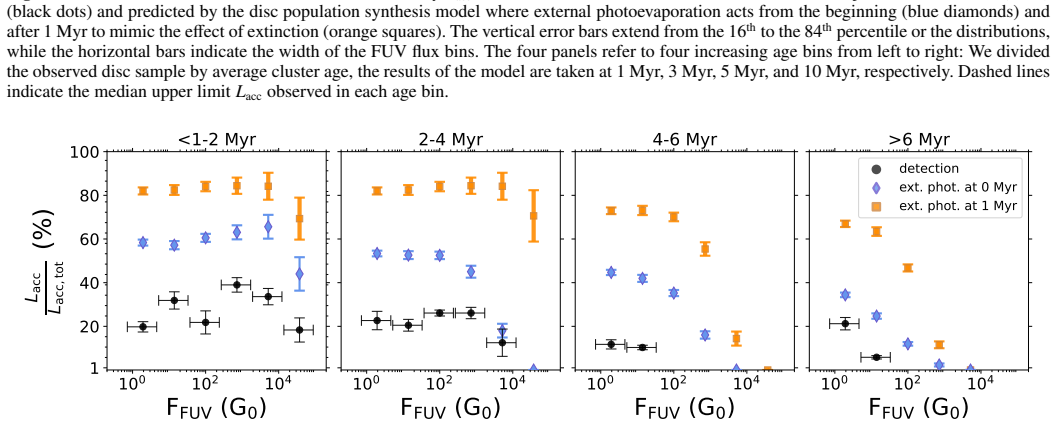
- The decline in Ha-emitting accreting stars is steeper in high-FUV environments.
- The observations align with models incorporating external photoevaporation.
- A public table of FUV fluxes enables targeted observations across flux ranges from 1 to 10^5 G0.
Where Pith is reading between the lines
- If confirmed, external photoevaporation would play a significant role in setting disc lifetimes even in moderately dense regions like Orion.
- Future 3D kinematic data could test whether the assumed geometry accurately places stars relative to the irradiating sources.
- The catalog could be used to correlate FUV exposure with other disc properties like size or mass from ALMA surveys.
Load-bearing premise
That the estimated 3D distances from OBA stars accurately reflect the true FUV exposure at each star, allowing the observed difference in accretion decline rates to be attributed to photoevaporation.
What would settle it
High-precision 3D position measurements that show no difference in the rate of Ha detection decline between stars at different computed FUV levels.
Figures

read the original abstract
Orion is the closest region hosting active star formation and young OBA stars. Computing far-ultraviolet (FUV) fluxes at its stars is essential to connect stellar and protoplanetary disc properties to the environment. We (1) accurately estimated the FUV flux at a large sample of stars in Orion by statistically accounting for the uncertainty in parallax measurements, and (2) investigated the relation between stellar accretion and external FUV flux by comparing observations and disc evolution models. We selected a large stellar population in Orion, assigned sub-cluster memberships and used 2D dimensional sub-cluster geometry to infer 3D separations from OBA stars and compute the FUV flux at stellar positions. We studied the accretion luminosities Lacc inferred from Ha emission in Gaia XP spectra of Orion sources and determined their detection fraction as a function of age and FUV flux. We compared the results with population synthesis models of viscous discs experiencing external photoevaporation. We provided a publicly available table of FUV fluxes at ~8600 stars in Orion. Most of the stellar population is weakly irradiated <10^{2} G0, ~35% is intermediately irradiated 10^{2}-10^{4} G0, and ~5% has FUV fluxes >10^{4} G0. Gaia-based Lacc decreases with age, and Ha detection fraction declines more rapidly in regions with strong FUV fluxes than in regions exposed to weaker FUV fluxes, broadly consistent with the model. This may suggest that external photoevaporation efficiently depletes strongly FUV-irradiated accretion discs, but it is not sufficient to reliably confirm this conclusion. The provided tools for computing FUV fluxes at Orion stars will be essential for future observations aimed at assessing the role of external photoevaporation on discs. We encourage measurements of stellar and disc properties in Orion, covering FUV fluxes 1-10^5 G0.
Editorial analysis
A structured set of objections, weighed in public.
Referee Report
Summary. The manuscript estimates FUV fluxes at ~8600 Orion stars by assigning sub-cluster memberships and inferring 3D separations from OBA stars via 2D projected geometry plus statistical parallax corrections. It derives Lacc from Hα in Gaia XP spectra, reports that Lacc decreases with age, and finds that the Hα detection fraction declines more rapidly in high-FUV regions than in low-FUV regions. These trends are compared to population-synthesis models of viscous discs with external photoevaporation and described as broadly consistent, although the authors explicitly state that the data are insufficient to confirm the conclusion. A public table of FUV fluxes is released.
Significance. If the FUV assignments prove robust, the work supplies a valuable public resource for environmental studies of discs in Orion and supplies tentative observational support for external photoevaporation accelerating disc dispersal. The public flux table is a clear strength that will enable future tests.
major comments (2)
- [Methods (sub-cluster geometry and 3D separation inference)] The central claim that Hα detection declines more rapidly at high FUV rests on the accuracy of the 1/r² FUV fluxes. The method uses 2D sub-cluster geometry plus statistical parallax to recover 3D separations; because flux scales as 1/r², even modest line-of-sight errors (especially for stars projected near OBA stars) can produce large flux misassignments. The manuscript should quantify this uncertainty (e.g., via Monte-Carlo realisations of parallax and depth distributions) and demonstrate that the differential decline rate survives the resulting flux errors.
- [Results (model comparison)] The comparison to disc-evolution models is described only as 'broadly consistent.' The paper should specify which quantitative model predictions (e.g., the expected difference in disc lifetime or Hα fraction between FUV bins) are being tested and report a statistical measure of agreement rather than a qualitative statement, given the authors' own caveat that the data are insufficient to confirm the conclusion.
minor comments (2)
- [Results (Hα detection fraction)] Clarify the exact definition of 'detection fraction' (e.g., signal-to-noise threshold on Hα) and any age binning choices in the relevant results section.
- [Figures] Add error bars or shaded uncertainty regions to the FUV flux histograms and age trends to reflect the statistical parallax uncertainties.
Simulated Author's Rebuttal
We thank the referee for their constructive and detailed report. We address each major comment below and will incorporate revisions to strengthen the analysis and presentation while preserving the manuscript's caveats.
read point-by-point responses
-
Referee: [Methods (sub-cluster geometry and 3D separation inference)] The central claim that Hα detection declines more rapidly at high FUV rests on the accuracy of the 1/r² FUV fluxes. The method uses 2D sub-cluster geometry plus statistical parallax to recover 3D separations; because flux scales as 1/r², even modest line-of-sight errors (especially for stars projected near OBA stars) can produce large flux misassignments. The manuscript should quantify this uncertainty (e.g., via Monte-Carlo realisations of parallax and depth distributions) and demonstrate that the differential decline rate survives the resulting flux errors.
Authors: We appreciate the referee's emphasis on rigorous uncertainty quantification for the FUV flux assignments. The manuscript already incorporates statistical parallax corrections to account for depth uncertainties in the 3D separation inference. To directly respond to this comment, we will add a dedicated Monte-Carlo analysis in the revised methods and results sections. This will consist of multiple realizations drawing from the parallax error distributions and assumed depth distributions within sub-clusters, propagating these to FUV flux uncertainties, and verifying that the observed faster decline in Hα detection fraction for high-FUV regions remains significant within the derived error envelopes. We expect this addition to confirm the robustness of the differential trend. revision: yes
-
Referee: [Results (model comparison)] The comparison to disc-evolution models is described only as 'broadly consistent.' The paper should specify which quantitative model predictions (e.g., the expected difference in disc lifetime or Hα fraction between FUV bins) are being tested and report a statistical measure of agreement rather than a qualitative statement, given the authors' own caveat that the data are insufficient to confirm the conclusion.
Authors: We agree that greater specificity in the model comparison would enhance the manuscript. In the revision, we will explicitly identify the quantitative predictions from the viscous disc population-synthesis models (including expected differences in Hα detection fractions between low- and high-FUV bins at given ages) and add a statistical measure of agreement, such as a chi-squared goodness-of-fit or Kolmogorov-Smirnov test between the binned observational fractions and the model outputs. These will be presented while retaining our original statement that the data remain insufficient for firm confirmation of external photoevaporation as the driver. revision: yes
Circularity Check
No circularity: Gaia-derived FUV fluxes and Ha trends compared to external models without fitting or self-referential definitions
full rationale
The paper computes FUV fluxes from Gaia parallaxes, 2D sub-cluster geometry, and statistical corrections, then measures Lacc and Ha detection fractions directly from Gaia XP spectra as functions of age and computed FUV. These observed trends are compared to population synthesis models from prior independent work. No equation or step defines a quantity in terms of itself, renames a fit as a prediction, or relies on a load-bearing self-citation whose result is unverified outside this dataset. The central claim remains an empirical comparison whose outcome is not forced by construction from the inputs.
Axiom & Free-Parameter Ledger
axioms (2)
- domain assumption Parallax measurements combined with 2D sub-cluster geometry can be statistically corrected to yield reliable 3D separations from OBA stars
- domain assumption Ha emission in Gaia XP spectra traces stellar accretion luminosity
Reference graph
Works this paper leans on
-
[1]
Alexander, R. D. & Armitage, P. J. 2006, ApJ, 639, L83
2006
-
[2]
Ali, A. A. & Harries, T. J. 2019, MNRAS, 487, 4890
2019
-
[3]
2025, The Open Journal of Astro- physics, 8, 54
Allen, M., Anania, R., Andersen, M., et al. 2025, The Open Journal of Astro- physics, 8, 54
2025
-
[4]
J., Rosotti, G., et al
Anania, R., Winter, A. J., Rosotti, G., et al. 2025b, A&A, 695, A74 André, P., Men’shchikov, A., Bontemps, S., et al. 2010, A&A, 518, L102
2010
-
[5]
M., Kriegel, H.-P., & Sander, J
Ankerst, M., Breunig, M. M., Kriegel, H.-P., & Sander, J. 1999, in Interna- tional Conference on Management of Data and Symposium on Principles of Database Systems Philadelphia (SIGMOD/PODS 1999), PA, USA - May 31 - June 03, 1999, ed. A. Delis, C. Faloutsos, & S. Ghandeharizadeh (New York, NY , USA: ACM), 49–60
1999
-
[6]
J., Williams, J
Ansdell, M., Haworth, T. J., Williams, J. P., et al. 2020, AJ, 160, 248
2020
-
[7]
P., Manara, C
Ansdell, M., Williams, J. P., Manara, C. F., et al. 2017, AJ, 153, 240
2017
-
[8]
L., Maucó, K., Manara, C
Aru, M. L., Maucó, K., Manara, C. F., et al. 2024, A&A, 687, A93
2024
-
[9]
2008, in Handbook of Star Forming Regions, V olume I, ed
Bally, J. 2008, in Handbook of Star Forming Regions, V olume I, ed. B. Reipurth, V ol. 4, 459
2008
-
[10]
G., Boffin, H
Beccari, G., Petr-Gotzens, M. G., Boffin, H. M. J., et al. 2017, A&A, 604, A22 Berné, O., Habart, E., Peeters, E., et al. 2024, Science, 383, 988
2017
-
[11]
D., Emig, K
Boyden, R. D., Emig, K. L., Ballering, N. P., et al. 2025, ApJ, 983, 81 Briceño, C., Calvet, N., Hernández, J., et al. 2005, AJ, 129, 907
2025
-
[12]
Caballero, J. A. & Solano, E. 2008, A&A, 485, 931
2008
-
[13]
2005, AJ, 129, 935
Calvet, N., Briceño, C., Hernández, J., et al. 2005, AJ, 129, 935
2005
-
[14]
& Kurucz, R
Castelli, F. & Kurucz, R. L. 2004, A&A, 419, 725
2004
-
[15]
2016, ApJ, 823, 102
Choi, J., Dotter, A., Conroy, C., et al. 2016, ApJ, 823, 102
2016
-
[16]
Clarke, C. J. 2007, MNRAS, 376, 1350
2007
-
[17]
Coleman, G. A. L., Mroueh, J. K., & Haworth, T. J. 2024, MNRAS, 527, 7588
2024
-
[18]
L., Sordo, R., Pailler, F., et al
Creevey, O. L., Sordo, R., Pailler, F., et al. 2023, A&A, 674, A26
2023
-
[19]
& Smith, V
Cunha, K. & Smith, V . V . 1996, A&A, 309, 892 Da Rio, N., Robberto, M., Hillenbrand, L. A., Henning, T., & Stassun, K. G. 2012, ApJ, 748, 14 De Angeli, F., Weiler, M., Montegriffo, P., et al. 2023, A&A, 674, A2 De Marchi, G., Panagia, N., & Romaniello, M. 2010, ApJ, 715, 1
1996
-
[20]
2025, arXiv e-prints, arXiv:2505.04699
Delfini, L., Vioque, M., Ribas, Á., & Hodgkin, S. 2025, arXiv e-prints, arXiv:2505.04699
-
[21]
Dolan, C. J. & Mathieu, R. D. 2001, AJ, 121, 2124
2001
-
[22]
A., Arce, H
Eisner, J. A., Arce, H. G., Ballering, N. P., et al. 2018, ApJ, 860, 77
2018
-
[23]
& Adams, F
Fatuzzo, M. & Adams, F. C. 2008, ApJ, 675, 1361
2008
-
[24]
2023, A&A, 674, A28
Fouesneau, M., Frémat, Y ., Andrae, R., et al. 2023, A&A, 674, A28
2023
-
[25]
2025, A&A, 695, A78
Frediani, J., De Simone, M., Testi, L., et al. 2025, A&A, 695, A78
2025
-
[26]
Gray, R. O. & Corbally, Christopher, J. 2009, Stellar Spectral Classification Großschedl, J. E., Alves, J., Teixeira, P. S., et al. 2019, A&A, 622, A149
2009
-
[27]
Habing, H. J. 1968, Bull. Astron. Inst. Netherlands, 19, 421
1968
-
[28]
J., Coleman, G
Haworth, T. J., Coleman, G. A. L., Qiao, L., Sellek, A. D., & Askari, K. 2023, MNRAS, 526, 4315
2023
-
[29]
Haworth, T. J. & Owen, J. E. 2020, MNRAS, 492, 5030 Hernández, J., Calvet, N., Perez, A., et al. 2014, ApJ, 794, 36
2020
-
[30]
J., Takahashi, T., & Tielens, A
Hollenbach, D. J., Takahashi, T., & Tielens, A. G. G. M. 1991, ApJ, 377, 192
1991
-
[31]
2019, PASJ, 71, S9
Ishii, S., Nakamura, F., Shimajiri, Y ., et al. 2019, PASJ, 71, S9
2019
-
[32]
D., Maxted, P
Jeffries, R. D., Maxted, P. F. L., Oliveira, J. M., & Naylor, T. 2006, MNRAS, 371, L6
2006
-
[33]
& Haworth, T
Keyte, L. & Haworth, T. J. 2025, MNRAS, 537, 598
2025
-
[34]
S., Clarke, C
Kim, J. S., Clarke, C. J., Fang, M., & Facchini, S. 2016, ApJ, 826, L15 Könyves, V ., André, P., Arzoumanian, D., et al. 2020, A&A, 635, A34
2016
-
[35]
2018, AJ, 156, 84
Kounkel, M., Covey, K., Suárez, G., et al. 2018, AJ, 156, 84
2018
-
[36]
2008, A&A, 477, 547
Kramer, C., Cubick, M., Röllig, M., et al. 2008, A&A, 477, 547
2008
-
[37]
2001, Monthly Notices of the Royal Astronomical Society, 322, 231
Kroupa, P. 2001, Monthly Notices of the Royal Astronomical Society, 322, 231
2001
-
[38]
L., et al
Lallement, R., Babusiaux, C., Vergely, J. L., et al. 2019, A&A, 625, A135 Article number, page 12
2019
-
[39]
& Pringle, J
Lynden-Bell, D. & Pringle, J. E. 1974, MNRAS, 168, 603 Maíz Apellániz, J., Alonso Moragón, A., Ortiz de Zárate Alcarazo, L., & GOSSS Team. 2017, in Highlights on Spanish Astrophysics IX, ed. S. Arribas, A. Alonso-Herrero, F. Figueras, C. Hernández-Monteagudo, A. Sánchez- Lavega, & S. Pérez-Hoyos, 509–509
1974
-
[40]
A., Rosotti, G
Malanga, L. A., Rosotti, G. P., Lodato, G., et al. 2025, A&A, 699, A292 Maucó, K., Manara, C. F., Ansdell, M., et al. 2023, A&A, 679, A82
2025
-
[41]
T., Gutermuth, R., Muzerolle, J., et al
Megeath, S. T., Gutermuth, R., Muzerolle, J., et al. 2012, AJ, 144, 192 O’Dell, C. R., Wen, Z., & Hu, X. 1993, ApJ, 410, 696
2012
-
[42]
& Galli, D
Padovani, M. & Galli, D. 2018, A&A, 620, L4
2018
-
[43]
J., & Nelson, R
Paine, S., Haworth, T. J., & Nelson, R. P. 2025, MNRAS, 539, 1414 Pantaleoni González, M., Maíz Apellániz, J., Barbá, R. H., et al. 2025, MNRAS, 543, 63
2025
-
[44]
Perryman, M. A. C., Lindegren, L., Kovalevsky, J., et al. 1997, A&A, 323, L49
1997
-
[45]
2021, A&A, 645, A55
Pezzuto, S., Benedettini, M., Di Francesco, J., et al. 2021, A&A, 645, A55
2021
-
[46]
2026, A&A, 707, A74
Pichierri, G., Rosotti, G., Anania, R., & Lodato, G. 2026, A&A, 707, A74
2026
- [47]
-
[48]
J., Sellek, A
Qiao, L., Haworth, T. J., Sellek, A. D., & Ali, A. A. 2022, MNRAS, 512, 3788
2022
-
[49]
L., Wright, N
Quintana, A. L., Wright, N. J., & Martínez García, J. 2025, MNRAS, 538, 1367
2025
-
[50]
T., Bally, J., & Walawender, J
Reipurth, B., Megeath, S. T., Bally, J., & Walawender, J. 2008, in Handbook of Star Forming Regions, V olume I, ed. B. Reipurth, V ol. 4, 782
2008
-
[51]
Ricci, L., Robberto, M., & Soderblom, D. R. 2008, AJ, 136, 2136
2008
-
[52]
2025, A&A, 702, A63
Roquette, J., Audard, M., Hernandez, D., et al. 2025, A&A, 702, A63
2025
-
[53]
Rosotti, G. P. 2023, New A Rev., 96, 101674
2023
-
[54]
D., Booth, R
Sellek, A. D., Booth, R. A., & Clarke, C. J. 2020, MNRAS, 492, 1279
2020
-
[55]
Shakura, N. I. & Sunyaev, R. A. 1973, A&A, 24, 337
1973
-
[56]
2017, A&A, 604, A74
Shimajiri, Y ., André, P., Braine, J., et al. 2017, A&A, 604, A74
2017
-
[57]
2024, A&A, 689, A285
Somigliana, A., Testi, L., Rosotti, G., et al. 2024, A&A, 689, A285
2024
-
[58]
P., Trapman, L., et al
Tabone, B., Rosotti, G. P., Trapman, L., et al. 2025, ApJ, 989, 7 van Terwisga, S. E. & Hacar, A. 2023, A&A, 673, L2 van Terwisga, S. E., Hacar, A., van Dishoeck, E. F., Oonk, R., & Portegies Zwart, S. 2022, A&A, 661, A53
2025
-
[59]
2011, A&A, 536, A105
Vernet, J., Dekker, H., D’Odorico, S., et al. 2011, A&A, 536, A105
2011
-
[60]
2023, AJ, 166, 183
Vioque, M., Cavieres, M., Pantaleoni González, M., et al. 2023, AJ, 166, 183
2023
-
[61]
J., & Nomura, H
Walsh, C., Millar, T. J., & Nomura, H. 2013, ApJ, 766, L23
2013
-
[62]
Warren, Jr., W. H. & Hesser, J. E. 1978, ApJS, 36, 497
1978
-
[63]
Weder, J., Winter, A. J., & Mordasini, C. 2025, arXiv e-prints, arXiv:2511.01972
-
[64]
J., Ansdell, M., Haworth, T
Winter, A. J., Ansdell, M., Haworth, T. J., & Kruijssen, J. M. D. 2020, MNRAS, 497, L40
2020
-
[65]
J., Benisty, M., Manara, C
Winter, A. J., Benisty, M., Manara, C. F., & Gupta, A. 2024, A&A, 691, A169
2024
-
[66]
Winter, A. J. & Haworth, T. J. 2022, European Physical Journal Plus, 137, 1132
2022
-
[67]
Wright, N. J. 2020, New A Rev., 90, 101549
2020
-
[68]
W., Frankel, N., et al
Zari, E., Rix, H. W., Frankel, N., et al. 2021, A&A, 650, A112 Article number, page 13 A&A proofs:manuscript no. main 10 4 10 2 100 102 dist [pc] 10 8 10 4 100 104 108 density function , 400 stars , 100 stars , 400 stars , 100 stars 101 102 103 104 FFUV (G0) - 400 stars 101 102 103 104 FFUV (G0) - 100 stars Fig. A.1.Left: Normalised surface (dashed lines)...
2021
-
[69]
Anania, R. et al.: Far-ultraviolet flux distribution in Orion and its relation to stellar accretion Table B.1.Table of the FUV fluxes for the Orion members of the 22 sub-clusters Gaia DR3 cluster name RA Dec pmRA pmDec d d 16 d 84 FUV flux FUV flux 16 FUV flux 84 (deg) (deg) (mas yr−1) (mas yr−1) (pc) (pc) (pc) (G0) (G0) (G0) 3012327436772983936 eta_Ori 8...
1983
-
[70]
D.1.Comparison between accretion luminosities measured from X-Shooter spectra and those measured fromH α emission from Gaia XP spectra (Delfini et al
Lacc, Gaia (L ) = 0.26, [0.36 0.16] p = 0.03, [0.003 0.1] 1:1 Ori ON Fig. D.1.Comparison between accretion luminosities measured from X-Shooter spectra and those measured fromH α emission from Gaia XP spectra (Delfini et al. 2025) in theσOrionis (Maucó et al. 2023) and the Orion Nebula (ON, Piscarreta et al. 2025) regions. The dashed line marks the 1:1 re...
2025
discussion (0)
Sign in with ORCID, Apple, or X to comment. Anyone can read and Pith papers without signing in.