Mitigating Perceptual Judgment Bias in Multimodal LLM-as-a-Judge via Perceptual Perturbation and Reward Modeling
Pith reviewed 2026-06-28 15:04 UTC · model grok-4.3
The pith
Multimodal LLM judges exhibit bias toward text over visual evidence, which training on perturbed counterfactuals and combined rewards can reduce.
A machine-rendered reading of the paper's core claim, the machinery that carries it, and where it could break.
Core claim
Perceptual Judgment Bias arises when MLLM judges anchor on response text rather than their visual perception during conflicts, and this can be mitigated by constructing the Perceptually Perturbed Judgment Dataset of minimally edited counterfactual responses that enable verifiable supervision, then applying a unified training framework with structured GRPO-based reward and batch-ranking objective to achieve improved perceptual fidelity, ranking coherence, and alignment with human evaluation.
What carries the argument
The Perceptually Perturbed Judgment Dataset, which creates minimally edited counterfactual responses to isolate perceptual errors, combined with the training framework using a GRPO-based reward and batch-ranking objective for global ordering without pairwise labels.
If this is right
- Improves perceptual fidelity on diverse MLLM-as-a-Judge benchmarks.
- Achieves coherent global ordering of responses without explicit pairwise labels.
- Increases alignment between automated judgments and human evaluations.
- Establishes a scalable pathway for training perceptually grounded multimodal judges.
Where Pith is reading between the lines
- The perturbation method could be adapted to detect and correct other reasoning biases in MLLMs, such as those involving temporal or spatial inconsistencies.
- Applying the same dataset construction to new MLLM models might reveal whether the bias is inherent to current architectures or training data.
- Success here implies that reward modeling can be used more broadly to enforce consistency between multimodal inputs and model outputs.
Load-bearing premise
Minimally edited counterfactual responses in the dataset truly isolate only perceptual errors without introducing other unintended biases or changes.
What would settle it
If retraining on the dataset does not increase the rate at which the MLLM judge selects the visually accurate response over a text-plausible but visually incorrect one in controlled conflict tests, the claim would be falsified.
Figures


read the original abstract
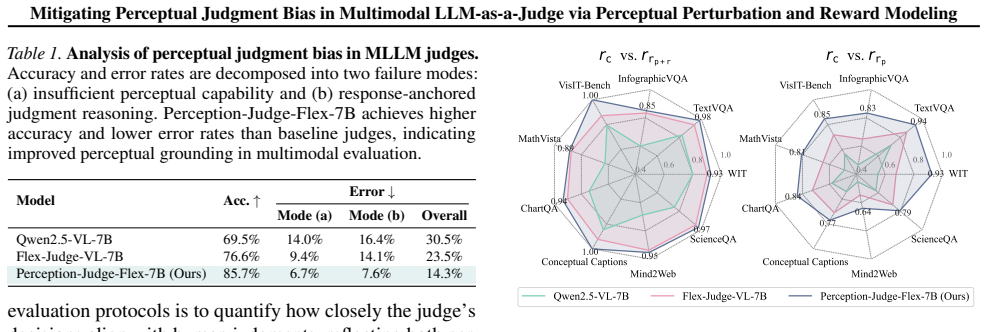
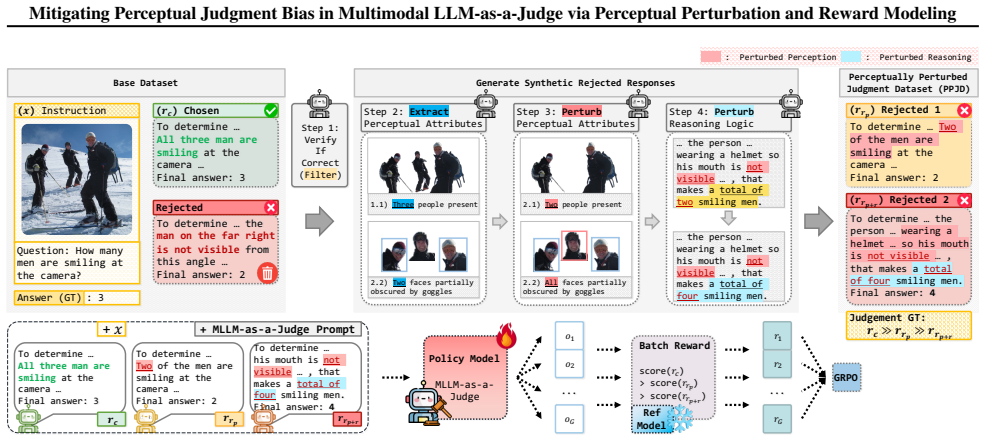
Recent multimodal large language models have demonstrated strong reasoning ability, yet their reliability as automated evaluators remains limited by a critical weakness: when visual evidence conflicts with textual cues, MLLM judges tend to reward plausible narratives over perceptually correct answers. We identify and systematically analyze this phenomenon, which we term Perceptual Judgment Bias. Through controlled visual perturbations, existing multimodal judges frequently anchor on the response text instead of their own visual perception, leading to inconsistent and non-verifiable evaluations. To address this issue, we introduce the Perceptually Perturbed Judgment Dataset, which constructs minimally edited counterfactual responses that isolate perceptual errors and enable verifiable supervision. Building on this dataset, we develop a unified training framework that combines a structured GRPO-based reward with a batch-ranking objective, achieving coherent global ordering without explicit pairwise labels. Experiments across diverse MLLM-as-a-Judge benchmarks show that our approach substantially improves perceptual fidelity, ranking coherence, and alignment with human evaluation. Our results establish a scalable and generalizable pathway for training multimodal judges that are perceptually grounded, interpretable, and robust to visual-reasoning conflicts.
Editorial analysis
A structured set of objections, weighed in public.
Referee Report
Summary. The paper identifies Perceptual Judgment Bias in MLLM-as-a-Judge settings, where models favor plausible textual narratives over conflicting visual evidence. It introduces the Perceptually Perturbed Judgment Dataset, constructed via minimally edited counterfactual responses intended to isolate perceptual errors and supply verifiable supervision. A training framework is proposed that combines a GRPO-based reward model with a batch-ranking objective to achieve coherent global ordering. Experiments on diverse MLLM-as-a-Judge benchmarks are reported to show gains in perceptual fidelity, ranking coherence, and human alignment.
Significance. If the central claims hold, the work offers a concrete pathway to improve the reliability of multimodal judges in settings where visual-textual conflicts arise, which is relevant for automated evaluation pipelines. The dataset construction and structured reward approach could generalize beyond the reported benchmarks if the isolation of perceptual signals is robust.
major comments (2)
- [Dataset construction] Dataset construction section: the central claim that the Perceptually Perturbed Judgment Dataset supplies verifiable supervision rests on the assertion that minimally edited counterfactual responses isolate perceptual errors without textual confounds. The manuscript does not provide explicit criteria for edit selection, a definition of 'minimal,' or controls demonstrating that narrative coherence and textual cues remain constant; without these, the supervision signal may be entangled and the attribution of benchmark gains to perceptual grounding cannot be verified.
- [Experiments] Experiments section: the abstract states that the approach 'substantially improves' perceptual fidelity, ranking coherence, and human alignment, yet no quantitative tables, baseline comparisons, ablation results, or error analysis are referenced in a manner that allows assessment of effect sizes or statistical significance. This leaves the empirical support for the training framework load-bearing claim unverified.
minor comments (2)
- [Method] The GRPO reward formulation and batch-ranking objective are introduced without an accompanying equation or pseudocode block; adding these would clarify how the global ordering is achieved without pairwise labels.
- [Method] Notation for the reward model components is introduced in the abstract but not consistently defined on first use in the main text.
Simulated Author's Rebuttal
We thank the referee for the constructive comments, which help clarify key aspects of our work on Perceptual Judgment Bias. We respond point-by-point below and will make targeted revisions to improve rigor and verifiability.
read point-by-point responses
-
Referee: [Dataset construction] Dataset construction section: the central claim that the Perceptually Perturbed Judgment Dataset supplies verifiable supervision rests on the assertion that minimally edited counterfactual responses isolate perceptual errors without textual confounds. The manuscript does not provide explicit criteria for edit selection, a definition of 'minimal,' or controls demonstrating that narrative coherence and textual cues remain constant; without these, the supervision signal may be entangled and the attribution of benchmark gains to perceptual grounding cannot be verified.
Authors: We agree the manuscript would benefit from greater explicitness here. In revision we will expand the Dataset Construction section with: (1) formal selection criteria (e.g., edits restricted to perceptual attributes while preserving lexical overlap and narrative flow), (2) a precise definition of 'minimal' (token-edit distance < 5% and semantic similarity > 0.95 via sentence embeddings), and (3) controls consisting of both automated checks and human verification that textual cues and coherence remain unchanged. These additions will directly support the claim of isolated perceptual supervision. revision: yes
-
Referee: [Experiments] Experiments section: the abstract states that the approach 'substantially improves' perceptual fidelity, ranking coherence, and human alignment, yet no quantitative tables, baseline comparisons, ablation results, or error analysis are referenced in a manner that allows assessment of effect sizes or statistical significance. This leaves the empirical support for the training framework load-bearing claim unverified.
Authors: The experiments section already contains quantitative tables reporting baseline comparisons, GRPO and batch-ranking ablations, error breakdowns, and human-alignment metrics across benchmarks. To make these results immediately accessible, we will revise the abstract to cite specific effect sizes and statistical significance from the tables, add a consolidated results summary, and ensure all comparisons and ablations are cross-referenced with p-values and confidence intervals in the main text. revision: yes
Circularity Check
No circularity detected; claims rest on new dataset and empirical evaluation
full rationale
The paper presents no equations, derivations, or fitted parameters that reduce to prior results by construction. It introduces a newly constructed Perceptually Perturbed Judgment Dataset and a GRPO-based training framework, then reports benchmark improvements from experiments. No self-citation chains, ansatzes smuggled via citation, or renaming of known results appear in the provided text. The central claims are supported by the dataset construction and external benchmark comparisons rather than internal self-definition or statistical forcing, making the derivation self-contained against external evaluation.
Axiom & Free-Parameter Ledger
Reference graph
Works this paper leans on
-
[1]
Unlike prior studies that primarily enhance perceptual grounding within the reasoning process, our work focuses on elevating perception itself in the context of multimodal judgment
proposes perception tokens, which embed intrinsic image features as reasoning tokens to enhance visual reason- ing. Unlike prior studies that primarily enhance perceptual grounding within the reasoning process, our work focuses on elevating perception itself in the context of multimodal judgment. C. Experimental Details We provide additional experimental ...
-
[2]
is_correct
for reinforcement learning with verifiable rewards. The code is available at the GitHub repository ( https:// github.com/kaist-cvml/perception-judge). C.2. Implementation Details & Hyperparameters Perception-Judge is initialized from two models: Flex-Judge- VL and Qwen3-VL-Thinking. Both models are optimized using Group Relative Policy Optimization (GRPO)...
2024
-
[3]
6 objects
to extract a small set of perceptual attributes that are both visually grounded, relevant to the instruction, and not explicitly stated in the text instruction itself, ensuring that they reflect information genuinely observed in the image. Concretely, we prompt the model to list at most six atomic attributes such as object counts, shapes, colors, spatial ...
-
[4]
Type 1: Keep the logical structure of the CHOSEN answer, but slightly alter perception- related details (as PERCEPTION_ATTRS) so they contradict the image
-
[5]
rejected_1
Type 2: Alter perception-related details AND introduce logical errors in the reasoning process. Each perturbation MUST: - Follow CHOSEN's exact format - Include the complete reasoning with modified - details - Result in a DIFFERENT final answer than - ANSWER_GT Output ONLY this JSON (no markdown, no extra text): {{ "rejected_1": "<full perturbed text for ...
-
[6]
For Qwen3-VL-8B-Thinking, we employ full fine-tuning to update all parameters, allow- ing for more comprehensive adaptation of its reasoning ca- pabilities
based fine-tuning to Qwen2.5-VL-32B-Instruct, we train an additional LoRA adapter of rank 32 while keep- ing the original Flex Judge LoRA modules fixed, yielding Perception-Judge-Flex-32B. For Qwen3-VL-8B-Thinking, we employ full fine-tuning to update all parameters, allow- ing for more comprehensive adaptation of its reasoning ca- pabilities. Although ou...
2022
-
[7]
Human Score: 5 / 5 Qwen3-4B-Thinking So, let’s check the assistant’s answer
So the answer is 21.1 billion US dollars. Human Score: 5 / 5 Qwen3-4B-Thinking So, let’s check the assistant’s answer. The question asks for the retail sales value in 2010. The chart is a bar graph with years on the x-axis and retail sales value in million USD on the y-axis. The 2010 bar has a value of 21.1. Wait, the y-axis labels say ¨Retail sales value...
2010
-
[8]
**Relevance and Accuracy**: The image does not contain any informa- tion about the fuel efficiency of a city bus, which is the core requirement of the question. Therefore, the answer provided by Assistant is accurate in the sense that the image does not provide the necessary data, but it might be more accurate to state that the image does not provide the ...
-
[9]
**Relevance**: The image does show a city street with various vehicles, which might be relevant to the context of the question, but it does not provide the specific data needed to answer the question about the bus’s fuel efficiency
-
[10]
**Accuracy**: The statement that the image does not provide the necessary information is accurate, but it might be more accurate to specify that the image does not provide the specific value (miles per gallon) asked for in the question. Given the lack of specific data in the image, the most accurate and relevant answer would be to state that the image doe...
-
[11]
The image shows a typical urban street scene with various vehicles, but it does not include any information relevant to the question asked
**Relevance and Accuracy**: The answer is accurate in its assess- ment that the image does not provide any specific data about the fuel efficiency of city buses. The image shows a typical urban street scene with various vehicles, but it does not include any information relevant to the question asked. This is a relevant observation because the question spe...
-
[12]
**Accuracy in Context**: The answer correctly pointed out that the image does not include any data on bus fuel efficiency, which is a relevant detail. It also correctly noted that the image includes a variety of vehicles, such as cars and a bicycle, which might be relevant to a broader discussion on urban transportation, but these do not pertain to the sp...
-
[13]
The question specifically asked for the miles per gallon of an average city bus, and the image did not provide any such data
**Relevance to Question**: The relevance of the answer to the question asked is clear. The question specifically asked for the miles per gallon of an average city bus, and the image did not provide any such data. Therefore, the answer is accurate in stating that the image does not provide the necessary information to answer the question. Given these consi...
-
[14]
According to the table, Canada had 8 Nobel Prize winners in the 1990s, and Italy had 1
**Relevance and Accuracy**: The answer correctly identifies the number of Nobel Prize winners in the 1990s for both Canada and Italy. According to the table, Canada had 8 Nobel Prize winners in the 1990s, and Italy had 1. The difference between these numbers is indeed 8 - 1 = 7, which means Canada had 7 more Nobel Prize winners than Italy in the 1990s. Th...
-
[15]
The difference between the number of Nobel Prize winners in the 1990s for Canada (8) and Italy (1) is 8 - 1 =
**Calculation**: The calculation provided by Assistant is correct. The difference between the number of Nobel Prize winners in the 1990s for Canada (8) and Italy (1) is 8 - 1 =
-
[16]
This means Canada had 7 more Nobel Prize winners than Italy in the 1990s, which aligns with the data in the table
-
[17]
In the 1990s, Canada had 7 Nobel Prize winners, while Italy had 3. Therefore, Canada had 4 more Nobel Prize winners than Italy in the 1990s
**Clarity and Precision**: The answer is clear and precise in its statement, "In the 1990s, Canada had 7 Nobel Prize winners, while Italy had 3. Therefore, Canada had 4 more Nobel Prize winners than Italy in the 1990s." This statement is accurate and directly answers the question asked, which is to find the difference in the number of Nobel Prize winners ...
-
[18]
Therefore, Canada had 4 more Nobel Prize winners than Italy in the 1990sïs incorrect
**Incorrect Calculation**: The statement Ïn the 1990s, Canada had 7 Nobel Prize winners, while Italy had 3. Therefore, Canada had 4 more Nobel Prize winners than Italy in the 1990sïs incorrect. According to the table, in the 1990s, Canada actually had 8 Nobel Prize winners, while Italy had 1. The correct difference would be 8 (Canada) - 1 (Italy) = 7, not 4
-
[19]
Therefore, the correct answer should be that Canada had 7 more Nobel Prize winners than Italy in the 1990s
**Misinterpretation of the Data**: The table shows that in the 1990s, Canada had 8 Nobel Prize winners, which is more than the 1 that Italy had. Therefore, the correct answer should be that Canada had 7 more Nobel Prize winners than Italy in the 1990s. To correct the answer, the cor- rect statement would be: Ïn the 1990s, Canada had 8 Nobel Prize winners,...
-
[20]
Is Web Green greater than Yellow?
**Relevance and Accuracy**: The answer correctly identifies that the Yellow line is above the Web Green line throughout the entire range of the x-axis. This means that for any given value of x, the value of Yellow is greater than the value of Web Green. This is a direct interpretation of the graph, which is a relevant and accurate way to answer the questi...
-
[21]
This level of detail is accurate and relevant to the question, which asks whether Web Green is greater than Yellow
**Level of Detail**: The answer is precise in its conclusion, specifying that the Yellow line is above the Web Green line for all values of x. This level of detail is accurate and relevant to the question, which asks whether Web Green is greater than Yellow. By stating that this is true for all x-values, the answer is comprehensive and accurate
-
[22]
It correctly identifies the relative positions of the lines on the graph, which is a clear and accurate way to determine the relationship between Web Green and Yellow
**Logical Reasoning**: The rea- soning is logical and straightforward. It correctly identifies the relative positions of the lines on the graph, which is a clear and accurate way to determine the relationship between Web Green and Yellow. In contrast, if the answer had been inaccurate, it might have suggested that Web Green is greater than Yellow at some ...
-
[23]
This misinterpretation might lead to a misunderstanding of the relationship between the two lines
**Accuracy and Relevance**: The accuracy of the answer can be questioned because the yellow line is indeed below the Web Green line for a significant portion of the x-axis range, not above it. This misinterpretation might lead to a misunderstanding of the relationship between the two lines
-
[24]
From the figure, it is clear that the Web Green line (green dots) is consistently above the Yellow line (yellow dots) for the entire x-axis range
**Correct Approach**: To determine whether Web Green is greater than Yellow, we need to com- pare the y-values of these two lines at each corresponding x-value. From the figure, it is clear that the Web Green line (green dots) is consistently above the Yellow line (yellow dots) for the entire x-axis range. This means Web Green is greater than Yellow for a...
-
[25]
The correct interpretation should be that Web Green is always above the Yellow line, which would mean Web Green is greater than Yellow
**Misinterpretation**: The statement ¨the yellow line is above the web green line for all values of x-axisïs incorrect. The correct interpretation should be that Web Green is always above the Yellow line, which would mean Web Green is greater than Yellow
-
[26]
Therefore, the correct answer should be that Web Green is greater than Yellow, not the other way around
**Conclusion**: Based on the correct interpretation of the figure, Web Green is indeed greater than Yellow for all values of x. Therefore, the correct answer should be that Web Green is greater than Yellow, not the other way around. </think> Score: 1 Figure S14.Additional qualitative example of score setting. 27 Mitigating Perceptual Judgment Bias in Mult...
-
[27]
This means the plate is being held hori- zontally, which is a 90-degree angle to the vertical plane of the man’s body
**Orientation of the Plate**: The plate is being held in a way that the horizontal line of the plate is parallel to the bottom edge of the table. This means the plate is being held hori- zontally, which is a 90-degree angle to the vertical plane of the man’s body
-
[28]
This is a key detail that confirms the angle is 90 degrees, as the plate is being held in a way that its vertical edge is at a right angle to the man’s body
**Perpendicularity**: The vertical line of the plate is perpendicular to the man’s body. This is a key detail that confirms the angle is 90 degrees, as the plate is being held in a way that its vertical edge is at a right angle to the man’s body
-
[29]
**Visual Confirmation**: The image shows the plate being held in a way that aligns with these descriptions. The man’s hand is positioned such that the plate is horizontal, and the vertical edge of the plate is aligned with the vertical line of his body, which is consistent with a 90-degree angle. Given these observations, the analysis provided by Assistan...
-
[30]
This is a correct observation
**Angle Determination**: The man is holding the plate in such a way that the plate is perpendicular to the table, which means the angle between the plate and the table is 90 degrees. This is a correct observation
-
[31]
This is a clear and accurate way to describe the orientation of the plate, which is indeed a 90-degree angle
**Observation of Lines**: The description mentions that the hor- izontal line of the plate is parallel to the bottom edge of the table, and the vertical line of the plate is perpendicular to the man’s body. This is a clear and accurate way to describe the orientation of the plate, which is indeed a 90-degree angle
-
[32]
This is a reasonable interpretation based on the visual evidence in the image
**Contextual Accuracy**: The analysis is accurate in the context of the image, where the plate is being held in a way that it forms a right angle with the table. This is a reasonable interpretation based on the visual evidence in the image. Given these accurate observations, the answer provided by Assistant is quite accurate and relevant to the question a...
discussion (0)
Sign in with ORCID, Apple, or X to comment. Anyone can read and Pith papers without signing in.