REVIEW 4 major objections 6 minor 17 references
Cancer cytoplasm segmentation in hyperspectral cell image with data augmentation
T0 review · 4 major / 6 minor · reviewed 2026-08-06 · deepseek-v4-flash
Pith's one-line read Cancer cytoplasm can be segmented from noisy hyperspectral images by training the U-Net segmentation model on CMOS-derived pseudo-noisy augmentations, lifting IoU from 0.7255 to 0.7362 and Dice from 0.8392 to 0.8466.
desk verdict A useful augmentation idea and new dataset, but the main result is undercut by a class-label mismatch and test-set-informed parameter choice. read the letter →
The pith
A machine-rendered reading of the paper's core claim, the machinery that carries it, and where it could break.
The reading
What carries the argument
The carrying mechanism is a parameterized line-noise injection model paired with the U-Net segmentation architecture. Vertical noise lines count 19 to 29 (plus or minus 5) with pixel value 128; horizontal noise lines are placed in rows 26 to 32 (plus or minus 3), with information loss up to 2 pixels and left or right shifts up to 3 pixels; the source image is the converted and brightened CMOS frame with gamma 0.3 and constant 100. These parameters are meant to emulate the slit- and sensor-derived stripes of a push-broom hyperspectral camera, and the ablation isolates the injected noise as the decisive augmentation.
What would settle it
Compare the distribution of line artifacts in the generated pseudo-noisy images with the real hyperspectral test images, including line count, width, spacing, pixel intensity, and shift statistics; if the synthetic noise does not match the real noise, or if a model trained on pseudo-noisy images fails to improve on images from a different push-broom camera, the transfer claim collapses.
Extended reading notes
Core claim
On the paper's own terms, the central discovery is that a small stack of 44 original noisy hyperspectral images can be stretched into 836 training images by converting CMOS RGB images to grayscale, adjusting brightness with gamma correction and histogram equalization, overlaying a constant value, and then randomly adding vertical and horizontal line noise plus geometric transforms; U-Net trained on this mix segments cancer cytoplasm better than U-Net trained on the originals alone. The ablation studies attribute the gain specifically to the noise injection: pseudo-noisy images outperform color-adjusted images without noise and outperform most geometric augmentations, and combining all five general augmentations with noise gives the best score. The paper also asserts this is the first deep-learning application to segment cancer cytoplasm from hyperspectral pathology images.
Load-bearing premise
The synthetic line-noise model faithfully mimics the real instrumental noise of the hyperspectral camera, so that training on pseudo-noisy CMOS-derived images transfers to real test images.
Editorial extensions
If this is right
- A model trained on 44 original plus 792 pseudo-noisy images outperforms one trained on 44 originals, so small noisy hyperspectral datasets can be amplified without acquiring new real images.
- The ablation attributes most of the gain to noise injection rather than geometric transforms, so explicit modeling of instrumental noise is the load-bearing part of the augmentation.
- CMOS images, which are visually clearer and faster to annotate, can serve as annotation proxies for hyperspectral training data.
- The same noise-injection augmentation may transfer to other tasks on push-broom hyperspectral images, such as object detection, as the paper suggests.
- The remaining weakness on darker image types implies that adding more dark pseudo-images could further improve the method, a direction the paper itself raises.
Reading between the lines
- Beyond the paper, the noise model's parameters were tuned to one camera and one dataset; transferring to another push-broom hyperspectral camera would likely require re-estimating the line statistics or learning the noise distribution from unlabeled real images.
- Since the experiments use only a single spectral band, a testable extension is to feed the full spectral cube into the network; the paper does not test whether multiband input would amplify the augmentation gain.
- The pseudo-noisy images are all derived from 44 CMOS images, so a held-out CMOS-derived test set would reveal whether the gain is genuine generalization or overfitting to those source patterns; this experiment is not in the paper.
Editorial analysis
A structured set of objections, weighed in public.
Referee Report
Summary. The paper proposes a data augmentation strategy for segmenting cancer cytoplasm in hyperspectral H&E images. The method converts CMOS RGB images to grayscale, applies gamma correction and histogram equalization, adds a uniform color offset, injects synthetic vertical and horizontal line noise meant to mimic hyperspectral camera artifacts, and then applies geometric augmentations. A U-Net is trained on 44 original hyperspectral images plus 792 pseudo-noisy images and evaluated on 56 held-out hyperspectral images. The main quantitative result is an IoU improvement from 0.7255 to 0.7362 and Dice from 0.8392 to 0.8466, with additional ablation experiments on the number of augmented images and the effect of individual augmentation techniques.
Significance. If the result holds, the paper makes a useful practical contribution by addressing the scarcity of annotated hyperspectral pathology images and by showing that a simple, GAN-free augmentation pipeline can simulate instrumental noise. The authors are transparent about their imaging setup, parameters, and limitations, and they provide multiple ablation tables. However, the central comparison is currently undermined by an unresolved label-class mismatch, the absence of statistical grounding, and test-set-informed selection of noise parameters, so the claimed improvement cannot yet be attributed specifically to the proposed noise augmentation.
major comments (4)
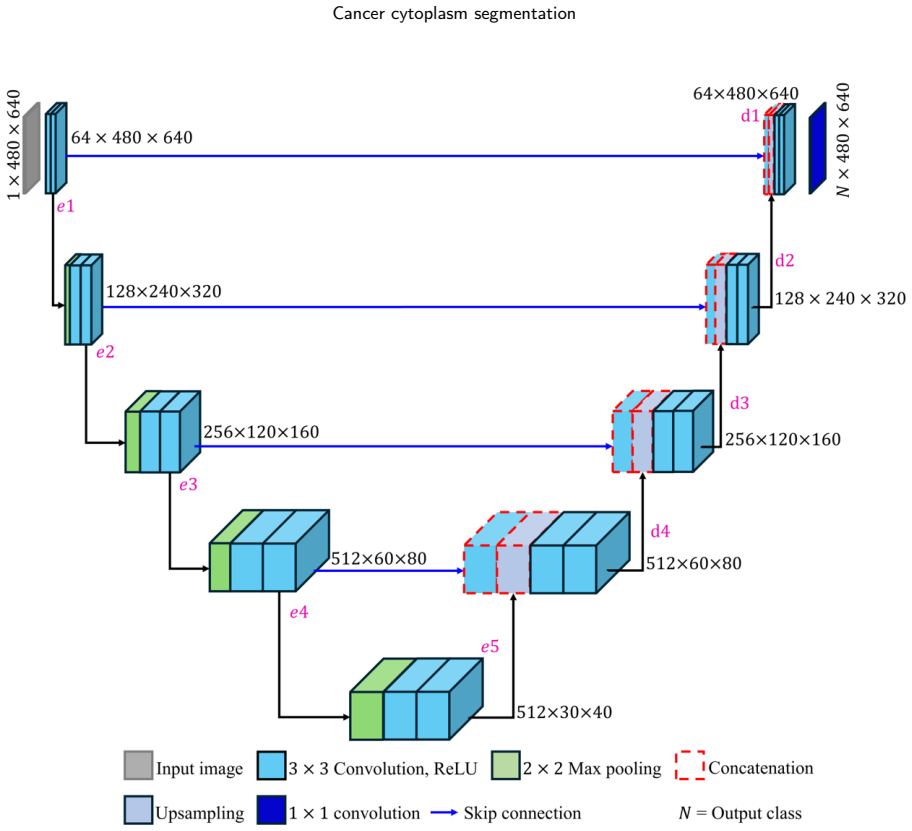
- [§3.3 and §4.2] The U-Net output layer has five classes and cross-entropy loss is used 'because of the five segmentation classes,' but the hyperspectral ground truth is annotated only for cancer cytoplasm, nuclear regions, and empty areas, while the CMOS-derived pseudo-images have five classes including red blood cells and fibroblasts. The paper never explains how the three-class hyperspectral labels are encoded for a five-class softmax. If the three-class labels are expanded in some way, or if the extra classes are simply ignored, the training objective differs between the original and pseudo images. This makes the Table 3 gain (0.7255 to 0.7362 IoU) uninterpretable, because it could reflect the additional RBC/fibroblast supervision from the 792 CMOS-derived images rather than the proposed noise augmentation.
- [§4.5 and Table 3] The headline improvement is based on a single training run per method, with no error bars, no repeated seeds, and no significance testing. The reported IoU difference is only 0.0107, while Table 5 shows that the noise-specific effect is about 0.005 (0.6535 vs. 0.6485), so run-to-run variation could easily account for the headline result. The authors should report mean and standard deviation over at least three to five seeds and, ideally, a paired statistical test across seeds.
- [§4.1 and §4.3] The noise-model parameters (N1=19 to N2=29, C2=128, r1=26 to r2=32, etc.) are selected using statistics computed from all 100 hyperspectral images, specifically the counts of vertical and horizontal noise lines described in §4.1. Since 56 of those images are used as the test set, the augmentation parameters are informed by test-set statistics. This is a form of test-set leakage that biases the evaluation; the noise parameters should be derived only from the 44 training images or from a separate validation subset, then frozen before evaluating on the test set.
- [§4.5 and Table 4] The comparison in Table 3 confounds augmentation type with training-set size: Method 1 uses 44 images while the proposed method uses 836 images. Table 4 shows that increasing the number of pseudo-images from 44 to 792 (Methods 1–3) raises IoU from 0.6535 to 0.7059 even without any original hyperspectral images, so the additional 0.0303 gain in Method 4 may come from the inclusion of the original images rather than from the noise-augmentation mechanism. A controlled comparison with equal training-set size (e.g., 836 images with noise vs. 836 images without noise) is needed to isolate the effect of the proposed augmentation.
minor comments (6)
- [Abstract and §1] The novelty claim of being 'the first application of deep learning for segmenting cancer cytoplasm from hyperspectral pathology images' is strong and should be supported by a more systematic comparison with the cited literature, since works such as Cx22 already address cancer cytoplasm annotation, albeit not in hyperspectral images.
- [§3.2 and Fig. 2] The pipeline description is clear at a high level, but the relationship between the 'three pseudo-noisy images are generated' statement and the later creation of 792 pseudo-images is not explained; a short formula or pseudocode would remove the ambiguity.
- [§4.3 and Table 2] There is a typo in the table heading: 'Trianing parameter' should be 'Training parameter'. Additionally, the table would be easier to read if the loss function were described in a separate row from the environment.
- [Equations in §4.4] The IoU and Dice formulas are presented inline and are visually incomplete; they should be typeset as numbered display equations.
- [Table 5] The checkmark columns in Table 5 are hard to interpret; it is not immediately clear which augmentation techniques are applied in each row, and the text refers to 'Method 2' in a way that is ambiguous with the method numbering in Table 4.
- [§4.1] The sentence describing '81 images for one H&E-stained sample across different wavelength bands' is confusing because the paper later treats images as independent samples; clarify whether these are spectral bands of a single scene or separate physical images.
Circularity Check
No significant circularity: the segmentation gain is measured on held-out hyperspectral images; augmentation hyperparameters are inputs, not fitted predictions.
full rationale
The paper's central claim is empirical: training U-Net on 44 original hyperspectral images plus 792 pseudo-noisy CMOS-derived images gives IoU 0.7362 and Dice 0.8466, versus 0.7255 and 0.8392 for original-only training (Table 3). The evaluation is performed on 56 held-out original hyperspectral images from seven types, and the pseudo-images are generated from a separate set of 44 CMOS images. No load-bearing step is derived from the claimed outcome. The augmentation parameters in Sec 4.3 (C2=128, N1=19 to N2=29, r1=26 to r2=32, m=2, d=3) are input hyperparameters, not outputs fitted to the segmentation metric. There are no self-citations or imported uniqueness theorems. Two methodological caveats are worth noting but are not circularity. First, the synthetic noise statistics in Sec 4.1 were summarized from all 100 hyperspectral images, including the 56 test images, so the augmentation is calibrated to the evaluation distribution; this is experimental leakage, not a definitional reduction. Second, Sec 3.3 specifies five output classes while Sec 4.2 states hyperspectral ground truth has only three classes, and the paper does not reconcile this mismatch; this affects interpretability of the IoU gain but does not make the result equivalent to its inputs. Accordingly, no circular step can be exhibited and the circularity score is 0.
Assumptions & free parameters
free parameters (13)
- gamma correction gamma =
0.3
- added color constant C1 =
100
- noise line pixel value C2 =
128
- vertical line count range N1-N2 =
19-29
- vertical line variability sigma1 =
5
- horizontal line region r1-r2 =
26-32
- horizontal line variability sigma2 =
3
- slice height range h1-h2 =
15-30
- max pixel loss m =
2
- max pixel shift d =
3
- crop width c_w =
800
- crop height c_s (also c_h) =
700
- spectral band 580 nm =
580 nm
assumptions (5)
- domain assumption Line push-broom hyperspectral cameras produce instrumental noise that can be represented as additive vertical and horizontal lines of constant pixel intensity.
- domain assumption The 580 nm band is sufficient for cancer cytoplasm segmentation, so single-band grayscale images (real and pseudo) are used instead of the full hyperspectral cube.
- domain assumption Noise statistics measured over all 100 hyperspectral images (including test images) are representative of the noise in the test set and can be used to set augmentation parameters.
- domain assumption Manual annotations by veterinary researchers, validated by a professor, are accurate enough to serve as ground truth for training and evaluation.
- standard math U-Net with 5 output classes and cross-entropy loss is an appropriate segmentation model for this task.
Cite this review
Pith. "Pith review of Cancer cytoplasm segmentation in hyperspectral cell image with data augmentation." pith.science (2026). https://pith.science/paper/PK42YEKU
@misc{pith2026250703325,
  author       = {Pith},
  title        = {Pith review of: Cancer cytoplasm segmentation in hyperspectral cell image with data augmentation},
  year         = {2026},
  howpublished = {\url{https://pith.science/paper/PK42YEKU}},
  note         = {Machine review of arXiv:2507.03325}
}
read the original abstract
Hematoxylin and Eosin (H&E)-stained images are commonly used to detect nuclear or cancerous regions in cells from images captured by a microscope. Identifying cancer cytoplasm is crucial for determining the type of cancer; hence, obtaining accurate cancer cytoplasm regions in cell images is important. While CMOS images often lack detailed information necessary for diagnosis, hyperspectral images provide more comprehensive cell information. Using a deep learning model, we propose a method for detecting cancer cell cytoplasm in hyperspectral images. Deep learning models require large datasets for learning; however, capturing a large number of hyperspectral images is difficult. Additionally, hyperspectral images frequently contain instrumental noise, depending on the characteristics of the imaging devices. We propose a data augmentation method to account for instrumental noise. CMOS images were used for data augmentation owing to their visual clarity, which facilitates manual annotation compared to original hyperspectral images. Experimental results demonstrate the effectiveness of the proposed data augmentation method both quantitatively and qualitatively.
Figures


Figures from the paper (6 more)


Reference graph
Works this paper leans on
-
[3]
Artificial Intelligence Review 56, 12561–12605
Medical image data augmentation: techniques, com- parisons and interpretations. Artificial Intelligence Review 56, 12561–12605. Graham,S.,C.H.G.J.D.Q.H.P.A.S.D.T.Y.W.R.N.,2019. Mild-net:Minimal information loss dilated network for gland instance segmentation in colon histology images. Medical Image Analysis 52, 199–211. Graham, S., J.M.A.A.N.M.T.Y.W.D.K.H...
work page 2019
-
[4]
Amulti-organnucleussegmenta- tion challenge
Kumar,N.,V.R.A.D.Z.Y.O.O.e.a.,2020. Amulti-organnucleussegmenta- tion challenge. IEEE Transactions on Medical Imaging 39, 1380–1391. Kumar, N., V.R.S.S.B.S.V.A.S.A.,
work page 2020
-
[5]
Training a universal instance segmentation networkforlivecellimagesofvariouscelltypesandimagingmodalities. arXiv preprint arXiv:2207.14347 . Hatamizadeh, A., N.V.T.Y.Y.D.R.H.X.D.,
-
[6]
Comprehensive ai model develop- ment for gleason grading: From scanning, cloud-based annotation to pathologist-ai interaction . Infrared, . Near infrared hyperspectral image dataset, last access january 27, 2025 from https://www.kaggle.com/datasets/hacarus/near-infrared- hyperspectral-image?resource=download . Janowczyk, A., M.A.,
work page 2025
-
[10]
Computers in Biology and Medicine 132, 104349
Cryonuseg: A dataset for nuclei instance segmentation of cryosectioned h&e-stained histological images. Computers in Biology and Medicine 132, 104349. Moshkov,N.,M.B.K.F.A.H.R.H.P.,2020. Test-timeaugmentationfordeep learning-based cell segmentation on microscopy images. Scientific reports 10,
work page 2020
-
[11]
arXiv preprint arXiv:1712.04621
The effectiveness of data augmentation in image classification using deep learning. arXiv preprint arXiv:1712.04621 . Ramin, N., P.F.,
-
[12]
Perineural Invasion Detection in Multiple Organ Cancer Based on Deep Convolutional Neural Network
Perineural invasion detection in multiple organ cancer based on deep convolutional neural network. arXiv preprint arXiv:2110.12283 . Ronneberger, O., F.P.B.T.,
-
[13]
arXiv preprint arXiv:2206.11943
Tiager: Tumor- infiltrating lymphocyte scoring in breast cancer for the tiger challenge. arXiv preprint arXiv:2206.11943 . Siddique, N., P.S.E.C.D.V.,
Show all 17 references
-
[14]
IEEE Access 9, 82031–82057
U-net and its variants for medical image segmentation: A review of theory and applications. IEEE Access 9, 82031–82057. Simon,G.,V.Q.R.S.A.A.T.Y.K.J.R.N.,2019. Hover-net:Simultaneousseg- mentation and classification of nuclei in multi-tissue histology images. Medical image ana...
2019
-
[17]
Biomedical Optics Express 15, 4584–4604
Taj-net: a two-stage clustered cell segmentation network with adaptive joint learning of spatial and spectral information. Biomedical Optics Express 15, 4584–4604. Zhao,A.,B.G.D.F.G.J.D.A.,2019. Dataaugmentationusinglearnedtrans- formationsforone-shotmedicalimagesegmentation. ...
2019
-
[2016]
IEEE Reviews in Biomedical Engineering 9, 234–263
Robust nucleus/cell detection and segmentation in digital pathology and microscopy images: A comprehensive review. IEEE Reviews in Biomedical Engineering 9, 234–263. Xu,J.,L.M.Z.Z.,2020. Automaticdataaugmentationfor3dmedicalimage segmentation. International Conference on Medic...
2020
-
[2017]
IEEE Transactions on Medical Imaging 36, 1550–1560
A dataset and a technique for generalized nuclear segmentation for computational pathology. IEEE Transactions on Medical Imaging 36, 1550–1560. labelme, . wkentaro/labelme, last access june 6, 2024 from https://github.com/wkentaro/labelme . Lai, Q., W.W.S.H.S.J.,
2024
-
[2020]
arXiv preprint arXiv:2003.10778
Pannuke dataset extension, insights and baselines. arXiv preprint arXiv:2003.10778 . Garcea,F.,S.A.L.F.M.L.,2023. Dataaugmentationformedicalimaging:A systematic literature review. Computers in Biology and Medicine 152, 106391. Gelasca,E.D.,B.J.O.B.M.B.,2008. Evaluationandbench...
2003 arXiv
-
[2021]
Medical Image Analysis
Paip 2019: Liver cancer segmentation challenge. Medical Image Analysis
2019
- [2022]
-
[2023]
arXiv preprint arXiv:2303.01178
Augmenting medical imaging: A comprehensive cat- alogue of 65 techniques for enhanced data analysis. arXiv preprint arXiv:2303.01178 . Eaton-Rosen, Z., B.F.O.S.C.M.J.,
-
[2024]
Computerized Medical Imaging and Graphics 112, 102339
Crossu-net: Dual- modality cross-attention u-net for segmentation of precancerous lesions in gastric cancer. Computerized Medical Imaging and Graphics 112, 102339. Wilm,F.,F.M.B.C.A.S.N.O.M.Q.J.,2023. Multi-scannercaninecutaneous squamous cell carcinoma histopathology dataset....
2023
Reviewed August 6, 2026 · model on record in the stance chip above.
Discussion (0). Continue with ORCID to comment.