AI Rater Discrimination Depends on Scoring Protocol in Complex Clinical Decision-Making
Pith reviewed 2026-06-28 10:45 UTC · model grok-4.3
The pith
Rubric-anchored scoring lets AI raters discriminate between clinical decision outputs while rubric-free scoring collapses them into uniformly high marks.
A machine-rendered reading of the paper's core claim, the machinery that carries it, and where it could break.
Core claim
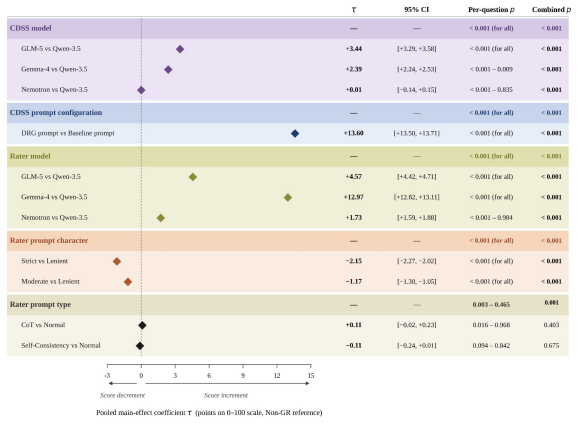
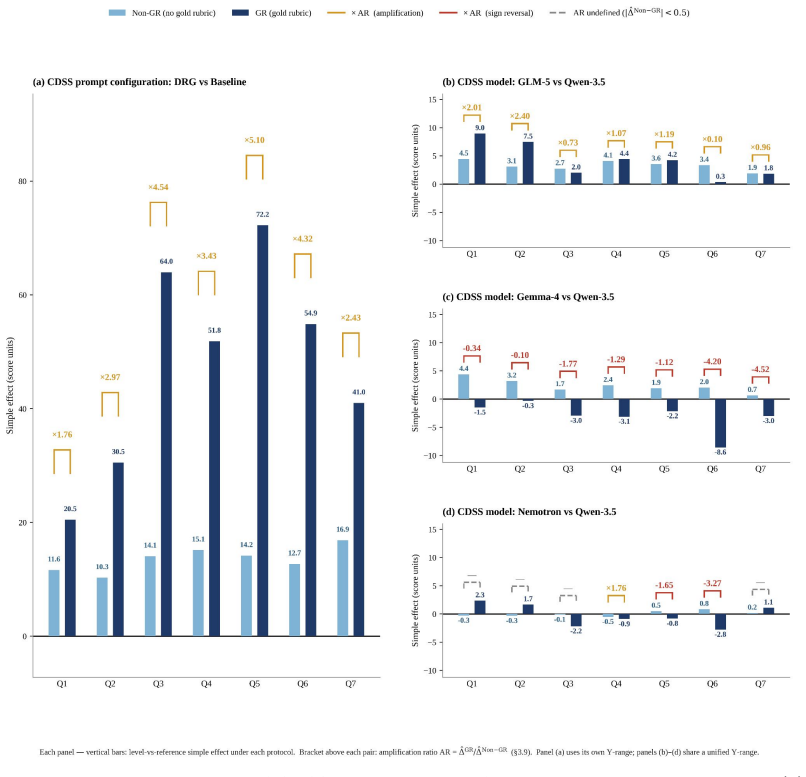
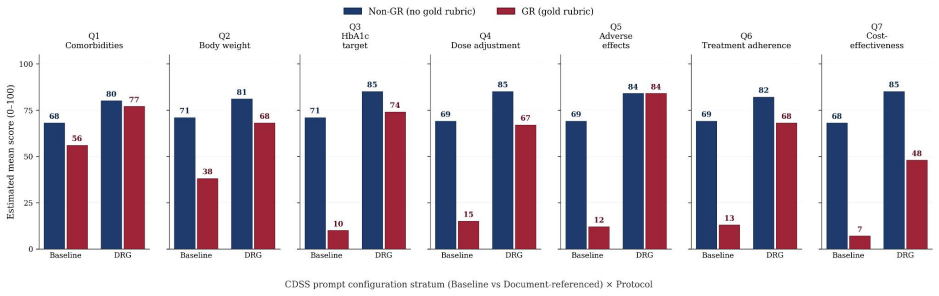
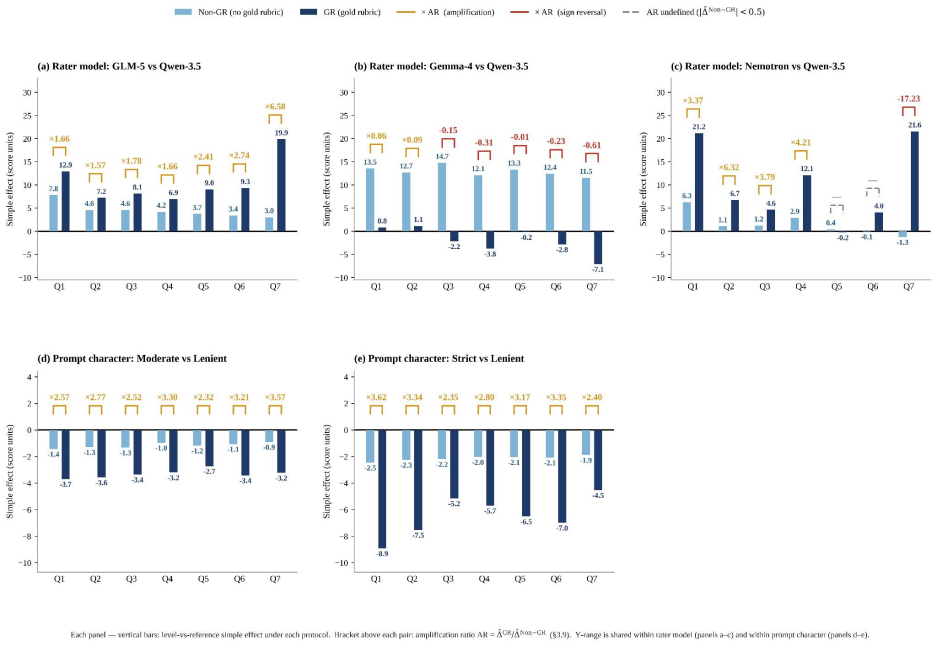
Across all seven questions, AI raters assigned scores under the Gold Rubric protocol that were 7.69 to 49.64 points lower and 1.68 to 3.67 times wider in interquartile range than under the Non-Gold-Rubric protocol; within each question the anchored protocol increased discrimination between document-referenced generation and baseline outputs by factors of 1.76 to 5.10 while also exposing substantial variation across rater models that the unanchored protocol suppressed.
What carries the argument
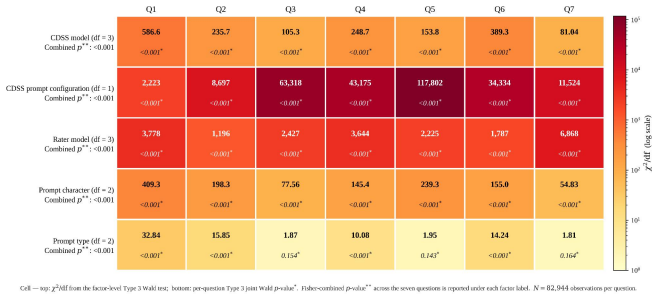
The factorial comparison of Gold Rubric (patient-specific rubric supplied) versus Non-Gold-Rubric (no rubric supplied) scoring protocols, analyzed via linear mixed effects models that cross the protocol factor with CDSS model, prompt configuration, rater model, and prompt variables.
If this is right
- Gold Rubric scoring produces consistently lower and more variable scores than Non-Gold-Rubric scoring across all tested questions.
- Gold Rubric scoring amplifies separation between document-referenced and baseline CDSS outputs by 1.76 to 5.10 times.
- Gold Rubric scoring reveals behavioral differences among rater models that Non-Gold-Rubric scoring suppresses.
- Rubric-free scoring cannot serve as a substitute when criteria depend on patient- or jurisdiction-specific information.
- The pattern holds when the same LLMs act simultaneously as both clinical decision support systems and raters.
Where Pith is reading between the lines
- Evaluation pipelines for other clinical domains that rely on jurisdiction-specific guidelines will likely need anchored rubrics rather than relying on rater model knowledge.
- Creating reusable patient-specific rubric templates could reduce the cost of maintaining discriminative power when scaling AI rater use.
- Future work could test whether hybrid protocols that supply partial rubrics recover some but not all of the discrimination lost in fully rubric-free scoring.
Load-bearing premise
The seven evaluation questions require patient-specific or jurisdiction-specific criteria that the rater models cannot recover from their parametric knowledge alone.
What would settle it
A new set of clinical questions whose criteria can be answered from general medical knowledge alone, scored under both protocols, would falsify the claim if the Non-Gold-Rubric protocol produced discrimination equal to or greater than the Gold Rubric protocol.
Figures


read the original abstract
Clinical AI evaluation increasingly delegates scoring to large language models (LLMs) acting as AI raters, yet their scoring behavior across evaluation conditions has not been quantitatively characterized. We address this gap through a factorial study of AI rater behavior in adult type 2 diabetes (T2D) pharmacotherapy at 12-month outpatient follow-up, a clinical task involving complex decision-making operationalized across seven evaluation questions. Four open-source LLMs served simultaneously as clinical decision support system (CDSS) models and AI raters. Each CDSS output was scored under two scoring protocols: a rubric-anchored Gold Rubric (GR) protocol incorporating a patient-specific rubric, and a rubric-free Non Gold Rubric (Non-GR) protocol. Linear mixed effects models crossed the scoring protocol factor with five design factors -- CDSS model, CDSS prompt configuration (document-referenced generation [DRG] vs.\ Baseline), rater model, prompt character, and prompt type -- and estimated main effects together with their protocol interactions. Across all questions, AI raters yielded consistently higher scores within a very narrow range (74--78 points on average) under Non-GR compared to those under GR (7.69 to 49.64 points lower mean scores; 1.68 to 3.67 times wider interquartile ranges). Within each question, GR amplified the AI rater's discrimination between DRG and Baseline CDSS outputs by factors of 1.76 to 5.10, while also revealing substantial behavioral variation across rater models that Non-GR suppressed. These findings support rubric anchoring as the scoring protocol that preserves discriminative power in clinical AI evaluation; rubric-free scoring cannot substitute when questions require patient-specific or jurisdiction-specific criteria that rater models cannot infer from parametric knowledge alone.
Editorial analysis
A structured set of objections, weighed in public.
Referee Report
Summary. The paper reports a factorial empirical study of four open-source LLMs used simultaneously as CDSS generators and AI raters on a type-2-diabetes pharmacotherapy task. Each CDSS output is scored under a Gold-Rubric (GR) protocol that supplies an explicit patient-specific rubric versus a rubric-free Non-GR protocol. Linear mixed-effects models crossing scoring protocol with CDSS model, prompt configuration (DRG vs. Baseline), rater model, and other factors show that Non-GR produces higher mean scores (74–78) in a narrow range while GR lowers means by 7.69–49.64 points, widens interquartile ranges 1.68–3.67×, and amplifies discrimination between DRG and Baseline outputs by factors of 1.76–5.10. The authors conclude that rubric anchoring is required to preserve discriminative power when evaluation questions involve patient- or jurisdiction-specific criteria that rater models cannot recover from parametric knowledge alone.
Significance. If the reported protocol-by-prompt interactions replicate, the work supplies concrete quantitative evidence that rubric-free LLM scoring can compress variance and mask differences that rubric-anchored scoring reveals, with direct consequences for how clinical AI systems are benchmarked. The use of the same LLMs in both generation and rating roles and the crossing of five design factors are strengths that allow isolation of protocol effects.
major comments (3)
- [Abstract] Abstract (final sentence) and study design: the claim that score compression under Non-GR arises because 'rater models cannot infer from parametric knowledge alone' the patient- or jurisdiction-specific criteria is inferred from the GR vs. Non-GR contrast rather than directly tested. No control condition (e.g., a knowledge-probe prompt asking the same four LLMs to generate or apply the exact rubric criteria independently of the scoring task) is described, leaving open alternative explanations such as prompt-length effects, scale-anchoring differences, or general leniency in open-ended scoring.
- [Abstract] Abstract and Methods (implied): effect sizes, amplification factors (1.76–5.10), and interaction terms are stated without accompanying raw data, model versions, exact rubric text, full statistical output tables, or code, so the reported numbers cannot be verified or sensitivity-checked.
- [Methods] Linear mixed-effects analysis: the models include protocol interactions with CDSS prompt configuration and rater model but, per the skeptic note, omit any knowledge-probe factor that would isolate the parametric-knowledge assumption; this omission makes the causal attribution to 'inability to infer patient-specific criteria' load-bearing yet untested.
minor comments (2)
- The seven evaluation questions are referenced but never listed or characterized with respect to which criteria are patient- versus jurisdiction-specific; adding an explicit table would clarify the scope of the claim.
- Notation for the two prompt configurations (DRG vs. Baseline) and the five crossed factors should be defined once in a table or equation for readability.
Simulated Author's Rebuttal
We thank the referee for the constructive comments on our manuscript. We address each major comment point-by-point below, acknowledging where the design leaves certain interpretations inferential rather than directly tested. We propose targeted revisions to clarify claims and improve reproducibility.
read point-by-point responses
-
Referee: [Abstract] Abstract (final sentence) and study design: the claim that score compression under Non-GR arises because 'rater models cannot infer from parametric knowledge alone' the patient- or jurisdiction-specific criteria is inferred from the GR vs. Non-GR contrast rather than directly tested. No control condition (e.g., a knowledge-probe prompt asking the same four LLMs to generate or apply the exact rubric criteria independently of the scoring task) is described, leaving open alternative explanations such as prompt-length effects, scale-anchoring differences, or general leniency in open-ended scoring.
Authors: We agree that the interpretation of why Non-GR compresses scores is inferred from the protocol contrast rather than isolated by a dedicated knowledge-probe condition. The GR vs. Non-GR manipulation directly tests the effect of rubric anchoring, and the resulting differences in variance and discrimination between DRG and Baseline outputs support the role of explicit criteria. However, we acknowledge that alternatives such as prompt length or general leniency remain possible. We will revise the abstract's final sentence and the discussion to frame the parametric-knowledge explanation as a supported interpretation rather than a definitive causal claim, and we will add an explicit limitation noting the absence of a knowledge-probe control. revision: partial
-
Referee: [Abstract] Abstract and Methods (implied): effect sizes, amplification factors (1.76–5.10), and interaction terms are stated without accompanying raw data, model versions, exact rubric text, full statistical output tables, or code, so the reported numbers cannot be verified or sensitivity-checked.
Authors: We accept this point. The submitted manuscript reports summary statistics and model-derived quantities without the underlying data, full model outputs, exact rubric wording, or analysis code. In the revision we will add these materials as supplementary files, specify all model versions and hyperparameters, include the complete rubric text, and provide a public repository link containing the raw scores, LME model code, and sensitivity analyses so that the reported effect sizes and interactions can be independently verified. revision: yes
-
Referee: [Methods] Linear mixed-effects analysis: the models include protocol interactions with CDSS prompt configuration and rater model but, per the skeptic note, omit any knowledge-probe factor that would isolate the parametric-knowledge assumption; this omission makes the causal attribution to 'inability to infer patient-specific criteria' load-bearing yet untested.
Authors: The LME specification was chosen to estimate the protocol-by-prompt-configuration and protocol-by-rater interactions that were the primary scientific targets. We agree that a knowledge-probe factor would provide a more direct test of the parametric-knowledge hypothesis. The current design nevertheless isolates the effect of rubric provision itself. We will revise the Methods and Discussion sections to state the limitation explicitly and to qualify the causal language around parametric knowledge, while retaining the observed protocol effects as the core empirical result. revision: partial
Circularity Check
No circularity: fully empirical comparison of scoring protocols
full rationale
The paper conducts a factorial experiment scoring CDSS outputs from four LLMs under GR vs Non-GR protocols, then fits linear mixed-effects models to estimate protocol main effects and interactions with design factors. All reported quantities (mean score differences, IQR ratios, discrimination amplification factors 1.76-5.10) are direct statistical summaries of the observed data rather than any derivation that reduces to its own inputs by construction. No equations, ansatzes, uniqueness theorems, or self-citations are invoked as load-bearing premises; the interpretation that Non-GR cannot substitute for patient-specific criteria is presented as an inference from the empirical pattern, not a definitional or fitted tautology. The study is therefore self-contained against external benchmarks.
Axiom & Free-Parameter Ledger
axioms (1)
- domain assumption Linear mixed effects model assumptions hold for the crossed design of scoring protocol with CDSS model, prompt configuration, rater model, prompt character, and prompt type
Reference graph
Works this paper leans on
-
[1]
(2023) Interobserver Variability Studies in Diagnostic Imaging: A Methodological Systematic Review.British Journal of Radiology, 96(1148), 20220972
Quinn, L., et al. (2023) Interobserver Variability Studies in Diagnostic Imaging: A Methodological Systematic Review.British Journal of Radiology, 96(1148), 20220972
2023
-
[2]
L., et al
Di Forti, C. L., et al. (2025) Inter-Rater Reliability of Psychiatric Diagnosis: A Systematic Review and Meta-Analysis.European Psychiatry, 68(suppl. 1), S191–S192
2025
-
[3]
S., et al
Tawfik, D. S., et al. (2018) Physician Burnout, Well-being, and Work Unit Safety Grades in Relationship to Reported Medical Errors.Mayo Clinic Proceedings, 93(11), 1571–1580
2018
-
[4]
(2026) Holistic Evaluation of Large Language Models for Medical Tasks with MedHELM
Bedi, S., et al. (2026) Holistic Evaluation of Large Language Models for Medical Tasks with MedHELM. Nature Medicine, 32(3), 943–951
2026
-
[5]
HealthBench: Evaluating Large Language Models Towards Improved Human Health
Arora, R. K., et al. (2025) HealthBench: Evaluating Large Language Models Towards Improved Human Health. arXiv:2505.08775
work page internal anchor Pith review Pith/arXiv arXiv 2025
-
[6]
(2025) Medical Hallucination in Foundation Models and Their Impact on Healthcare
Kim, Y., et al. (2025) Medical Hallucination in Foundation Models and Their Impact on Healthcare. medRxiv:2025.02.28.25323115. 11
2025
-
[7]
Omar, M., et al. (2025) Multi-Model Assurance Analysis Showing Large Language Models Are Highly Vulnerable to Adversarial Hallucination Attacks During Clinical Decision Support.Communications Medicine, 5, article 330
2025
-
[8]
(2024) LLM Evaluators Recognize and Favor Their Own Generations.Advances in Neural Information Processing Systems, 37
Panickssery, A., et al. (2024) LLM Evaluators Recognize and Favor Their Own Generations.Advances in Neural Information Processing Systems, 37
2024
-
[9]
(2024) Towards Understanding Sycophancy in Language Models.International Conference on Learning Representations
Sharma, M., et al. (2024) Towards Understanding Sycophancy in Language Models.International Conference on Learning Representations
2024
-
[10]
Sclar, M., et al. (2024) Quantifying Language Models’ Sensitivity to Spurious Features in Prompt Design or: How I Learned to Start Worrying about Prompt Formatting.International Conference on Learning Representations
2024
-
[11]
(2023) Judging LLM-as-a-Judge with MT-Bench and Chatbot Arena.Advances in Neural Information Processing Systems, 36
Zheng, L., et al. (2023) Judging LLM-as-a-Judge with MT-Bench and Chatbot Arena.Advances in Neural Information Processing Systems, 36
2023
-
[12]
(2025) Justice or Prejudice? Quantifying Biases in LLM-as-a-Judge.International Conference on Learning Representations
Ye, J., et al. (2025) Justice or Prejudice? Quantifying Biases in LLM-as-a-Judge.International Conference on Learning Representations
2025
-
[13]
(2024) Benchmarking Cognitive Biases in Large Language Models as Evaluators
Koo, R., et al. (2024) Benchmarking Cognitive Biases in Large Language Models as Evaluators. Findings of the Association for Computational Linguistics: ACL 2024, 517–545
2024
-
[14]
CyclicJudge: Mitigating Judge Bias Efficiently in LLM-based Evaluation
Zhu, Z., et al. (2026) CyclicJudge: Mitigating Judge Bias Efficiently in LLM-based Evaluation. arXiv:2603.01865
work page internal anchor Pith review Pith/arXiv arXiv 2026
-
[15]
(2024) Large Language Models are not Fair Evaluators.Proceedings of the 62nd Annual Meeting of the Association for Computational Linguistics (Volume 1: Long Papers), 9440–9450
Wang, P., et al. (2024) Large Language Models are not Fair Evaluators.Proceedings of the 62nd Annual Meeting of the Association for Computational Linguistics (Volume 1: Long Papers), 9440–9450
2024
-
[16]
(2024) Split and Merge: Aligning Position Biases in LLM-based Evaluators.Proceedings of the 2024 Conference on Empirical Methods in Natural Language Processing, 11084–11108
Li, Z., et al. (2024) Split and Merge: Aligning Position Biases in LLM-based Evaluators.Proceedings of the 2024 Conference on Empirical Methods in Natural Language Processing, 11084–11108
2024
-
[17]
(2026) Evaluative Fingerprints: Stable and Systematic Differences in LLM Evaluator Behavior
Nasser, W. (2026) Evaluative Fingerprints: Stable and Systematic Differences in LLM Evaluator Behavior. arXiv:2601.05114
-
[18]
Alignment faking in large language models
Greenblatt, R., et al. (2024) Alignment Faking in Large Language Models. arXiv:2412.14093
work page internal anchor Pith review Pith/arXiv arXiv 2024
-
[19]
(2025) A Psychometric Framework for Evaluating and Shaping Personality Traits in Large Language Models.Nature Machine Intelligence, 7, 1954–1968
Serapio-García, G., et al. (2025) A Psychometric Framework for Evaluating and Shaping Personality Traits in Large Language Models.Nature Machine Intelligence, 7, 1954–1968
2025
-
[20]
Geathers, J., et al. (2025) Benchmarking Generative AI for Scoring Medical Student Interviews in Objective Structured Clinical Examinations (OSCEs).Artificial Intelligence in Education, Lecture Notes in Computer Science, 15879, Springer, 231–245
2025
-
[21]
Saito, K., et al. (2023) Verbosity Bias in Preference Labeling by Large Language Models.Workshop on Instruction Tuning and Instruction Following at NeurIPS 2023. [22]AmericanDiabetesAssociationProfessionalPracticeCommittee. (2026)9. PharmacologicApproaches to Glycemic Treatment: Standards of Care in Diabetes—2026.Diabetes Care, 49(suppl. 1), S183–S215. do...
-
[22]
D., & Thompson, R
Patterson, H. D., & Thompson, R. (1971) Recovery of Inter-Block Information When Block Sizes Are Unequal.Biometrika, 58(3), 545–554
1971
-
[23]
Dunnett, C. W. (1955) A Multiple Comparison Procedure for Comparing Several Treatments with a Control.Journal of the American Statistical Association, 50(272), 1096–1121
1955
-
[24]
C., & Bates, D
Pinheiro, J. C., & Bates, D. M. (2000)Mixed-Effects Models in S and S-PLUS. Springer
2000
-
[25]
Fisher, R. A. (1925)Statistical Methods for Research Workers. Oliver and Boyd
1925
-
[26]
Card, D., & Krueger, A. B. (1994) Minimum Wages and Employment: A Case Study of the Fast-Food Industry in New Jersey and Pennsylvania.American Economic Review, 84(4), 772–793
1994
-
[27]
Massey, F. J. Jr. (1951) The Kolmogorov-Smirnov Test for Goodness of Fit.Journal of the American Statistical Association, 46(253), 68–78
1951
-
[28]
(2026) Detailed Criteria and Methods for the Application of Health Insurance Benefits (Pharmaceutical): Partial Amendment
Ministry of Health and Welfare. (2026) Detailed Criteria and Methods for the Application of Health Insurance Benefits (Pharmaceutical): Partial Amendment. MOHW Notice No. 2026-24, Health Insurance Review & Assessment Service, 29 Jan. 2026,www.hira.or.kr. 12 A Glossary of Terms Table 1:Glossary of study-specific terms. Term Definition AI rater LLM scoring ...
2026
discussion (0)
Sign in with ORCID, Apple, or X to comment. Anyone can read and Pith papers without signing in.