Predicting Hospitalization from a Whole-Person Health Score with Incomplete Electronic Health Records Data: A Case Study
Reviewed by Pith2026-06-27 14:24 UTCgrok-4.3pith:YP4BGYGEopen to challenge →
The pith
Tailoring models to missing-data patterns best predicts hospitalization from partial whole-person health scores.
A machine-rendered reading of the paper's core claim, the machinery that carries it, and where it could break.
Core claim
When the ten ALI components are entered separately, fitting a distinct logistic regression to each subset of patients who share the same pattern of observed and missing components produces the most accurate in-sample prediction of hospitalization (AUC 0.73), although cross-validated performance is comparable to that of simpler summary measures (AUC approximately 0.63).
What carries the argument
The pattern submodel approach, which partitions the sample by each patient's unique combination of observed and missing ALI components and estimates a separate logistic regression within each partition.
If this is right
- Summary measures of the ALI that combine only the observed components perform nearly identically to one another.
- Modeling the count of hospitalizations adds no predictive gain over a simple binary outcome.
- Logistic regression consistently outperforms random forest on this task.
- Implementation inside an EHR could enable real-time risk flagging for clinicians.
Where Pith is reading between the lines
- The fact that pattern-specific models improve in-sample fit suggests that which tests are ordered may itself be informative about patient risk or care access.
- If the pattern approach generalizes, health systems could pre-compute a small library of submodels rather than imputing every missing value.
- Testing whether clinicians change decisions when shown these predictions would be a direct next experiment.
Load-bearing premise
The 1000 patients drawn from one academic health system, together with the missing-data patterns observed in that system, are representative enough that the reported prediction accuracies will hold in other settings and that missingness does not introduce systematic bias into the ALI components.
What would settle it
A study that applies the same methods to EHR data from a second, independent health system and finds that the pattern-submodel AUC falls below 0.60 or is no higher than a single model fit to all patients regardless of missingness pattern.
Figures




read the original abstract
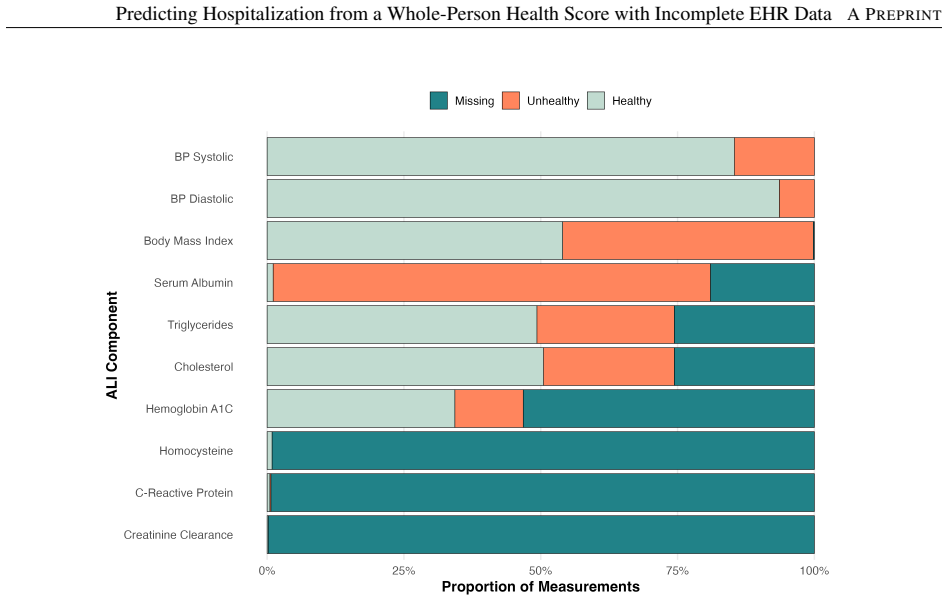
Embedding a standardized whole-person health measure in electronic health records (EHR) could be instrumental to preventative care. The allostatic load index (ALI), calculated from ten component stressors across three body systems, offers a promising snapshot of holistic health. The ALI can be calculated from EHR data, but many components are missing, since not all patients undergo all tests. Using statistical modeling and machine learning, EHR data for $1000$ patients from a large academic health system were used to predict in-patient hospitalization (as a count or binary) from ALI, controlling for age and sex. Various methods were evaluated to fill in information gaps for patients' missing ALI components, including summary measures combining components or using them separately. Performance was measured using receiver operating characteristic (ROC) curves and corresponding areas under the ROC curve (AUC). Count modeling of hospitalization did not improve upon binary, and logistic regression beat random forest. Overall, summary measures performed similarly, with the complete-case proportion (i.e., the proportion of non-missing components that were "unhealthy") performing best (AUC $= 0.64$) but by $\leq 0.01$. When using components separately, the pattern submodel approach most accurately predicted hospitalization (AUC $= 0.73$) in sample, but did not cross-validate as well (AUC $= 0.63$). All summary measures performed similarly. However, when including the ALI components separately, tailoring models to subsets of patients with the same missing data pattern performed best. Next steps include EHR implementation to enable prediction and support clinician decision-making at scale.
Editorial analysis
A structured set of objections, weighed in public.
Referee Report
Summary. The manuscript is a case study using EHR data from 1000 patients at one academic health system to predict hospitalization (binary or count) from the allostatic load index (ALI) and its ten components, while handling missing components via summary measures (e.g., complete-case proportion) versus pattern submodels. Logistic regression outperformed random forest; summary measures yielded similar AUCs around 0.64 (complete-case proportion best at 0.64); pattern submodels on separate components achieved the highest in-sample AUC of 0.73 but dropped to 0.63 on cross-validation.
Significance. If the pattern-submodel advantage proves robust, the work would provide a practical empirical demonstration of leveraging incomplete EHR data for whole-person health scoring and hospitalization risk prediction, which could support scaled preventative care. The direct comparison of missing-data strategies on real clinical data is a strength, but the single-site sample and absence of external validation constrain broader impact.
major comments (1)
- [Abstract] Abstract: the reported superiority of the pattern submodel approach (in-sample AUC = 0.73 when components are used separately) rests on a performance drop to 0.63 under cross-validation; with only 1000 patients total, the fragmentation of data across distinct missingness patterns necessarily produces small subgroups for each submodel, raising the risk that the in-sample gain reflects overfitting rather than stable signal.
minor comments (2)
- [Abstract] Abstract: no details are given on the assumed missing-data mechanism, the exact construction or fitting of the pattern submodels, or basic patient characteristics (age/sex distributions, hospitalization rates), which are needed to evaluate whether the reported AUCs are robust.
- [Abstract] Abstract: the claim that 'count modeling of hospitalization did not improve upon binary' is stated without the corresponding AUC or other performance numbers for the count models.
Simulated Author's Rebuttal
We thank the referee for their constructive feedback on our case study manuscript. We address the major comment below.
read point-by-point responses
-
Referee: [Abstract] Abstract: the reported superiority of the pattern submodel approach (in-sample AUC = 0.73 when components are used separately) rests on a performance drop to 0.63 under cross-validation; with only 1000 patients total, the fragmentation of data across distinct missingness patterns necessarily produces small subgroups for each submodel, raising the risk that the in-sample gain reflects overfitting rather than stable signal.
Authors: We agree that the in-sample AUC of 0.73 for pattern submodels carries a risk of reflecting overfitting given the fragmentation into missingness-pattern subgroups within a sample of 1000 patients. The manuscript already reports the cross-validated AUC of 0.63 for this approach and notes in the abstract that it 'did not cross-validate as well,' with performance comparable to summary measures (AUC 0.64). We do not claim overall superiority for the pattern-submodel method. To address the concern directly, we will revise the abstract to emphasize that cross-validated performance was similar across approaches and add a brief description of the observed missingness patterns and their sample sizes in the results section so readers can evaluate subgroup sizes. revision: partial
Circularity Check
No circularity: empirical case study with standard model fitting and evaluation
full rationale
This is a purely empirical case study that fits logistic regression and random forest models to predict hospitalization from ALI components (or summaries) on 1000 patients, then reports AUC on in-sample data and cross-validation. No derivation chain, uniqueness theorem, ansatz, or mathematical prediction is claimed; performance metrics are computed directly from fitted models on the observed data splits. The pattern-submodel comparison is a standard missing-data handling technique evaluated via cross-validation, with no reduction of outputs to inputs by construction. Self-citations are absent from the load-bearing claims. The analysis is self-contained against external benchmarks (AUC on held-out folds) and does not invoke any of the enumerated circularity patterns.
Axiom & Free-Parameter Ledger
axioms (1)
- domain assumption The ten ALI components validly capture body-system stress and can be treated as observed or missing at random conditional on observed covariates.
Reference graph
Works this paper leans on
-
[1]
Learning health systems using data to drive healthcare improvement and impact: a systematic review
Enticott J, Johnson A, Teede H. Learning health systems using data to drive healthcare improvement and impact: a systematic review. BMC Health Services Research. 2021;21(1):200
2021
-
[2]
Frailty Screening Using the Electronic Health Record Within a Medicare Accountable Care Organization
Pajewski NM, Lenoir K, Wells BJ, Williamson JD, Callahan KE. Frailty Screening Using the Electronic Health Record Within a Medicare Accountable Care Organization. Journals of Gerontology: Series A. 2019;74(11):1771- 7
2019
-
[3]
New horizons in frailty identification via electronic frailty indices: early implementation lessons from experiences in England and the United States
Orkaby AR, Callahan KE, Driver JA, Hudson K, Clegg AJ, Pajewski NM. New horizons in frailty identification via electronic frailty indices: early implementation lessons from experiences in England and the United States. Age and Ageing. 2024;53(2):afae025
2024
-
[4]
Allostatic load as a marker of cumulative biological risk: MacArthur studies of successful aging
Seeman TE, McEwen BS, Rowe JW, Singer BH. Allostatic load as a marker of cumulative biological risk: MacArthur studies of successful aging. Proceedings of the National Academy of Science. 2001;98(8):4770–4775
2001
-
[5]
Measuring allostatic load in the workforce: a systematic review
Mauss D, Li J, Schmidt B, Angerer P, Jarczok MN. Measuring allostatic load in the workforce: a systematic review. Industrial Health. 2015;53(1):5-20
2015
-
[6]
Allostatic load as predictor of mortality: a cohort study from Lolland-Falster, Denmark
Bruun-Rasmussen NE, Napolitano G, Christiansen C, et al. Allostatic load as predictor of mortality: a cohort study from Lolland-Falster, Denmark. BMJ Open. 2022;12(e057136)
2022
-
[7]
R: A Language and Environment for Statistical Computing
R Core Team. R: A Language and Environment for Statistical Computing. Vienna, Austria; 2025. Available from: https://www.R-project.org/
2025
-
[8]
ranger: A Fast Implementation of Random Forests for High Dimensional Data in C++ and R
Wright MN, Ziegler A. ranger: A Fast Implementation of Random Forests for High Dimensional Data in C++ and R. Journal of Statistical Software. 2017;77(1):1-17
2017
-
[9]
Random Forests
Breiman L. Random Forests. Machine Learning. 2001;45(1):5-32
2001
-
[10]
Assessing Missing Data Assumptions in EHR-Based Studies: A Complex and Underappreciated Task
Haneuse S, Arterburn D, Daniels MJ. Assessing Missing Data Assumptions in EHR-Based Studies: A Complex and Underappreciated Task. JAMA Network Open. 2021 02;4(2):e210184-4
2021
-
[11]
Overcoming data challenges through enriched validation and targeted sampling to measure whole-person health in electronic health records
Lotspeich SC, Kedar S, Tahir R, Keleghan AD, Miranda A, Duda SN, et al. Overcoming data challenges through enriched validation and targeted sampling to measure whole-person health in electronic health records. Journal of Biomedical Informatics. 2025;170:104904
2025
-
[12]
A new approach to the analysis of clinical drug trials with withdrawals
Gould AL. A new approach to the analysis of clinical drug trials with withdrawals. Biometrics. 1980;36(4):721–727
1980
-
[13]
Imputation methods for missing outcome data in meta-analysis of clinical trials
Higgins JP, White IR, Wood AM. Imputation methods for missing outcome data in meta-analysis of clinical trials. Clinical Trials. 2008;5(3):225-39
2008
-
[14]
Missing covariate data in clinical research: when and when not to use the missing-indicator method for analysis
Groenwold RHH, White IR, Donders ART, Carpenter JR, Altman DG, Moons KGM. Missing covariate data in clinical research: when and when not to use the missing-indicator method for analysis. Canadian Medical Association Journal. 2012;184(11):1265-9
2012
-
[15]
Reducing Bias in Observational Studies Using Subclassification on the Propensity Score
Rosenbaum PR, Rubin DB. Reducing Bias in Observational Studies Using Subclassification on the Propensity Score. Journal of the American Statistical Association. 1984;79(387):516–524
1984
-
[16]
Estimating and Using Propensity Scores with Partially Missing Data
Rubin RBDDB. Estimating and Using Propensity Scores with Partially Missing Data. Journal of the American Statistical Association. 2000;95(451):749-59. 12 Predicting Hospitalization from a Whole-Person Health Score with Incomplete EHR DataA PREPRINT
2000
-
[17]
Imputation and missing indicators for handling missing data in the development and deployment of clinical prediction models: A simulation study
Sisk R, Sperrin M, Peek N, van Smeden M, Martin GP. Imputation and missing indicators for handling missing data in the development and deployment of clinical prediction models: A simulation study. Statistical Methods in Medical Research. 2023;32(8):1461–1477
2023
-
[18]
Missing data and prediction: the pattern submodel
Fletcher Mercaldo S, Blume JD. Missing data and prediction: the pattern submodel. Biostatistics. 2020;21(2):236- 52
2020
-
[19]
pROC: an open-source package for R and S+ to analyze and compare ROC curves
Robin X, Turck N, Hainard A, Tiberti N, Lisacek F, Sanchez JC, et al. pROC: an open-source package for R and S+ to analyze and compare ROC curves. BMC Bioinformatics. 2011;12:77
2011
-
[20]
C-reactive protein and other markers of inflammation in the prediction of cardiovascular disease in women
Ridker PM, Hennekens CH, Buring JE, Rifai N. C-reactive protein and other markers of inflammation in the prediction of cardiovascular disease in women. The New England Journal of Medicine. 2000;342(12):836–843
2000
-
[21]
Detection of homocysteine and C-reactive protein in the saliva of healthy adults: comparison with blood levels
Dillon MC, Opris DC, Kopanczyk R, Lickliter J, Cornwell HN, Bridges EG, et al. Detection of homocysteine and C-reactive protein in the saliva of healthy adults: comparison with blood levels. Biomarker Insights. 2010;5:57–61
2010
-
[22]
Urinary N-acetyl-beta-d-glucosaminidase levels in diabetic adults
Omozee EB, Okaka EI, Edo AE, Obika LF. Urinary N-acetyl-beta-d-glucosaminidase levels in diabetic adults. Journal of Laboratory Physicians. 2019;11(1):1-4
2019
-
[23]
The Whole PERSON Health Score: A Patient- Focused Tool to Measure Nonmedical Determinants of Health
Khurana D, Leung G, Sasaninia B, Tran D, Khan M, Firek A. The Whole PERSON Health Score: A Patient- Focused Tool to Measure Nonmedical Determinants of Health. NEJM Catalyst Innovations in Care Delivery. 2022;3(8):CAT.22.0096
2022
-
[24]
Whole Person Health: What It Is and Why It’s Important; 2024
National Center for Complementary and Integrative Health. Whole Person Health: What It Is and Why It’s Important; 2024. Retrieved November 21, 2024. https://www.nccih.nih.gov/health/ whole-person-health-what-it-is-and-why-its-important
2024
-
[25]
Multiple imputation for nonresponse in surveys
Rubin DB. Multiple imputation for nonresponse in surveys. vol. 81. John Wiley & Sons; 2004
2004
-
[26]
Strategies for handling missing data in electronic health record derived data
Wells BJ, Chagin KM, Nowacki AS, Kattan MW. Strategies for handling missing data in electronic health record derived data. eGEMS. 2013;1(3):1035
2013
-
[27]
Don’t Do Imputation: Dealing with Informative Missing Values in EHR Data Analysis
Li J, Wang M, Steinbach MS, Kumar V , Simon GJ. Don’t Do Imputation: Dealing with Informative Missing Values in EHR Data Analysis. In: 2018 IEEE International Conference on Big Knowledge (ICBK); 2018. p. 415-22
2018
-
[28]
Caveats for the use of operational electronic health record data in comparative effectiveness research
Hersh WR, Weiner MG, Embi PJ, Logan JR, Payne PR, Bernstam EV , et al. Caveats for the use of operational electronic health record data in comparative effectiveness research. Medical Care. 2013;51(8 Suppl 3):S30-7
2013
-
[29]
The Evolving Use of Electronic Health Records (EHR) for Research
Kim E, Rubinstein SM, Nead KT, Wojcieszynski AP, Gabriel PE, Warner JL. The Evolving Use of Electronic Health Records (EHR) for Research. Seminars in radiation oncology. 2019;29(4):354-61
2019
-
[30]
Use of EHRs data for clinical research: Historical progress and current applications
Nordo AH, Levaux HP, Becnel LB, Galvez J, Rao P, Stem K, et al. Use of EHRs data for clinical research: Historical progress and current applications. Learning Health Systems. 2019;3(1):e10076
2019
-
[31]
The impact of covariate measurement error on risk prediction
Khudyakov P, Gorfine M, Zucker D, Spiegelman D. The impact of covariate measurement error on risk prediction. Statistics in Medicine. 2015;34(15):2353–2367
2015
-
[32]
Index of cardiometabolic health: A new method of measuring allostatic load using electronic health records
Nobel L, Roblin DW, Becker ER, Druss BG, Joski PI, Allison JJ. Index of cardiometabolic health: A new method of measuring allostatic load using electronic health records. Biomarkers. 2017;22(5):394-402. Supplementary Materials • Additional details, tables, and figures:The supplemental figures and tables referenced are available online at https://github.co...
2017
discussion (0)
Sign in with ORCID, Apple, or X to comment. Anyone can read and Pith papers without signing in.