A Patient-Specific Pulmonary Arterial Tree Digital Twin to Extract Pulmonary Embolism Biomarkers
Pith reviewed 2026-06-29 13:02 UTC · model grok-4.3
The pith
An automated pipeline converts AI-generated CT masks into a directed graph model of the pulmonary arterial tree to derive patient-specific embolism biomarkers and severity scores.
A machine-rendered reading of the paper's core claim, the machinery that carries it, and where it could break.
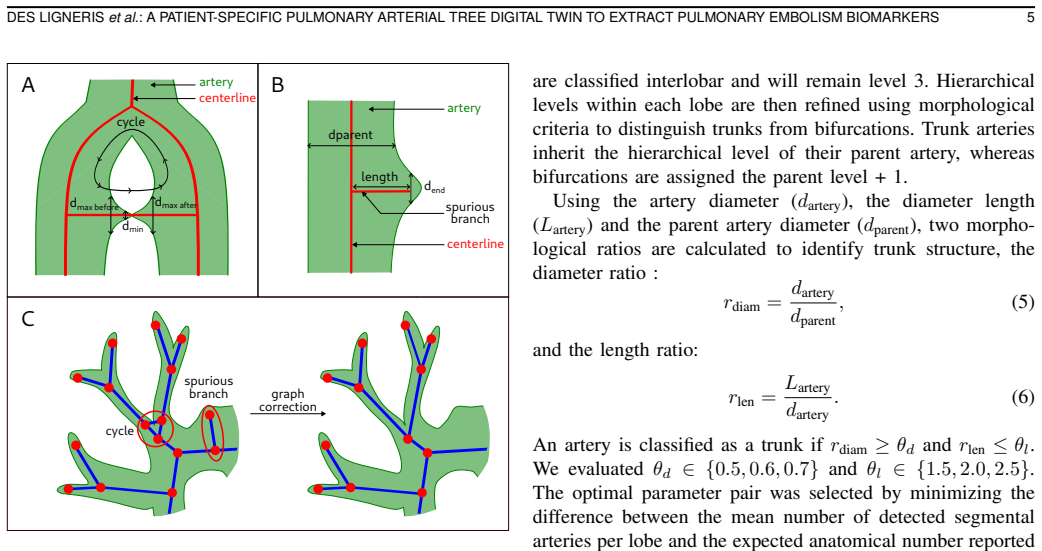
Core claim
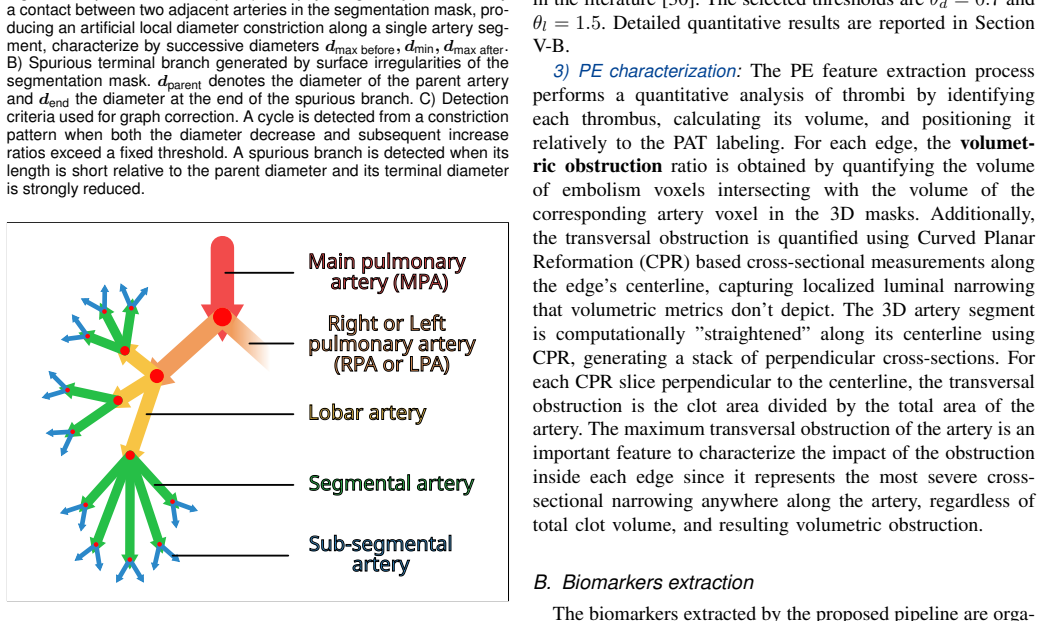
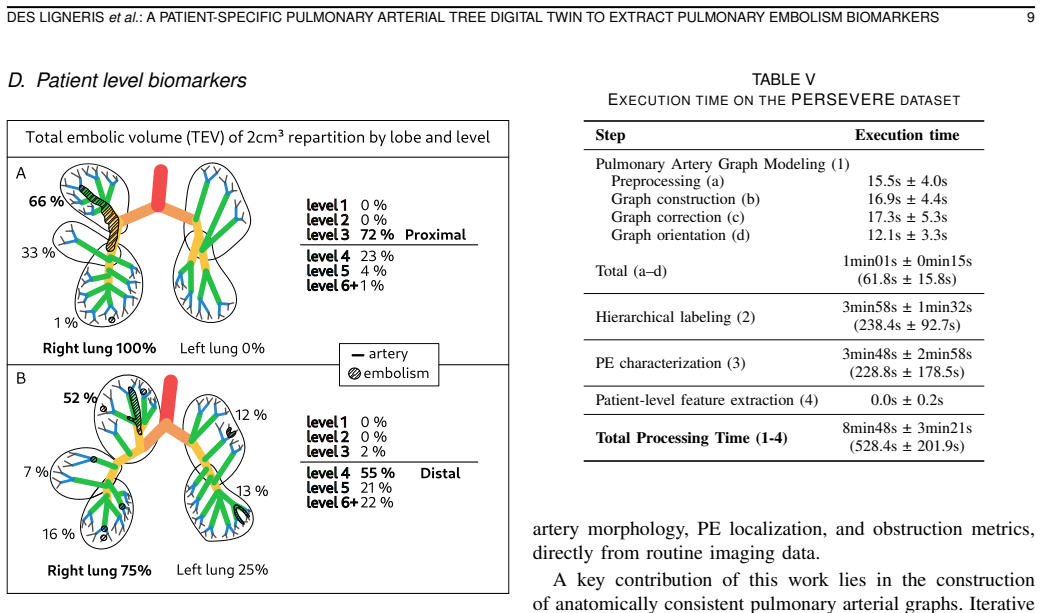
Using artificial-intelligence-generated binary masks as input, the pipeline builds a directed graph representation of the pulmonary arterial tree, labels its hierarchical structure, and extracts both artery-level biomarkers (morphology, position, clot volume, obstruction) and patient-level biomarkers (Qanadli and Mastora severity scores plus total embolic volume by lobes and levels), with the resulting digital twins and scores agreeing with manual calculations and anatomical expectations.
What carries the argument
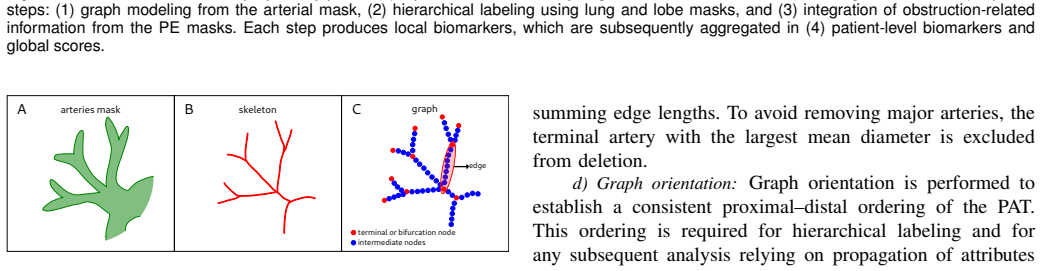
The directed graph representation of the pulmonary arterial tree, constructed from binary masks, that labels hierarchical branches and enables extraction of local morphological and obstruction features plus global severity scores.
If this is right
- Severity scores can be produced automatically without manual calculation or blood biomarkers.
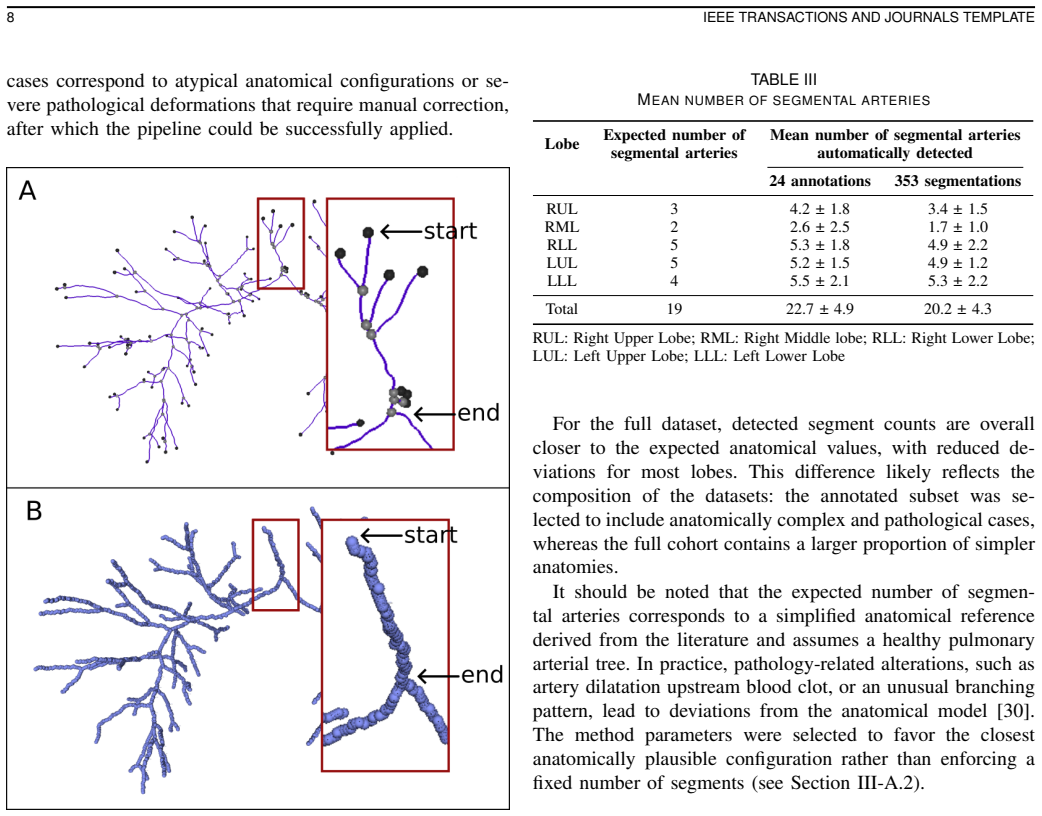
- Embolic burden can be quantified by lobe and by hierarchical level in the arterial tree.
- Local obstruction and clot volume become available at every artery segment for finer spatial analysis.
- The same graph model supports consistent comparison across patients or serial scans.
Where Pith is reading between the lines
- The graph structure could be reused to simulate flow changes after clot removal or to test alternative risk metrics.
- Extending the same masking-to-graph approach to other vascular beds would require only retraining the upstream segmentation models.
- Integration into emergency CT workflows could reduce the time from scan to risk stratification.
Load-bearing premise
The upstream AI-generated binary masks of arteries, emboli, lungs, and lobes must be sufficiently accurate for the graph construction and biomarker steps to produce reliable results.
What would settle it
A head-to-head comparison on a new cohort of CT pulmonary angiograms where the automated Qanadli and Mastora scores differ substantially from scores calculated manually by multiple radiologists.
Figures


read the original abstract
Pulmonary embolism, the obstruction of a pulmonary artery by a blood clot, is one of the leading causes of acute cardiovascular syndrome. In clinical practice, therapeutic decisions after diagnosis via computed tomography pulmonary angiography rely on risk stratification, which categorizes 30-day mortality risk into three categories. This stratification depends on the right-to-left ventricular diameter ratio and blood levels of two cardiac enzymes. However, blood biomarkers are not always available in emergency settings, and manual calculation of established severity scores - such as Qanadli and Mastora - is time-consuming and rarely performed in clinical routine practice. This study introduces an automated pipeline that models a directed graph representation of the pulmonary arterial tree, labeling its hierarchical structure and characterizing pulmonary embolism. The pipeline derives image-based biomarkers, including local artery-level features (morphological information, hierarchical position, clot volume, and resulting obstruction) and global patient-level biomarkers such as automatically calculated severity scores (Qanadli and Mastora) and the total embolic volume distribution by lobes and hierarchical levels. Using artificial-intelligence-generated binary masks of arteries, emboli, lungs, and lobes, it creates a patient digital twin of the arterial structure. Validation of the pipeline through comparison to an existing pipeline, anatomical expectations, and manual severity score calculations demonstrates the pipeline's ability to automatically generate anatomically accurate digital twins and severity scores with strong agreement. This supports the potential of these image-derived biomarkers to automatically provide rapid, precise information on thrombotic burden and spatial clot distribution.
Editorial analysis
A structured set of objections, weighed in public.
Referee Report
Summary. The paper presents an automated pipeline that takes AI-generated binary masks of pulmonary arteries, emboli, lungs, and lobes as input, constructs a directed-graph representation of the patient-specific pulmonary arterial tree, performs hierarchical labeling, and extracts local artery-level biomarkers (morphology, position, clot volume, obstruction) together with global patient-level biomarkers including automatically computed Qanadli and Mastora severity scores and embolic volume distributions.
Significance. If the pipeline's outputs prove robust, the work would supply a practical route to rapid, image-derived risk stratification for pulmonary embolism that bypasses manual score calculation and blood-biomarker availability constraints, potentially improving routine clinical decision-making.
major comments (2)
- [Abstract] Abstract: the central claim of 'strong agreement' with manual severity scores and 'anatomically accurate digital twins' is asserted without any quantitative metrics, cohort size, exclusion criteria, or error statistics; the provided text supplies no numbers that would allow verification of the validation results.
- [Abstract / Validation] Validation description (abstract and implied results): the reported comparisons to an existing pipeline, anatomical expectations, and manual scores evaluate only downstream graph construction and obstruction calculations under the assumption that the upstream AI masks are already accurate; no sensitivity analysis, error-propagation study, or ground-truth segmentation comparison is described that would quantify how typical mask inaccuracies affect hierarchical labeling or final patient-level scores.
Simulated Author's Rebuttal
We thank the referee for the constructive feedback. We address each major comment below and indicate revisions made to strengthen the manuscript.
read point-by-point responses
-
Referee: [Abstract] Abstract: the central claim of 'strong agreement' with manual severity scores and 'anatomically accurate digital twins' is asserted without any quantitative metrics, cohort size, exclusion criteria, or error statistics; the provided text supplies no numbers that would allow verification of the validation results.
Authors: We agree that the abstract, standing alone, does not contain the quantitative details needed to substantiate the claims. The full manuscript reports these metrics in the results, but to make the abstract verifiable we have revised it to include cohort size, specific agreement statistics with manual Qanadli/Mastora scores, and error measures. revision: yes
-
Referee: [Abstract / Validation] Validation description (abstract and implied results): the reported comparisons to an existing pipeline, anatomical expectations, and manual scores evaluate only downstream graph construction and obstruction calculations under the assumption that the upstream AI masks are already accurate; no sensitivity analysis, error-propagation study, or ground-truth segmentation comparison is described that would quantify how typical mask inaccuracies affect hierarchical labeling or final patient-level scores.
Authors: The validation targets the graph-construction and biomarker-extraction stages given the input masks; upstream segmentation performance is documented in the cited mask-generation studies. We acknowledge that explicit sensitivity testing would be valuable. We have therefore added a sensitivity-analysis subsection that perturbs the input masks according to reported segmentation error rates and quantifies downstream effects on labeling accuracy and patient-level scores. revision: yes
Circularity Check
No significant circularity detected
full rationale
The pipeline constructs a directed graph from upstream AI-generated binary masks of arteries, emboli, lungs, and lobes, then computes local artery-level features (morphology, hierarchical position, clot volume, obstruction) and global biomarkers (Qanadli/Mastora scores, embolic volume distribution) directly via graph traversal and volume calculations. These steps are algorithmic extractions from the input masks and graph structure, with no equations, fitted parameters, or self-referential definitions that reduce outputs to inputs by construction. Validation relies on comparison to an existing pipeline, anatomical expectations, and manual score calculations, which are independent of the automated steps. No self-citation chains or ansatzes are invoked as load-bearing for the core derivation. The method is self-contained against external benchmarks.
Axiom & Free-Parameter Ledger
axioms (1)
- domain assumption AI-generated binary masks of arteries, emboli, lungs, and lobes are sufficiently accurate to support reliable graph construction and biomarker extraction.
invented entities (1)
-
Patient-specific pulmonary arterial tree digital twin
no independent evidence
Forward citations
Cited by 2 Pith papers
-
Pulmonary Embolism Risk Stratification from CTPA and Medical Records: Vascular Graphs Are Not All You Need
On a private dataset of 353 patients, medical records and cardiac biomarkers from CTPA outperform vascular biomarkers and GNNs on vascular graphs for PE risk stratification.
-
Pulmonary Embolism Risk Stratification from CTPA and Medical Records: Vascular Graphs Are Not All You Need
In a private dataset of 353 patients, medical records and cardiac biomarkers outperform vascular biomarkers and GNNs on vascular graphs for PE risk stratification, suggesting vascular graphs hold no discriminative inf...
Reference graph
Works this paper leans on
-
[1]
VSMOD: A Vessel Segmentation and MODelization plugin for 3D Slicer,
[1] M. des Ligneris, G. Husak, A. Aillet, G. Doll ´e, C. Frindel, and O. Merveille, “VSMOD: A Vessel Segmentation and MODelization plugin for 3D Slicer,”Journal of Open Source Software, vol. 10, no. 114, p. 8563, Oct. 2025
2025
discussion (0)
Sign in with ORCID, Apple, or X to comment. Anyone can read and Pith papers without signing in.