Pulmonary Embolism Risk Stratification from CTPA and Medical Records: Vascular Graphs Are Not All You Need
Pith reviewed 2026-06-29 04:47 UTC · model grok-4.3
The pith
Vascular graphs from CTPA add no value to pulmonary embolism risk stratification beyond medical records and cardiac biomarkers.
A machine-rendered reading of the paper's core claim, the machinery that carries it, and where it could break.
Core claim
The central claim is that among global features, medical records and cardiac biomarkers are the most significant predictors for PE risk stratification, vascular biomarkers extracted from CTPA do not further improve results, and even GNNs operating on the vascular tree's intrinsic graph representation fail to outperform a strong tabular baseline on global features alone, which leads the authors to conclude that vascular graphs might hold no discriminative information for this task.
What carries the argument
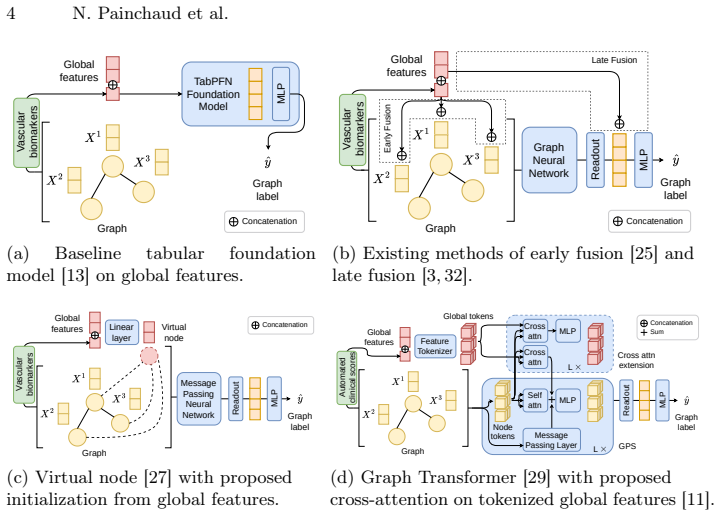
Direct performance comparison between tabular models trained on global features (medical records plus cardiac biomarkers) and graph neural networks trained on the pulmonary vascular graph extracted from CTPA images.
If this is right
- Medical records together with cardiac biomarkers extracted from CTPA are sufficient to achieve the observed stratification performance.
- Vascular biomarkers derived from the same CTPA images provide no measurable gain when added to the global feature set.
- Graph neural networks on vascular graphs do not exceed the accuracy of tabular models that ignore the vascular structure entirely.
- Discriminative signals for PE risk reside primarily in systemic patient data rather than in local vascular geometry.
- Any explanation for the GNN underperformance must address either the model class or properties of the vascular data itself.
Where Pith is reading between the lines
- If the finding holds, clinical pipelines could de-emphasize vascular graph extraction and focus resources on ensuring complete medical records and basic biomarker collection.
- The same tabular-versus-graph comparison could be run on other vascular or cardiac risk tasks to test whether graph representations are broadly uninformative.
- Alternative node definitions or edge-weighting schemes for the vascular graph could be tried on this dataset to isolate whether the construction method itself hides useful signals.
- The result suggests that PE risk may be driven more by global physiological state than by detectable local vascular remodeling visible on standard CTPA.
Load-bearing premise
The GNN architectures and vascular graph construction methods used are adequate to extract discriminative information from the vascular tree if any such information exists in the data.
What would settle it
A different GNN architecture or vascular graph construction method that achieves statistically higher accuracy than the tabular baseline on the same 353-case dataset would falsify the claim that vascular graphs hold no discriminative information.
Figures

read the original abstract
Risk stratification for pulmonary embolism (PE) is critical for clinical decision-making. Stratification guidelines are based on patient medical records, parameters measured from computed tomography pulmonary angiography (CTPA), and blood tests. However, blood tests are often missing in routine practice. This work studies whether state-of-the-art models can accurately classify risk stratification from only medical records and biomarkers extracted from CTPA images. We benchmark different approaches to combine medical records and cardiac biomarkers with rich pulmonary vascular information; we add vascular biomarkers to tabular models and apply graph neural networks (GNNs) on the vascular tree's intrinsic graph representation. We use a private dataset (n=353) with uniquely complete data for PE risk stratification. Our results show that, among global features, medical records and cardiac biomarkers are the most significant predictors, while vascular biomarkers do not further improve stratification. Even more surprising, even GNNs on vascular graphs fail to outperform strong tabular baseline on global features. We consider hypotheses, on both models and data, that could explain this suboptimal performance. Our investigation suggests that, counter-intuitively, vascular graphs might hold no discriminative information for PE risk stratification. Code is available from https://github.com/creatis-myriad/GENESIS.
Editorial analysis
A structured set of objections, weighed in public.
Referee Report
Summary. The manuscript reports an empirical benchmark on PE risk stratification using a private dataset of 353 patients with complete CTPA and medical record data. It compares tabular models using medical records, cardiac biomarkers, and vascular biomarkers against GNNs applied to vascular tree graphs derived from CTPA segmentations. The central claim is that medical records and cardiac biomarkers are the strongest predictors, vascular biomarkers add no value, and GNNs on vascular graphs do not outperform strong tabular baselines on global features, leading to the suggestion that vascular graphs hold no discriminative information for this task. Hypotheses on models and data are considered, and code is released.
Significance. If the negative result on vascular graphs is robust, the work would indicate that graph-based representations of pulmonary vasculature from CTPA do not capture additional risk-stratification signal beyond standard clinical tabular features, which could simplify model design in this clinical domain and question the added value of GNNs here. Credit is due for releasing code and for explicitly enumerating hypotheses to explain the observed performance gap.
major comments (2)
- [Abstract] Abstract: The claim that 'vascular graphs might hold no discriminative information for PE risk stratification' is a direct inference from GNNs failing to beat tabular baselines. This interpretation is load-bearing on the assumption that the chosen vascular graph construction (node/edge definitions from CTPA segmentations) and GNN message-passing are expressive enough to recover any existing vascular predictors (e.g., embolus location, branching topology, or diameter changes) if present in the data. No positive control (synthetic recovery test or known vascular signal) is described to validate this expressiveness.
- [Results/Discussion] Results/Discussion: The manuscript notes that hypotheses on models and data were considered, yet the reported experiments appear to lack ablation details on GNN depth, aggregation functions, or alternative graph constructions that could isolate whether the negative result stems from insufficient model capacity versus true absence of signal. This weakens the support for the central negative claim.
minor comments (1)
- [Methods] The private dataset precludes full external verification of splits and preprocessing; while code release helps, additional reporting of performance error bars, exact data splits, and full ablation tables would improve clarity of the empirical claims.
Simulated Author's Rebuttal
We thank the referee for the constructive feedback on our empirical benchmark. We address the two major comments point by point below, agreeing that additional validation would strengthen the central negative claim on vascular graphs.
read point-by-point responses
-
Referee: [Abstract] Abstract: The claim that 'vascular graphs might hold no discriminative information for PE risk stratification' is a direct inference from GNNs failing to beat tabular baselines. This interpretation is load-bearing on the assumption that the chosen vascular graph construction (node/edge definitions from CTPA segmentations) and GNN message-passing are expressive enough to recover any existing vascular predictors (e.g., embolus location, branching topology, or diameter changes) if present in the data. No positive control (synthetic recovery test or known vascular signal) is described to validate this expressiveness.
Authors: We agree that an explicit positive control would provide stronger support for the claim that the negative result reflects absence of signal rather than insufficient model expressiveness. The manuscript tested multiple standard GNN architectures (GCN, GAT, GraphSAGE) known to be expressive on tree-structured graphs, but did not include a synthetic recovery test. In the revision we will add such a control: we will inject synthetic vascular predictors (e.g., simulated embolus locations and diameter changes) into the graphs and verify that the GNNs recover the injected signal above chance, thereby validating that the chosen construction and message-passing are capable of detecting vascular information if present. revision: yes
-
Referee: [Results/Discussion] Results/Discussion: The manuscript notes that hypotheses on models and data were considered, yet the reported experiments appear to lack ablation details on GNN depth, aggregation functions, or alternative graph constructions that could isolate whether the negative result stems from insufficient model capacity versus true absence of signal. This weakens the support for the central negative claim.
Authors: We performed internal ablations on GNN depth and aggregation during development and reported the best-performing configurations, but these details were condensed in the main text and only partially shown in the supplement. We agree that fuller reporting is warranted to isolate capacity versus signal absence. In the revised manuscript we will expand both the main text and supplementary material with systematic ablations covering GNN depth (2–6 layers), aggregation functions (mean, max, sum, attention), and alternative graph constructions (edge features for vessel diameter, different node definitions based on branching points). These additions will directly address whether the performance gap persists across model variations. revision: yes
Circularity Check
No circularity: empirical benchmarking on held-out data
full rationale
The paper reports direct empirical comparisons of tabular models, vascular biomarkers, and GNNs on vascular graphs using a private dataset (n=353) with held-out evaluation. No mathematical derivations, fitted parameters renamed as predictions, or self-citation chains appear in the abstract or described methods. The central claim (vascular graphs hold no discriminative information) follows from observed performance gaps on external splits rather than any self-definitional reduction or ansatz smuggled via prior work. This matches the default expectation of a non-circular empirical study.
Axiom & Free-Parameter Ledger
axioms (1)
- domain assumption The private dataset of 353 patients with complete PE risk data is representative of the broader population and free of selection bias that would mask vascular graph information.
Reference graph
Works this paper leans on
-
[1]
Sensors21(14), 4758 (Jan 2021)
Ahmedt-Aristizabal, D., et al.: Graph-Based Deep Learning for Medical Diagno- sis and Analysis: Past, Present and Future. Sensors21(14), 4758 (Jan 2021). https://doi.org/10.3390/s21144758
-
[2]
Akiba, T., et al.: Optuna: A Next-generation Hyperparameter Op- timization Framework. In: Proc. KDD. pp. 2623–2631 (2019). https://doi.org/10.1145/3292500.3330701
-
[3]
In: Learning on Graphs (LoG) (2023),https://openreview.net/forum? id=aisVQy6R2k
Brasoveanu, A.D., et al.: Extending Graph Neural Networks with Global Fea- tures. In: Learning on Graphs (LoG) (2023),https://openreview.net/forum? id=aisVQy6R2k
2023
-
[4]
ICLR (2021),https://openreview.net/forum?id=F72ximsx7C1
Brody, S., Alon, U., Yahav, E.: How Attentive are Graph Attention Networks? In: Proc. ICLR (2021),https://openreview.net/forum?id=F72ximsx7C1
2021
-
[5]
XGBoost: A Scalable Tree Boosting System
Chen, T., Guestrin, C.: XGBoost: A Scalable Tree Boosting System. In: Proc. KDD. pp. 785–794 (2016). https://doi.org/10.1145/2939672.2939785
-
[6]
Nat Commun 16(1), 2262 (Mar 2025)
Chu, Y., et al.: Deep learning-driven pulmonary artery and vein segmentation reveals demography-associated vasculature anatomical differences. Nat Commun 16(1), 2262 (Mar 2025). https://doi.org/10.1038/s41467-025-56505-6
-
[7]
Radiology: Artificial Intelligence3(2), e200254 (Mar 2021)
Colak, Errol et al., F.: The RSNA Pulmonary Embolism CT Dataset. Radiology: Artificial Intelligence3(2), e200254 (Mar 2021). https://doi.org/10.1148/ryai.2021200254
-
[8]
Diagnostic and Interventional Imaging105(3), 97–103 (Mar 2024)
Djahnine, A., et al.: Detection and severity quantification of pulmonary em- bolism with 3D CT data using an automated deep learning-based artificial solution. Diagnostic and Interventional Imaging105(3), 97–103 (Mar 2024). https://doi.org/10.1016/j.diii.2023.09.006
-
[9]
Journal of Machine Learning Research24(43), 1–48 (2023)
Dwivedi, V.P., et al.: Benchmarking Graph Neural Networks. Journal of Machine Learning Research24(43), 1–48 (2023)
2023
-
[10]
In: Proc
Fey, M., et al.: PyG 2.0: Scalable Learning on Real World Graphs. In: Proc. TGL Workshop @ KDD (2025),https://openreview.net/forum?id=DHHLkQvWqs
2025
-
[11]
In: Proc
Gorishniy, Y., et al.: Revisiting Deep Learning Models for Tabular Data. In: Proc. NeurIPS. pp. 18932–18943 (2021) 10 N. Painchaud et al
2021
-
[12]
Image Vis Comput158, 105509 (May 2025)
Guarrasi, V., et al.: A systematic review of intermediate fusion in multimodal deep learning for biomedical applications. Image Vis Comput158, 105509 (May 2025). https://doi.org/10.1016/j.imavis.2025.105509
-
[13]
Hollmann, N., et al.: Accurate predictions on small data with a tabular foundation model. Nature637(8045), 319–326 (Jan 2025). https://doi.org/10.1038/s41586- 024-08328-6
-
[14]
In: Proc
Hu, W., et al.: Open Graph Benchmark: Datasets for Machine Learning on Graphs. In: Proc. NeurIPS. pp. 22118–22133 (2020)
2020
-
[15]
Nat Methods18(2), 203–211 (Feb 2021)
Isensee, F., et al.: nnU-Net: a self-configuring method for deep learning- based biomedical image segmentation. Nat Methods18(2), 203–211 (Feb 2021). https://doi.org/10.1038/s41592-020-01008-z
-
[16]
Arch Intern Med170(15), 1383–1389 (Aug 2010)
Jiménez, D., RIETE Investigators, et al.: Simplification of the Pulmonary Embolism Severity Index for Prognostication in Patients With Acute Symp- tomatic Pulmonary Embolism. Arch Intern Med170(15), 1383–1389 (Aug 2010). https://doi.org/10.1001/archinternmed.2010.199
-
[17]
Khan, W., et al.: A Comprehensive Survey of Foundation Mod- els in Medicine. IEEE Rev Biomed Eng pp. 1–20 (2025). https://doi.org/10.1109/RBME.2025.3531360
-
[18]
In: Proc
Kipf, T.N., Welling, M.: Semi-Supervised Classification with Graph Convolutional Networks. In: Proc. ICLR (2017),https://openreview.net/forum?id=SJU4ayYgl
2017
-
[19]
European Heart Journal41(4), 543–603 (Jan 2020)
Konstantinides, S.V., ESC Scientific Document Group, et al.: 2019 ESC Guide- lines for the diagnosis and management of acute pulmonary embolism developed in collaboration with the European Respiratory Society (ERS). European Heart Journal41(4), 543–603 (Jan 2020). https://doi.org/10.1093/eurheartj/ehz405
-
[20]
des Ligneris, M., et al.: A Patient-Specific Pulmonary Arterial Tree Digital Twin to Extract Pulmonary Embolism Biomarkers (May 2026),https://arxiv.org/abs/ 2605.28217v1, Under review
Pith/arXiv arXiv 2026
-
[21]
Sci Data12(1), 1806 (Nov 2025)
Liu, J., et al.: A Custom Annotated Dataset for Segmentation of Pul- monary Veins, Arteries, and Airways. Sci Data12(1), 1806 (Nov 2025). https://doi.org/10.1038/s41597-025-06074-6
-
[22]
IEEE Trans Pattern Anal Mach Intell47(6), 5023–5044 (Jun 2025)
Liu, J., et al.: Graph Foundation Models: Concepts, Opportunities and Chal- lenges. IEEE Trans Pattern Anal Mach Intell47(6), 5023–5044 (Jun 2025). https://doi.org/10.1109/TPAMI.2025.3548729
-
[23]
Sci Rep11(1), 14909 (Jul 2021)
Liu, X., et al.: Joint analysis of D-dimer, N-terminal pro b-type natriuretic pep- tide, and cardiac troponin I on predicting acute pulmonary embolism relapse and mortality. Sci Rep11(1), 14909 (Jul 2021). https://doi.org/10.1038/s41598-021- 94346-7
-
[24]
https://doi.org/10.48550/arXiv.2304.03708
Luo, G., et al.: Efficient automatic segmentation for multi-level pulmonary arteries: The PARSE challenge (Aug 2024). https://doi.org/10.48550/arXiv.2304.03708
-
[25]
Lutchyn, T., Mardal, M., Ricaud, B.: Efficient Learning of Molecular Properties Using Graph Neural Networks Enhanced with Chemistry Knowledge. ACS Omega (Nov 2025). https://doi.org/10.1021/acsomega.5c07178
-
[26]
Eur Radiol 13(1), 29–35 (Jan 2003)
Mastora, I., et al.: Severity of acute pulmonary embolism: evaluation of a new spi- ral CT angiographic score in correlation with echocardiographic data. Eur Radiol 13(1), 29–35 (Jan 2003). https://doi.org/10.1007/s00330-002-1515-y
-
[27]
Graph Classification via Deep Learning with Virtual Nodes
Pham, T., et al.: Graph Classification via Deep Learning with Virtual Nodes (Aug 2017). https://doi.org/10.48550/arXiv.1708.04357
work page internal anchor Pith review Pith/arXiv arXiv doi:10.48550/arxiv.1708.04357 2017
-
[28]
American Journal of Roentgenology176(6), 1415–1420 (Jun 2001)
Qanadli,S.D.,etal.:NewCTIndextoQuantifyArterialObstructioninPulmonary Embolism. American Journal of Roentgenology176(6), 1415–1420 (Jun 2001). https://doi.org/10.2214/ajr.176.6.1761415 Pulmonary Embolism Risk Stratification from CTPA and Medical Records 11
-
[29]
In: Proc
Rampášek, L., et al.: Recipe for a General, Powerful, Scalable Graph Transformer. In: Proc. NeurIPS. pp. 14501–14515 (2022)
2022
-
[30]
Sci Rep11(1), 15814 (Aug 2021)
Soffer, S., et al.: Deep learning for pulmonary embolism detection on computed tomography pulmonary angiogram: a systematic review and meta-analysis. Sci Rep11(1), 15814 (Aug 2021). https://doi.org/10.1038/s41598-021-95249-3
-
[31]
In: Proc
Stym-Popper, J., et al.: DAFTED: Decoupled Asymmetric Fusion of Tabular and Echocardiographic Data for Cardiac Hypertension Diagnosis. In: Proc. MIDL (2025),https://openreview.net/forum?id=ghhGImwv07
2025
-
[32]
Sun, X., et al.: Graph Neural Network based Future Clinical Events Pre- diction from Invasive Coronary Angiography. In: Proc. ISBI. pp. 1–5 (2024). https://doi.org/10.1109/ISBI56570.2024.10635813
-
[33]
Radiology: Artificial Intelligence5(5), e230024 (Sep 2023)
Wasserthal, J., et al.: TotalSegmentator: Robust Segmentation of 104 Anatomic Structures in CT Images. Radiology: Artificial Intelligence5(5), e230024 (Sep 2023). https://doi.org/10.1148/ryai.230024
-
[34]
ICLR (2018), https://openreview.net/forum?id=ryGs6iA5Km
Xu, K., et al.: How Powerful are Graph Neural Networks? In: Proc. ICLR (2018), https://openreview.net/forum?id=ryGs6iA5Km
2018
-
[35]
IEEE Trans Pattern Anal Mach Intell45(10), 12113–12132 (Oct 2023)
Xu, P., Zhu, X., Clifton, D.A.: Multimodal Learning With Transformers: A Sur- vey. IEEE Trans Pattern Anal Mach Intell45(10), 12113–12132 (Oct 2023). https://doi.org/10.1109/TPAMI.2023.3275156
discussion (0)
Sign in with ORCID, Apple, or X to comment. Anyone can read and Pith papers without signing in.