The Fraction of Clumpy Galaxies in JADES over 2<z<9
Pith reviewed 2026-05-18 21:59 UTC · model grok-4.3
The pith
The fraction of clumpy galaxies rises from roughly 10 percent at redshift 7.75 to 70 percent at redshift 2.75 for galaxies above 10^9 solar masses.
A machine-rendered reading of the paper's core claim, the machinery that carries it, and where it could break.
Core claim
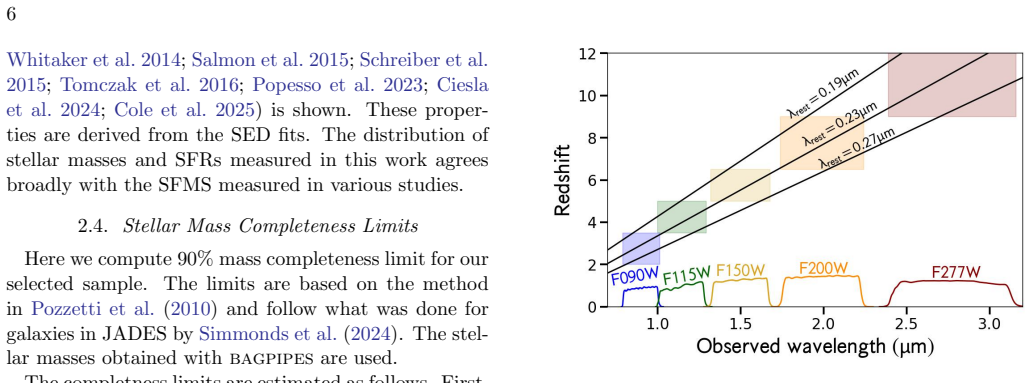
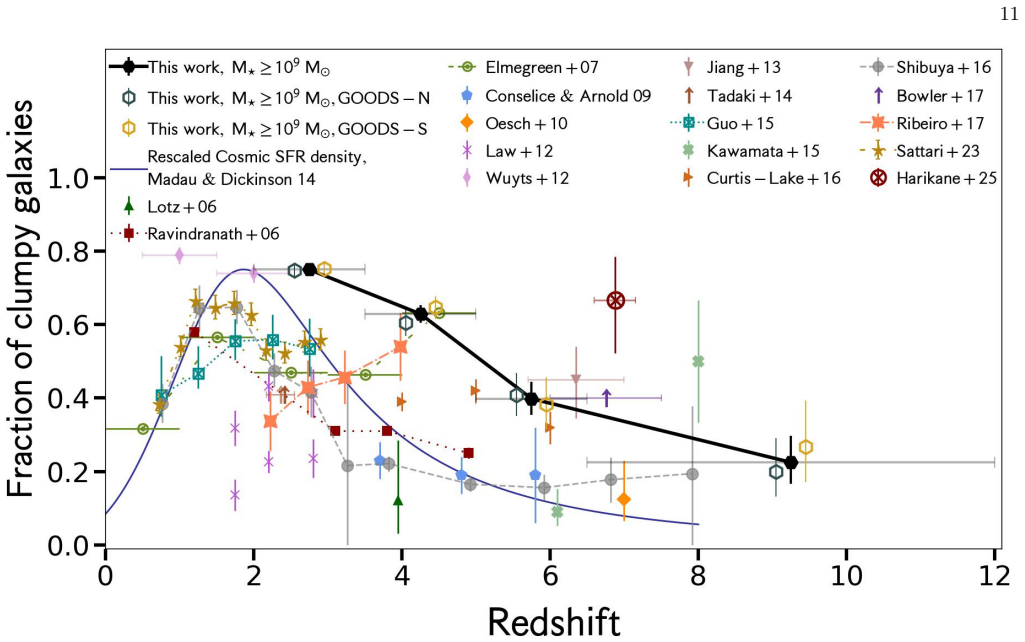
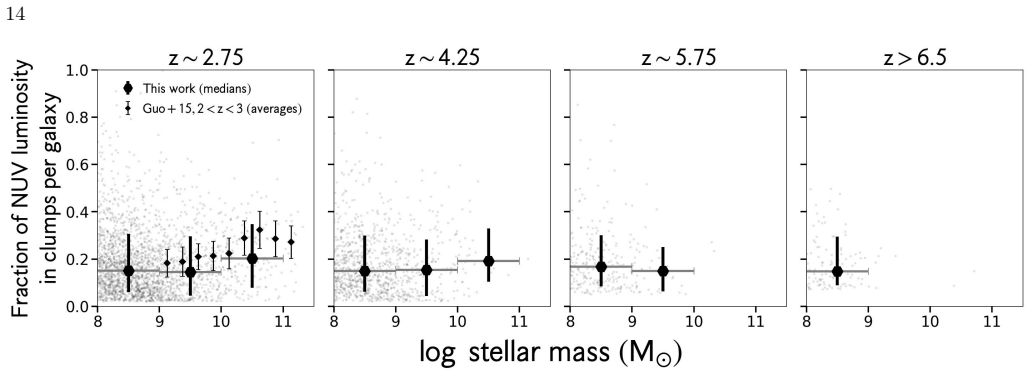
Off-center clumps are detected in the rest-frame near-ultraviolet using JWST imaging from JADES for a sample of 9121 star-forming galaxies with stellar masses at least 10^8 solar masses. The fraction of clumpy galaxies increases from about 10 percent at redshift around 7.75 to about 70 percent at redshift around 2.75 for galaxies with stellar masses at least 10^9 solar masses. These fractions are higher and rise faster with decreasing redshift than those from HST studies, largely due to JWST's higher sensitivity. At lower redshifts and higher masses the data favor gas fragmentation from violent disk instabilities as the main clump formation mechanism, while at higher redshifts and moderate-m
What carries the argument
The clumpy galaxy fraction f_clumpy, obtained by identifying off-center clumps in rest-frame NUV images with a method adapted from prior HST work; this quantity tracks the prevalence of these star-forming regions across redshift and stellar mass.
If this is right
- At redshifts below roughly 5.75 and stellar masses above 10^9 solar masses, gas fragmentation due to violent disk instabilities dominates clump formation.
- At higher redshifts and intermediate stellar masses, gas compression during mergers dominates clump formation.
- JWST sensitivity reveals a higher and more rapidly rising clumpy fraction than HST-based work at fixed redshift.
- The clumpy fraction correlates with stellar mass across the studied range.
Where Pith is reading between the lines
- Galaxy evolution simulations may require updated clump-formation prescriptions to reproduce the elevated fractions seen at intermediate redshifts.
- Kinematic observations of the same galaxies could test whether the shift from merger to instability dominance occurs near redshift 6.
- Deeper or higher-resolution follow-up data could separate true physical clumps from any residual projection or noise effects at the highest redshifts.
- The mass and redshift trends may imply that clumps contribute differently to bulge versus disk growth at early versus later cosmic epochs.
Load-bearing premise
The clump detection method adapted from prior HST studies accurately identifies physical off-center clumps in JWST NUV images without significant contamination from noise, artifacts, or projection effects across the full 2<z<9 range and mass threshold.
What would settle it
Applying deeper imaging or an independent clump-finding algorithm to the same JADES fields and finding a substantially lower clumpy fraction at z around 3 would show that noise or artifacts are inflating the current measurements.
Figures


read the original abstract
High-redshift galaxies exhibit compact regions of intense star formation, known as ``clumps,'' which are conspicuous in the rest-frame ultraviolet. Studying them can shed light on how they form and evolve and inform theoretical models of galaxy evolution. We examine the evolution of clumpy galaxies with redshift and stellar mass over ${2<z<9}$ with James Webb Space Telescope (JWST) imaging from the JWST Advanced Extragalactic Survey (JADES). Off-center clumps are detected in the rest-frame near-ultraviolet (NUV) using similar techniques to those in earlier studies based on Hubble Space Telescope (HST) images. This is done for a sample of 9,121 star-forming galaxies with stellar masses $\log\left(M_{\star}/M_{\odot}\right) \geq 8$. The fraction of clumpy galaxies, $f_{\rm{clumpy}}$, increases from ${\sim10\%}$ at ${z\sim7.75}$ to ${ \sim70\%}$ at $z\sim2.75$ at $\log\left(M_{\star}/M_{\odot}\right) \geq 9$. Our $f_{\rm{clumpy}}$ values are generally higher at fixed redshift and increase faster with decreasing redshift than what studies based on HST data found, which we attribute largely to the higher sensitivity of JWST. $f_{\rm{clumpy}}$ correlates with stellar mass. Our $f_{\rm{clumpy}}$ measurements are compared with those from simulations as well as other observations. At low redshifts ($z\lesssim5.75$) and intermediate-to-high stellar masses ($\log\left(M_{\star}/M_{\odot}\right) \geq 9$), our results suggest gas fragmentation due to violent disk instabilities to be the dominant mechanism for forming clumps. At high redshifts and intermediate stellar masses, compression of gas during mergers appears to dominate.
Editorial analysis
A structured set of objections, weighed in public.
Referee Report
Summary. The manuscript measures the fraction of clumpy galaxies f_clumpy in a sample of 9121 star-forming galaxies with log(M⋆/M⊙) ≥ 8 drawn from the JADES JWST survey over 2 < z < 9. Off-center clumps are identified in rest-frame NUV imaging using techniques adapted from earlier HST studies. The authors report that f_clumpy rises from ∼10% at z ∼ 7.75 to ∼70% at z ∼ 2.75 for the log(M⋆/M⊙) ≥ 9 subsample, with values higher and evolving more steeply than in prior HST work; they attribute the difference primarily to JWST sensitivity. Trends with stellar mass are presented, and the results are compared to simulations to argue that violent disk instabilities dominate clump formation at z ≲ 5.75 and log(M⋆/M⊙) ≥ 9 while mergers dominate at higher redshifts and intermediate masses.
Significance. If the clump detection remains robust after quantitative validation, the work supplies a valuable JWST-based extension of clumpy-galaxy statistics to z ∼ 9 with a large sample. The reported redshift evolution and mass dependence, together with the simulation comparisons, would tighten observational constraints on the relative roles of disk instabilities versus mergers in high-redshift galaxy assembly.
major comments (2)
- [Section 3 (clump detection procedure)] The central result that f_clumpy increases from ∼10% at z ∼ 7.75 to ∼70% at z ∼ 2.75 and exceeds HST-based values relies on the assumption that the adapted clump detection returns a redshift-dependent fraction driven by astrophysics rather than varying completeness or false-positive rates. No injection-recovery tests, redshift-dependent false-positive rates, or completeness corrections specific to the JWST NUV data are reported, leaving open the possibility that the steeper evolution and higher fractions are partly methodological.
- [Section 4 (results) and §5 (discussion)] The attribution of higher f_clumpy to JWST sensitivity (abstract and §4) would be strengthened by a quantitative comparison of the adopted detection threshold and recovered clump properties against the specific HST studies being contrasted, ideally on matched or simulated data sets that isolate the effect of depth and filter shift.
minor comments (2)
- [Abstract] The abstract states results for log(M⋆/M⊙) ≥ 9 while the sample selection is given as ≥ 8; a brief clarification of which mass cut is used for the primary evolutionary trends would aid readability.
- [Figures 2–4] Figure captions and axis labels should explicitly state the exact clump detection threshold (e.g., flux contrast or S/N) and the rest-frame wavelength range probed at each redshift bin.
Simulated Author's Rebuttal
We thank the referee for their careful and constructive review of our manuscript. We have addressed each major comment below with specific revisions to the text and analysis. These changes improve the robustness of our clump detection validation and the quantitative support for our interpretation of JWST sensitivity effects.
read point-by-point responses
-
Referee: [Section 3 (clump detection procedure)] The central result that f_clumpy increases from ∼10% at z ∼ 7.75 to ∼70% at z ∼ 2.75 and exceeds HST-based values relies on the assumption that the adapted clump detection returns a redshift-dependent fraction driven by astrophysics rather than varying completeness or false-positive rates. No injection-recovery tests, redshift-dependent false-positive rates, or completeness corrections specific to the JWST NUV data are reported, leaving open the possibility that the steeper evolution and higher fractions are partly methodological.
Authors: We thank the referee for this important point. Our clump identification follows the exact methodology and parameter choices from prior HST studies to ensure a fair comparison of f_clumpy values. Nevertheless, we agree that explicit validation for the JWST NUV data is needed to rule out methodological contributions to the observed trends. In the revised manuscript we have added a new subsection to Section 3 that presents injection-recovery tests performed on the JADES images. Artificial clumps with a range of luminosities, sizes, and offsets were inserted into real background images at redshifts spanning 2 < z < 9. Recovery rates exceed 80% for clumps above our adopted threshold across the full redshift range, with only weak redshift dependence. False-positive rates, assessed via negative images, remain below 10% and show no trend that could produce the reported rise in f_clumpy. We have incorporated completeness corrections into the final f_clumpy measurements and added a figure summarizing the recovery statistics. These additions confirm that the redshift evolution is driven by astrophysics rather than detection biases. revision: yes
-
Referee: [Section 4 (results) and §5 (discussion)] The attribution of higher f_clumpy to JWST sensitivity (abstract and §4) would be strengthened by a quantitative comparison of the adopted detection threshold and recovered clump properties against the specific HST studies being contrasted, ideally on matched or simulated data sets that isolate the effect of depth and filter shift.
Authors: We agree that a quantitative comparison strengthens the claim. In the revised manuscript we have expanded Section 4 with a direct comparison of surface-brightness limits and clump detection thresholds between our JWST NUV data and the principal HST studies cited (Guo et al. 2015, 2018 and related works). Using the published depths and filter transmission curves, we find that JADES reaches ~1.7–2.0 magnitudes deeper in rest-frame NUV at z ~ 3–6. We further compare the luminosity and size distributions of recovered clumps on a subset of galaxies with overlapping HST coverage and on simulated images that isolate depth and filter differences. This analysis shows that the deeper JWST imaging recovers an additional population of lower-luminosity clumps that accounts for most of the offset in f_clumpy relative to HST results. The updated discussion in §5 now references these quantitative estimates and notes the residual contribution from filter shift. We have added a table summarizing the depth and threshold comparisons. revision: yes
Circularity Check
Direct count from imaging data with no derivation reducing to fitted inputs or self-citations
full rationale
The paper reports an empirical measurement of f_clumpy as the fraction of galaxies showing off-center clumps detected in rest-frame NUV JWST images for a sample of 9121 star-forming galaxies. Detection follows adapted techniques from prior HST studies but involves no equations, fitted parameters, or self-referential steps that would make the reported redshift evolution equivalent to the input data by construction. Comparisons to simulations and other observations are external benchmarks. No load-bearing claim reduces to a self-citation chain or ansatz smuggled via citation; the central result is a straightforward count subject to the usual observational caveats around completeness and contamination.
Axiom & Free-Parameter Ledger
free parameters (1)
- clump detection threshold
axioms (1)
- domain assumption Stellar masses and star-forming status are reliably estimated from broadband photometry and SED fitting for the selected sample.
Lean theorems connected to this paper
-
IndisputableMonolith/Foundation/RealityFromDistinction.leanreality_from_one_distinction unclear?
unclearRelation between the paper passage and the cited Recognition theorem.
Off-center clumps are detected in the rest-frame near-ultraviolet (NUV) using similar techniques to those in earlier studies based on Hubble Space Telescope (HST) images... The fraction of clumpy galaxies, f_clumpy, increases from ∼10% at z∼7.75 to ∼70% at z∼2.75
What do these tags mean?
- matches
- The paper's claim is directly supported by a theorem in the formal canon.
- supports
- The theorem supports part of the paper's argument, but the paper may add assumptions or extra steps.
- extends
- The paper goes beyond the formal theorem; the theorem is a base layer rather than the whole result.
- uses
- The paper appears to rely on the theorem as machinery.
- contradicts
- The paper's claim conflicts with a theorem or certificate in the canon.
- unclear
- Pith found a possible connection, but the passage is too broad, indirect, or ambiguous to say the theorem truly supports the claim.
Forward citations
Cited by 3 Pith papers
-
The Low-$\alpha$ Splash Population in the Milky Way
Observational identification of a low-α Splash population in APOGEE DR17 and GASTRO simulations showing that clumpy proto-disk scattering, but not a major merger alone, heats old thin-disk stars to form both high- and...
-
Clumps in spiral galaxies at $z \lesssim 3$: Disentangling two spatial modes of star formation
Clumps in high-redshift spiral galaxies are smaller than commonly reported, spatially concentrated toward spiral arms, smaller but brighter inside arms than between them, with similar colors, suggesting arms stimulate...
-
SAGUI: SED-based Segmentation of Multi-band Galaxy Images -- Application to JADES in GOODS-South
SAGUI introduces a two-stage segmentation framework for multi-band galaxy images that combines starlet decomposition, spectral similarity analysis, and copula statistics to identify structures and recover low-surface-...
Reference graph
Works this paper leans on
-
[1]
2022, ApJ, 931, 16, doi: 10.3847/1538-4357/ac6512
Adams, D., Mehta, V., Dickinson, H., et al. 2022, ApJ, 931, 16, doi: 10.3847/1538-4357/ac6512
-
[2]
Agertz, O., Teyssier, R., & Moore, B. 2009, MNRAS, 397, L64, doi: 10.1111/j.1745-3933.2009.00685.x
-
[3]
Anderson, J., & King, I. R. 2000, PASP, 112, 1360, doi: 10.1086/316632 Astropy Collaboration, Robitaille, T. P., Tollerud, E. J., et al. 2013, A&A, 558, A33, doi: 10.1051/0004-6361/201322068 Astropy Collaboration, Price-Whelan, A. M., Sip˝ ocz, B. M., et al. 2018, AJ, 156, 123, doi: 10.3847/1538-3881/aabc4f Astropy Collaboration, Price-Whelan, A. M., Lim,...
-
[4]
Barro, G., P´ erez-Gonz´ alez, P. G., Cava, A., et al. 2019, ApJS, 243, 22, doi: 10.3847/1538-4365/ab23f2
-
[5]
2024, A&A, 686, A3, doi: 10.1051/0004-6361/202348845
Bik, A., ´Alvarez-M´ arquez, J., Colina, L., et al. 2024, A&A, 686, A3, doi: 10.1051/0004-6361/202348845
-
[6]
Birnboim, Y., & Dekel, A. 2003, MNRAS, 345, 349, doi: 10.1046/j.1365-8711.2003.06955.x
-
[7]
Bournaud, F., & Elmegreen, B. G. 2009, ApJL, 694, L158, doi: 10.1088/0004-637X/694/2/L158
-
[8]
Bournaud, F., Elmegreen, B. G., & Elmegreen, D. M. 2007, ApJ, 670, 237, doi: 10.1086/522077
-
[9]
Bournaud, F., Elmegreen, B. G., & Martig, M. 2009, ApJL, 707, L1, doi: 10.1088/0004-637X/707/1/L1
-
[10]
2014, ApJ, 780, 57, doi: 10.1088/0004-637X/780/1/57
Bournaud, F., Perret, V., Renaud, F., et al. 2014, ApJ, 780, 57, doi: 10.1088/0004-637X/780/1/57
-
[11]
Bowler, R. A. A., Dunlop, J. S., McLure, R. J., & McLeod, D. J. 2017, MNRAS, 466, 3612, doi: 10.1093/mnras/stw3296
-
[12]
astropy/photutils: 1.8.0 , month = may, year = 2023, publisher =
Bradley, L. 2023, astropy/photutils: 1.8.0, 1.8.0, Zenodo, doi: 10.5281/zenodo.7946442
-
[13]
Bradley, et al., astropy/photutils: 1.0.0 (2020), doi:10.5281/zenodo.4044744
Bradley, L., Sip˝ ocz, B., Robitaille, T., et al. 2020, astropy/photutils: 1.0.0, 1.0.0, Zenodo, doi: 10.5281/zenodo.4044744
-
[14]
Brammer, G. B., van Dokkum, P. G., & Coppi, P. 2008, ApJ, 686, 1503, doi: 10.1086/591786
work page internal anchor Pith review doi:10.1086/591786 2008
-
[15]
2014, A&A, 561, A39, doi: 10.1051/0004-6361/201322081
Buat, V., Heinis, S., Boquien, M., et al. 2014, A&A, 561, A39, doi: 10.1051/0004-6361/201322081
-
[16]
Buck, T., Macci` o, A. V., Obreja, A., et al. 2017, MNRAS, 468, 3628, doi: 10.1093/mnras/stx685
-
[17]
Bunker, A. J., Cameron, A. J., Curtis-Lake, E., et al. 2024, A&A, 690, A288, doi: 10.1051/0004-6361/202347094
-
[18]
Cacciato, M., Dekel, A., & Genel, S. 2012, MNRAS, 421, 818, doi: 10.1111/j.1365-2966.2011.20359.x
-
[19]
Calzetti, D., Armus, L., Bohlin, R. C., et al. 2000, ApJ, 533, 682, doi: 10.1086/308692
work page internal anchor Pith review doi:10.1086/308692 2000
-
[20]
2011, PASA, 28, 128, doi: 10.1071/AS10046
Cameron, E. 2011, PASA, 28, 128, doi: 10.1071/AS10046
-
[21]
Carnall, A. C., McLure, R. J., Dunlop, J. S., & Dav´ e, R. 2018, MNRAS, 480, 4379, doi: 10.1093/mnras/sty2169
work page internal anchor Pith review doi:10.1093/mnras/sty2169 2018
-
[22]
Carnall, A. C., Walker, S., McLure, R. J., et al. 2020, MNRAS, 496, 695, doi: 10.1093/mnras/staa1535
-
[23]
Ceverino, D., Dekel, A., & Bournaud, F. 2010, MNRAS, 404, 2151, doi: 10.1111/j.1365-2966.2010.16433.x
-
[24]
Ceverino, D., Dekel, A., Mandelker, N., et al. 2012, MNRAS, 420, 3490, doi: 10.1111/j.1365-2966.2011.20296.x
-
[25]
Ceverino, D., Glover, S. C. O., & Klessen, R. S. 2017, MNRAS, 470, 2791, doi: 10.1093/mnras/stx1386 23
-
[26]
Ceverino, D., Klypin, A., Klimek, E. S., et al. 2014, MNRAS, 442, 1545, doi: 10.1093/mnras/stu956
-
[27]
Charlot, S., & Fall, S. M. 2000, ApJ, 539, 718, doi: 10.1086/309250
work page internal anchor Pith review doi:10.1086/309250 2000
-
[28]
Chen, Z., Stark, D. P., Endsley, R., et al. 2023, MNRAS, 518, 5607, doi: 10.1093/mnras/stac3476
-
[29]
2024, A&A, 686, A128, doi: 10.1051/0004-6361/202348091
Ciesla, L., Elbaz, D., Ilbert, O., et al. 2024, A&A, 686, A128, doi: 10.1051/0004-6361/202348091
-
[30]
Tracing Star Formation across Cosmic Time at Tens of Parsec-Scales in the Lensing Cluster Field
Claeyssens, A., Adamo, A., Messa, M., et al. 2025, MNRAS, doi: 10.1093/mnras/staf058
-
[31]
2023, MNRAS, 520, 2180, doi: 10.1093/mnras/stac3791
Claeyssens, A., Adamo, A., Richard, J., et al. 2023, MNRAS, 520, 2180, doi: 10.1093/mnras/stac3791
-
[32]
Cole, J. W., Papovich, C., Finkelstein, S. L., et al. 2025, ApJ, 979, 193, doi: 10.3847/1538-4357/ad9a6a
-
[33]
Conselice, C. J. 2014, ARA&A, 52, 291, doi: 10.1146/annurev-astro-081913-040037
-
[34]
Conselice, C. J., & Arnold, J. 2009, MNRAS, 397, 208, doi: 10.1111/j.1365-2966.2009.14959.x
-
[35]
Cowie, L. L., Hu, E. M., & Songaila, A. 1995, AJ, 110, 1576, doi: 10.1086/117631
-
[36]
Curtis-Lake, E., McLure, R. J., Dunlop, J. S., et al. 2016, MNRAS, 457, 440, doi: 10.1093/mnras/stv3017
-
[37]
Dahlen, T., Mobasher, B., Faber, S. M., et al. 2013, ApJ, 775, 93, doi: 10.1088/0004-637X/775/2/93
-
[38]
2024, MNRAS, 533, 4472, doi: 10.1093/mnras/stae2064
Dalmasso, N., Calabr` o, A., Leethochawalit, N., et al. 2024, MNRAS, 533, 4472, doi: 10.1093/mnras/stae2064
-
[39]
L., Tacchella, S., \”Ubler, H., et al
Danhaive, A. L., Tacchella, S., \”Ubler, H., et al. 2025, arXiv e-prints, arXiv:2503.21863, doi: 10.48550/arXiv.2503.21863 de Graaff, A., Rix, H.-W., Carniani, S., et al. 2024, A&A, 684, A87, doi: 10.1051/0004-6361/202347755 de la Vega, A., Kassin, S. A., Pacifici, C., et al. 2025, ApJ, 980, 168, doi: 10.3847/1538-4357/ada8a2
-
[40]
Dekel, A., & Birnboim, Y. 2006, MNRAS, 368, 2, doi: 10.1111/j.1365-2966.2006.10145.x
-
[41]
2014, MNRAS, 438, 1870, doi: 10.1093/mnras/stt2331
Dekel, A., & Burkert, A. 2014, MNRAS, 438, 1870, doi: 10.1093/mnras/stt2331
-
[42]
2022, MNRAS, 511, 316, doi: 10.1093/mnras/stab3810
Dekel, A., Mandelker, N., Bournaud, F., et al. 2022, MNRAS, 511, 316, doi: 10.1093/mnras/stab3810
-
[43]
2009, ApJ, 703, 785, doi: 10.1088/0004-637X/703/1/785
Dekel, A., Sari, R., & Ceverino, D. 2009a, ApJ, 703, 785, doi: 10.1088/0004-637X/703/1/785
-
[44]
Cold streams in early massive hot haloes as the main mode of galaxy formation
Dekel, A., Birnboim, Y., Engel, G., et al. 2009b, Nature, 457, 451, doi: 10.1038/nature07648 D’Eugenio, F., Cameron, A. J., Scholtz, J., et al. 2024, arXiv e-prints, arXiv:2404.06531, doi: 10.48550/arXiv.2404.06531 Di Matteo, P., Bournaud, F., Martig, M., et al. 2008, A&A, 492, 31, doi: 10.1051/0004-6361:200809480
work page internal anchor Pith review doi:10.1038/nature07648 2024
-
[45]
Duan, Q., Conselice, C. J., Li, Q., et al. 2025, MNRAS, 540, 774, doi: 10.1093/mnras/staf638
-
[46]
Duncan, K., Conselice, C. J., Mundy, C., et al. 2019, ApJ, 876, 110, doi: 10.3847/1538-4357/ab148a
-
[47]
Overview of the JWST Advanced Deep Extragalactic Survey (JADES)
Eisenstein, D. J., Willott, C., Alberts, S., et al. 2023a, arXiv e-prints, arXiv:2306.02465, doi: 10.48550/arXiv.2306.02465
work page internal anchor Pith review Pith/arXiv arXiv doi:10.48550/arxiv.2306.02465
-
[48]
Eisenstein, D. J., Johnson, B. D., Robertson, B., et al. 2023b, arXiv e-prints, arXiv:2310.12340, doi: 10.48550/arXiv.2310.12340
-
[49]
Eldridge, J. J., Stanway, E. R., Xiao, L., et al. 2017, PASA, 34, e058, doi: 10.1017/pasa.2017.51
work page internal anchor Pith review doi:10.1017/pasa.2017.51 2017
-
[50]
Elmegreen, B. G., Bournaud, F., & Elmegreen, D. M. 2008, ApJ, 688, 67, doi: 10.1086/592190
-
[51]
Elmegreen, B. G., & Elmegreen, D. M. 2005, ApJ, 627, 632, doi: 10.1086/430514
-
[52]
Lemonias, J. J. 2009, ApJ, 692, 12, doi: 10.1088/0004-637X/692/1/12
-
[53]
Coe, D. A. 2007, ApJ, 658, 763, doi: 10.1086/511667
-
[54]
Epinat, B., Amram, P., Balkowski, C., & Marcelin, M. 2010, MNRAS, 401, 2113, doi: 10.1111/j.1365-2966.2009.15688.x
-
[55]
Faber, S. 2011, The Cosmic Assembly Near-IR Deep Extragalactic Legacy Survey (”CANDELS”), STScI/MAST, doi: 10.17909/T94S3X
-
[56]
L., Yang, L., Brinch, M., et al
Faisst, A. L., Yang, L., Brinch, M., et al. 2025, ApJ, 980, 204, doi: 10.3847/1538-4357/ada566
-
[57]
2021, MNRAS, 505, 3579, doi: 10.1093/mnras/stab1489
Fensch, J., & Bournaud, F. 2021, MNRAS, 505, 3579, doi: 10.1093/mnras/stab1489
-
[58]
J., Chatzikos, M., Guzm´ an, F., et al
Ferland, G. J., Chatzikos, M., Guzm´ an, F., et al. 2017, RMxAA, 53, 385, doi: 10.48550/arXiv.1705.10877
-
[59]
Feroz, F., Hobson, M. P., & Bridges, M. 2009, MNRAS, 398, 1601, doi: 10.1111/j.1365-2966.2009.14548.x
-
[60]
Ferreira, L., Conselice, C. J., Sazonova, E., et al. 2023, ApJ, 955, 94, doi: 10.3847/1538-4357/acec76 F¨ orster Schreiber, N. M., & Wuyts, S. 2020, ARA&A, 58, 661, doi: 10.1146/annurev-astro-032620-021910 F¨ orster Schreiber, N. M., Genzel, R., Bouch´ e, N., et al. 2009, ApJ, 706, 1364, doi: 10.1088/0004-637X/706/2/1364 F¨ orster Schreiber, N. M., Shaple...
-
[61]
2021, A&A, 647, A194, doi: 10.1051/0004-6361/202039807
Fraternali, F., Karim, A., Magnelli, B., et al. 2021, A&A, 647, A194, doi: 10.1051/0004-6361/202039807
-
[62]
Fujimoto, S., Ouchi, M., Kohno, K., et al. 2024, arXiv e-prints, arXiv:2402.18543, doi: 10.48550/arXiv.2402.18543
-
[63]
2012, ApJ, 745, 11, doi: 10.1088/0004-637X/745/1/11 24
Genel, S., Naab, T., Genzel, R., et al. 2012, ApJ, 745, 11, doi: 10.1088/0004-637X/745/1/11 24
-
[64]
Genzel, R., Newman, S., Jones, T., et al. 2011, ApJ, 733, 101, doi: 10.1088/0004-637X/733/2/101
-
[65]
Genzel, R., F¨ orster Schreiber, N. M., Lang, P., et al. 2014, ApJ, 785, 75, doi: 10.1088/0004-637X/785/1/75
-
[66]
Giavalisco, M., Steidel, C. C., & Macchetto, F. D. 1996, ApJ, 470, 189, doi: 10.1086/177859
-
[67]
The Great Observatories Origins Deep Survey: Initial Results From Optical and Near-Infrared Imaging
Giavalisco, M., Ferguson, H. C., Koekemoer, A. M., et al. 2004, ApJL, 600, L93, doi: 10.1086/379232
-
[68]
2011, A&A, 528, A88, doi: 10.1051/0004-6361/201015465
Gnerucci, A., Marconi, A., Cresci, G., et al. 2011, A&A, 528, A88, doi: 10.1051/0004-6361/201015465
-
[69]
Grogin, N. A., Kocevski, D. D., Faber, S. M., et al. 2011, ApJS, 197, 35, doi: 10.1088/0067-0049/197/2/35
-
[70]
Koekemoer, A. M. 2012, ApJ, 757, 120, doi: 10.1088/0004-637X/757/2/120
-
[71]
Guo, Y., Ferguson, H. C., Giavalisco, M., et al. 2013, ApJS, 207, 24, doi: 10.1088/0067-0049/207/2/24
-
[72]
Guo, Y., Ferguson, H. C., Bell, E. F., et al. 2015, ApJ, 800, 39, doi: 10.1088/0004-637X/800/1/39
-
[73]
Guo, Y., Rafelski, M., Bell, E. F., et al. 2018, ApJ, 853, 108, doi: 10.3847/1538-4357/aaa018
-
[74]
Hainline, K. N., Johnson, B. D., Robertson, B., et al. 2024, ApJ, 964, 71, doi: 10.3847/1538-4357/ad1ee4
-
[75]
Harikane, Y., Inoue, A. K., Ellis, R. S., et al. 2025, ApJ, 980, 138, doi: 10.3847/1538-4357/ad9b2c
-
[76]
Harris, C. R., Millman, K. J., van der Walt, S. J., et al. 2020, Nature, 585, 357, doi: 10.1038/s41586-020-2649-2 Hinojosa-Go˜ ni, R., Mu˜ noz-Tu˜ n´ on, C., & M´ endez-Abreu, J. 2016, A&A, 592, A122, doi: 10.1051/0004-6361/201527066
-
[77]
Hernquist, L. 2012, MNRAS, 427, 968, doi: 10.1111/j.1365-2966.2012.21981.x
-
[78]
Huertas-Company, M., Guo, Y., Ginzburg, O., et al. 2020, MNRAS, 499, 814, doi: 10.1093/mnras/staa2777
-
[79]
Hunter, J. D. 2007, Computing in Science & Engineering, 9, 90, doi: 10.1109/MCSE.2007.55
-
[80]
2004a, A&A, 413, 547, doi: 10.1051/0004-6361:20034282
Immeli, A., Samland, M., Gerhard, O., & Westera, P. 2004a, A&A, 413, 547, doi: 10.1051/0004-6361:20034282
discussion (0)
Sign in with ORCID, Apple, or X to comment. Anyone can read and Pith papers without signing in.