TopoAlign: Topology-Aware Visual Representation Alignment
Pith reviewed 2026-06-29 19:37 UTC · model grok-4.3
The pith
TopoAlign aligns model representations by jointly optimizing mapper graphs from topological data analysis.
A machine-rendered reading of the paper's core claim, the machinery that carries it, and where it could break.
Core claim
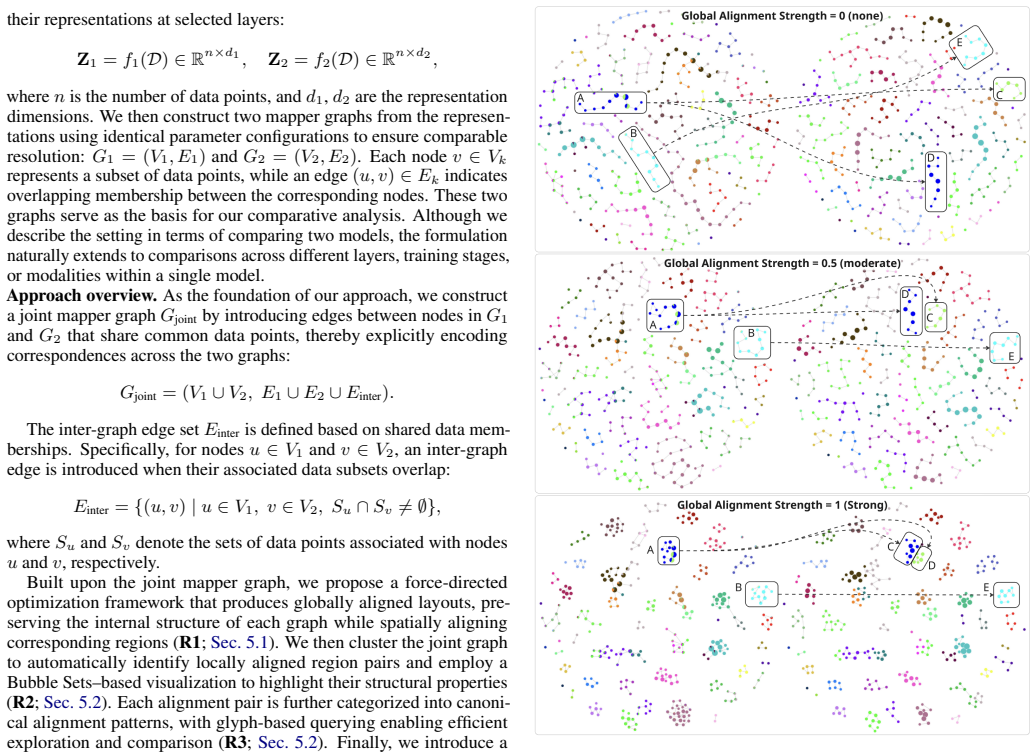
The central discovery is that joint force-directed optimization on mapper graphs from representations of shared inputs produces coordinated layouts that enable detection of structurally matching regions across models or layers, providing topological insights into representation alignment.
What carries the argument
Mapper graphs from topological data analysis that are jointly optimized with force-directed layout to align global structures and reveal correspondences.
Load-bearing premise
The mapper graphs preserve enough of the true global structure in the representations to make the joint optimization meaningful for finding real correspondences.
What would settle it
A test where models with known alignment levels from other metrics are compared and the TopoAlign correspondences either match or fail to match those levels.
Figures

read the original abstract
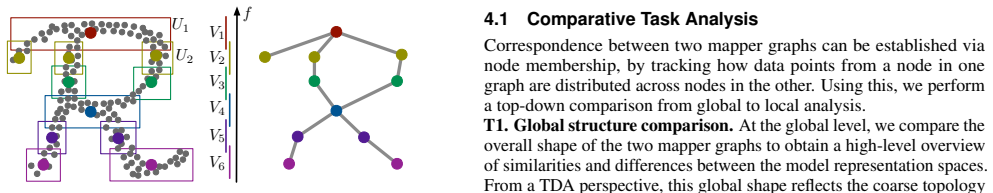
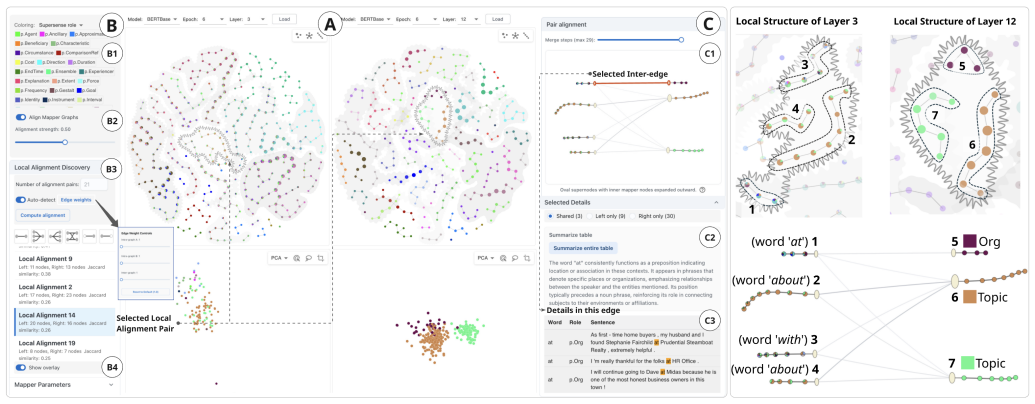
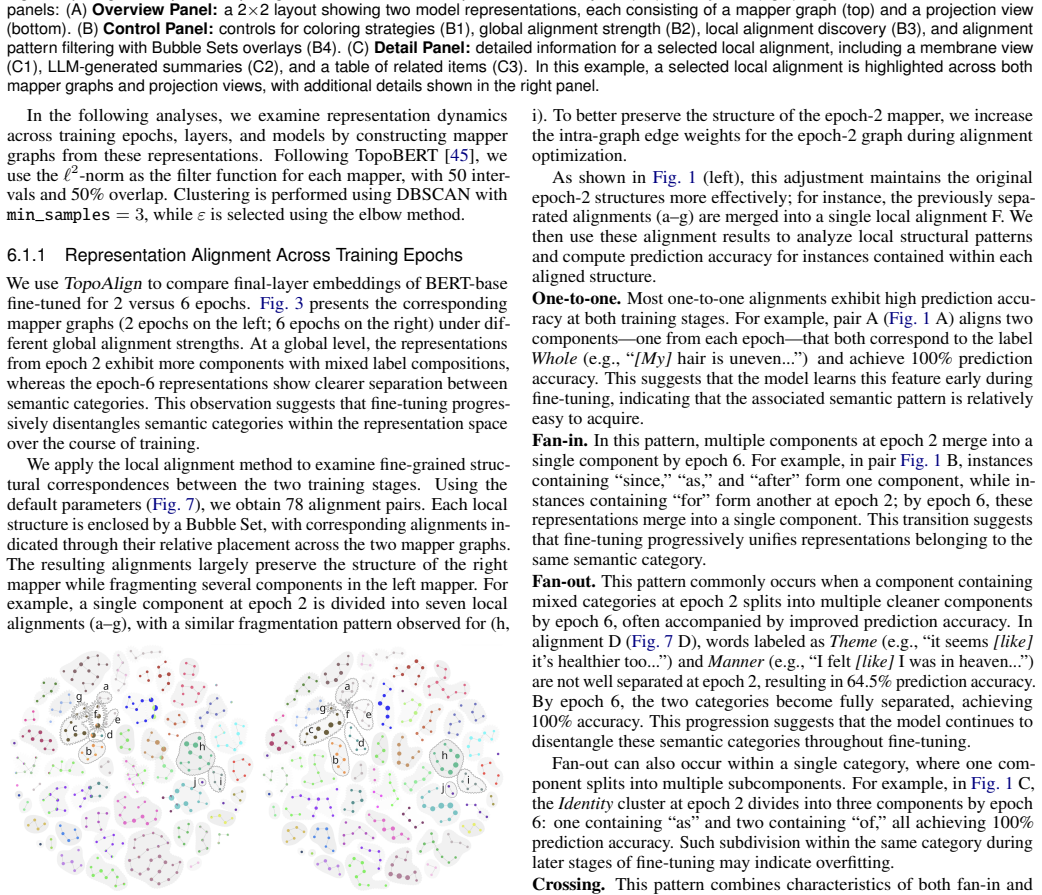
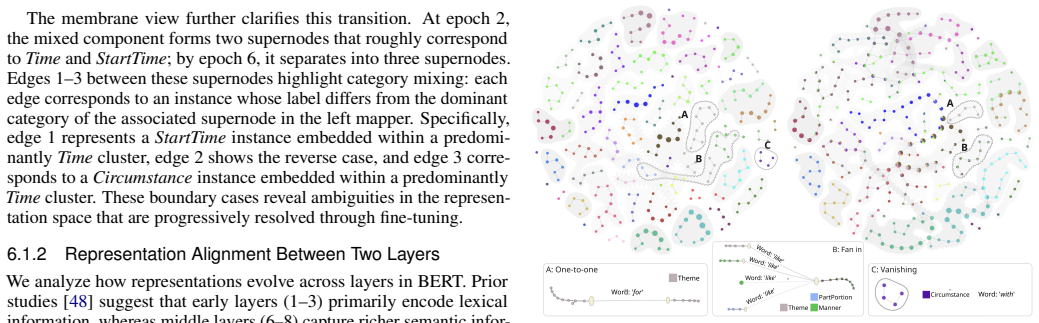
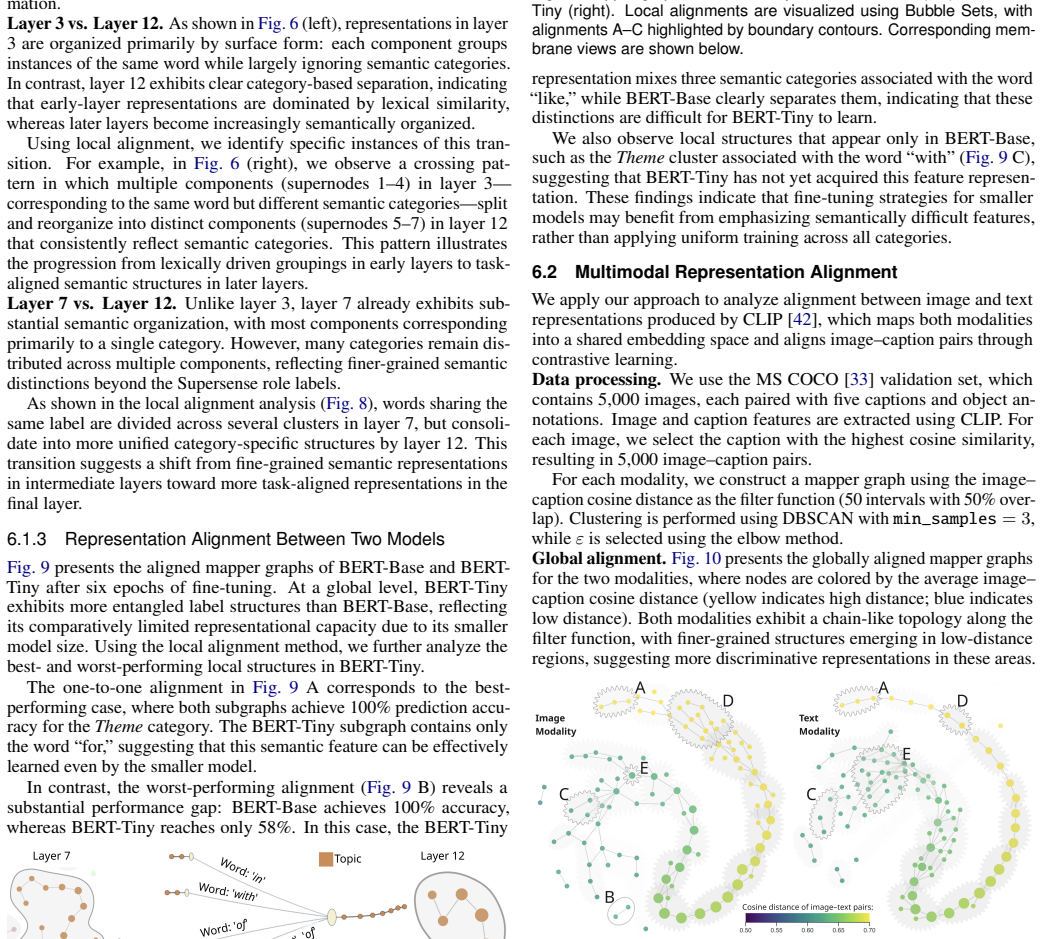
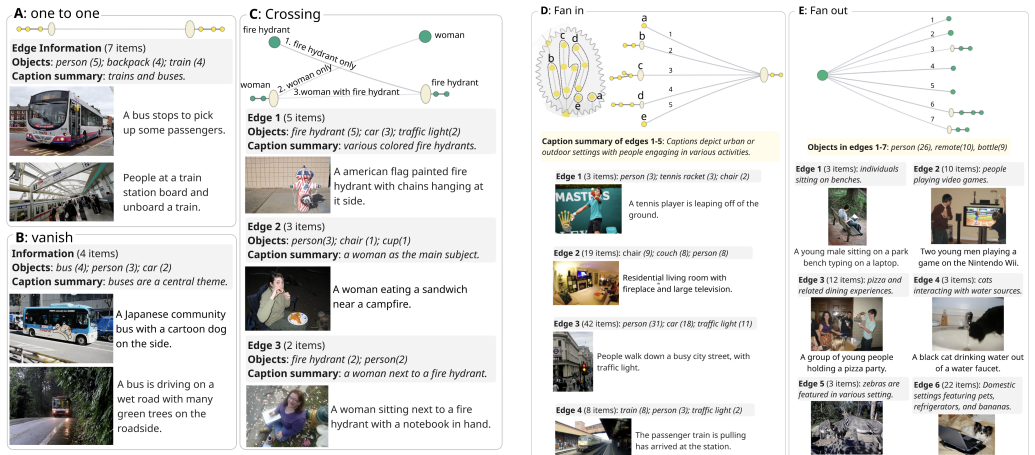
Neural networks encode inputs as high-dimensional vectors, known as representations, that capture how models process data by encoding task-relevant structure and semantics. Representation alignment refers to the degree to which different models, layers, or training conditions produce similar representations for the same inputs, with important implications for model interpretation, selection, and robustness analysis. Existing approaches to measure alignment primarily rely on geometric properties, such as neighborhood and cluster similarity, offering limited insight into the global organization of representations. In this work, we present TopoAlign, a topology-aware framework for visually comparing model representations from a structural perspective. Leveraging mapper graphs from topological data analysis, TopoAlign jointly analyzes graphs constructed from representations of shared inputs across different models or layers. The framework supports a top-down comparative workflow: it first performs global structure alignment via joint force-directed optimization to produce coordinated graph layouts; it then identifies local correspondences through automated detection of structurally matching regions, visualized with Bubble Sets; and finally it enables fine-grained pattern inspection through motif-based queries and membrane-inspired visualizations. We demonstrate TopoAlign through case studies on language and multimodal models, complemented by expert feedback. Our results show that TopoAlign provides meaningful insights into representation structure and alignment from a topological perspective.
Editorial analysis
A structured set of objections, weighed in public.
Referee Report
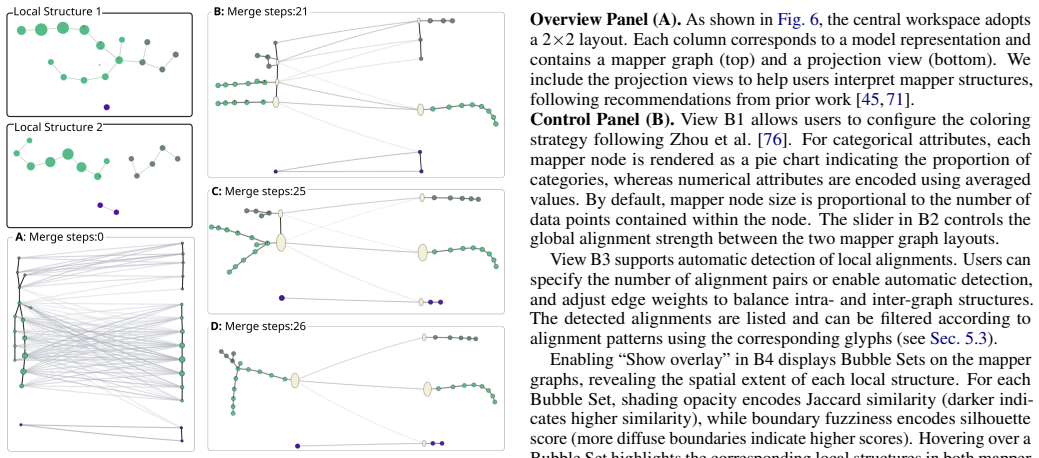
Summary. The paper introduces TopoAlign, a topology-aware visual framework for comparing neural network representations. It constructs mapper graphs from representations of shared inputs across models or layers, applies joint force-directed optimization to produce coordinated layouts, detects matching regions via Bubble Sets, and supports motif queries with membrane visualizations. The approach is demonstrated through qualitative case studies on language and multimodal models plus expert feedback, with the central claim that it yields meaningful insights into representation structure and alignment from a topological perspective.
Significance. If the layouts and detected correspondences can be shown to recover genuine cross-model topological structure rather than optimization artifacts, the work would offer a useful structural complement to existing geometric alignment measures (e.g., CKA, RSA) for interpretability and model selection tasks. The mapper-graph plus coordinated-layout pipeline is a plausible extension of TDA tools, but the current qualitative-only evidence limits assessed significance.
major comments (2)
- [Abstract] Abstract (top-down workflow paragraph): the claim that joint force-directed optimization on mapper graphs produces coordinated layouts reflecting true cross-model correspondences is load-bearing for all subsequent insights, yet the manuscript supplies no quantitative validation (e.g., correlation with known layer-wise similarities, transfer-task alignment scores, or comparison to geometric baselines) that the optimized node positions or Bubble-Set overlaps recover ground-truth structure.
- [Case studies] Case studies section: expert feedback and visual inspection are presented as evidence of 'meaningful insights,' but without reported metrics such as region-overlap precision, motif-recovery rates against synthetic correspondences, or inter-rater agreement on alignment quality, it remains unclear whether the detected matches exceed what random or purely geometric layouts would produce.
minor comments (2)
- [Methods] Notation for mapper-graph parameters (e.g., cover resolution, clustering linkage) should be defined explicitly in the methods section to allow reproducibility.
- [Figures] Figure captions for the coordinated layouts and Bubble Sets should state the exact force-directed parameters and overlap thresholds used.
Simulated Author's Rebuttal
We thank the referee for the constructive comments on our manuscript. We address each major comment below.
read point-by-point responses
-
Referee: [Abstract] Abstract (top-down workflow paragraph): the claim that joint force-directed optimization on mapper graphs produces coordinated layouts reflecting true cross-model correspondences is load-bearing for all subsequent insights, yet the manuscript supplies no quantitative validation (e.g., correlation with known layer-wise similarities, transfer-task alignment scores, or comparison to geometric baselines) that the optimized node positions or Bubble-Set overlaps recover ground-truth structure.
Authors: TopoAlign is presented as an exploratory visual analytics framework rather than a quantitative alignment metric. The joint force-directed layout is a heuristic to support visual coordination of mapper graphs, and the detected correspondences are based on structural similarity within those graphs. We will revise the abstract to clarify the interpretive and visual nature of the claims and add an explicit limitations paragraph noting the absence of quantitative validation against geometric baselines such as CKA. This is a partial revision that preserves the qualitative focus while addressing the concern directly. revision: partial
-
Referee: [Case studies] Case studies section: expert feedback and visual inspection are presented as evidence of 'meaningful insights,' but without reported metrics such as region-overlap precision, motif-recovery rates against synthetic correspondences, or inter-rater agreement on alignment quality, it remains unclear whether the detected matches exceed what random or purely geometric layouts would produce.
Authors: We agree that the evaluation is qualitative. In visualization and TDA research, case studies combined with expert feedback constitute standard evidence of utility when the goal is to demonstrate novel visual workflows. We will expand the case-studies section with additional detail on the feedback protocol and further examples. Introducing quantitative metrics would require defining synthetic ground truth or new user studies, which we will acknowledge as future work rather than add to the current manuscript. revision: partial
Circularity Check
No circularity: standard TDA and layout methods applied to new domain
full rationale
The paper introduces TopoAlign as a workflow applying mapper graphs (standard TDA), joint force-directed optimization (standard graph layout), Bubble Sets, and motif queries to compare neural representations. No equations, fitted parameters, or derived predictions appear that reduce by construction to the inputs or to self-citations. The central claims rest on qualitative case studies using these off-the-shelf techniques rather than any self-referential derivation or uniqueness theorem imported from the authors' prior work. Self-citations, if present, are not load-bearing for the method's validity. This is a methodological application paper whose derivation chain is self-contained against external benchmarks.
Axiom & Free-Parameter Ledger
axioms (1)
- domain assumption Mapper graphs from topological data analysis capture the global organization of high-dimensional representations
Reference graph
Works this paper leans on
-
[1]
C. C. Aggarwal and H. Wang. A survey of clustering algorithms for graph data. In C. C. Aggarwal and H. Wang, eds.,Managing and Mining Graph Data, pp. 275–301. Springer US, Boston, MA, 2010. doi: 10.1007/978-1 -4419-6045-0_95
-
[2]
Alagappan
M. Alagappan. From 5 to 13: Redefining the positions in basketball.MIT Sloan Sports Analytics Conference, 2012. 2
2012
-
[3]
D. L. Arendt, N. Nur, Z. Huang, G. Fair, and W. Dou. Parallel embed- dings: a visualization technique for contrasting learned representations. In Proceedings of the 25th International Conference on Intelligent User In- terfaces, pp. 259–274. Association for Computing Machinery, New York, NY , USA, 2020. doi:10.1145/3377325.33775141, 2
-
[4]
Atakishiyev, M
S. Atakishiyev, M. Salameh, H. Yao, and R. Goebel. Explainable artificial intelligence for autonomous driving: A comprehensive overview and field guide for future research directions.IEEE Access, 12:101603–101625,
-
[5]
doi:10.1109/ACCESS.2024.34314371
-
[6]
A. Boggust, B. Carter, and A. Satyanarayan. Embedding Comparator: Visualizing differences in global structure and local neighborhoods via small multiples. InProceedings of the 27th International Conference on Intelligent User Interfaces, pp. 746–766. Association for Computing Machinery, New York, NY , USA, 2022. doi:10.1145/3490099.3511122 1, 2, 6
-
[7]
Carlsson
G. Carlsson. Topology and data.Bulletin of The American Mathematical Society - BULL AMER MATH SOC, 46:255–308, 04 2009. doi: 10.1090/ S0273-0979-09-01249-X1, 3, 5
2009
-
[8]
S. H. Cheong and Y . W. Si. Force-directed algorithms for schematic drawings and placement: A survey.Information Visualization, 19:147387161882174, 01 2019. doi:10.1177/14738716188217403
-
[9]
C. Collins, G. Penn, and S. Carpendale. Bubble Sets: Revealing set relations with isocontours over existing visualizations.IEEE Transactions on Visualization and Computer Graphics, 15(6):1009–1016, 2009. doi: 10. 1109/TVCG.2009.1225
-
[10]
J. Devlin, M. Chang, K. Lee, and K. Toutanova. BERT: pre-training of deep bidirectional transformers for language understanding. InProceedings of the 2019 Conference of the North American Chapter of the Association for Computational Linguistics: Human Language Technologies, Volume 1 (Long and Short Papers), pp. 4171–4186. Association for Computational Lin...
-
[11]
Ding, J.-S
F. Ding, J.-S. Denain, and J. Steinhardt. Grounding representation similar- ity through statistical testing.Advances in Neural Information Processing Systems, 34:1556–1568, 2021. 2
2021
-
[12]
B. Doppalapudi, B. Wang, and P. Rosen. Untangling force-directed layouts using persistent homology. In2022 Topological Data Analysis and Visual- ization (TopoInVis), pp. 81–91. IEEE, 2022. doi: 10.1109/T opoInVis57755. 2022.000153
work page doi:10.1109/t 2022
-
[13]
S. Edamadaka, S. Yang, and R. Gomez-Bombarelli. Universally con- verging representations of matter across scientific foundation models. In UniReps: 3rd Edition of the Workshop on Unifying Representations in Neural Models, 2025. doi:10.48550/arXiv.2512.037502
-
[14]
Ester, J
M. Ester, J. Sander, and X. Xu. A density-based algorithm for discovering clusters in large spatial databases with noise. InProceedings of the 2nd International Conference on Knowledge Discovery and Data Mining, vol. 96, pp. 226–231, 1996. 3
1996
-
[15]
T. M. J. Fruchterman and E. M. Reingold. Graph drawing by force-directed placement.Software: Practice and Experience, 21(11):1129–1164, 1991. doi:10.1002/spe.43802111023
-
[16]
Geniesse, O
C. Geniesse, O. Sporns, G. Petri, and M. Saggar. Generating dynami- cal neuroimaging spatiotemporal representations (DyNeuSR) using topo- logical data analysis.Network Neuroscience, 3(3), 2019. doi: 10.1162/ netn_a_000932
2019
-
[17]
M. Gleicher, D. Albers, R. Walker, I. Jusufi, C. D. Hansen, and J. C. Roberts. Visual comparison for information visualization.Information Visualization, 10(4):289–309, 2011. doi:10.1177/14738716114165493
-
[18]
J. Görtler, C. Schulz, D. Weiskopf, and O. Deussen. Bubble treemaps for uncertainty visualization.IEEE Transactions on Visualization and Computer Graphics, 24(1):719–728, 2018. doi:10.1109/TVCG.2017.2743959 5
-
[19]
Gwilliam and A
M. Gwilliam and A. Shrivastava. Beyond supervised vs. unsupervised: Representative benchmarking and analysis of image representation learn- ing. InProceedings of the IEEE/CVF conference on computer vision and pattern recognition, pp. 9642–9652, 2022. 1, 2
2022
-
[20]
F. Heimerl, C. Kralj, T. Moller, and M. Gleicher. embComp: Visual interactive comparison of vector embeddings.IEEE Transactions on Visualization and Computer Graphics, 28(8):2953–2969, 2020. doi: 10. 1109/TVCG.2020.30459181, 2
-
[21]
A. Hryniowski and A. Wong. Inter-layer information similarity assessment of deep neural networks via topological similarity and persistence analysis of data neighbour dynamics.arXiv preprint arXiv:2012.03793, 2020. 2
-
[22]
Y . Hu. Efficient, high-quality force-directed graph drawing.The Mathe- matica journal, 10:37–71, 2006. 3
2006
-
[23]
R. Jeitziner, M. Carriére, J. Rougemont, S. Oudot, K. Hess, and C. Brisken. Two-tier mapper, an unbiased topology-based clustering method for en- hanced global gene expression analysis.Bioinformatics, 35(18):3339– 3347, 2019. doi:10.1093/bioinformatics/btz0522
-
[24]
X. Jiao, Y . Yin, L. Shang, X. Jiang, X. Chen, L. Li et al. TinyBERT: Distilling BERT for natural language understanding. In T. Cohn, Y . He, and Y . Liu, eds.,Findings of the Association for Computational Linguistics: EMNLP 2020, pp. 4163–4174. Association for Computational Linguistics, Online, Nov. 2020. doi:10.18653/v1/2020.findings-emnlp.3726
-
[25]
H. T. Jones, J. M. Springer, G. T. Kenyon, and J. S. Moore. If you’ve trained one you’ve trained them all: inter-architecture similarity increases with robustness. In J. Cussens and K. Zhang, eds.,Proceedings of the Thirty-Eighth Conference on Uncertainty in Artificial Intelligence, vol. 180 ofProceedings of Machine Learning Research, pp. 928–937. PMLR, 0...
2022
-
[26]
Kamada and S
T. Kamada and S. Kawai. An algorithm for drawing general undirected graphs.Information Processing Letters, 31(1):7–15, 1989. doi: 10.1016/ 0020-0190(89)90102-63
1989
-
[27]
M. Klabunde, T. Schumacher, M. Strohmaier, and F. Lemmerich. Similar- ity of neural network models: A survey of functional and representational measures.ACM Computing Surveys, 57(9), 2025. doi: 10.1145/3728458 1, 2, 10
-
[28]
Klabunde, T
M. Klabunde, T. Wald, T. Schumacher, K. Maier-Hein, M. Strohmaier, and F. Lemmerich. ReSi: A comprehensive benchmark for representa- tional similarity measures. InThe Thirteenth International Conference on Learning Representations, 2025. 1, 2
2025
-
[29]
A. Knudson, F. González-Casabianca, A. Feged-Rivadeneira, M. F. Pe- dreros, S. Aponte, A. Olaya et al. Spatio-temporal dynamics of plasmod- ium falciparum transmission within a spatial unit on the colombian pacific coast.Scientific Reports, 10(3756), 2020. doi: 10.1038/s41598-020-60676-1 2
-
[30]
Kornblith, M
S. Kornblith, M. Norouzi, H. Lee, and G. Hinton. Similarity of neural network representations revisited. InInternational conference on machine learning, pp. 3519–3529. PMlR, 2019. 2
2019
-
[31]
N. Kriegeskorte, M. Mur, and P. A. Bandettini. Representational similarity analysis-connecting the branches of systems neuroscience.Frontiers in systems neuroscience, 2:249, 2008. doi:10.3389/neuro.06.004.20081, 2
-
[32]
J. Lee, S. Yu, Y . Jang, S. S. Woo, and J. Jo. Unlearning Comparator: A visual analytics system for comparative evaluation of machine unlearning methods.IEEE Transactions on Visualization and Computer Graphics, 32(3):2852–2867, 2026. doi:10.1109/TVCG.2026.36583252
-
[33]
Q. Li, K. S. Njotoprawiro, H. Haleem, Q. Chen, C. Yi, and X. Ma. Embed- dingVis: A visual analytics approach to comparative network embedding inspection. In2018 IEEE Conference on Visual Analytics Science and Tech- nology (VAST), pp. 48–59. IEEE, 2018. doi: 10.1109/VAST.2018.8802454 2
-
[34]
T.-Y . Lin, M. Maire, S. Belongie, J. Hays, P. Perona, D. Ramanan et al. Microsoft COCO: Common objects in context. InEuropean conference on computer vision, pp. 740–755. Springer, 2014. doi: 10.1007/978-3-319 -10602-1_488
-
[35]
J. C. Mathews, S. Nadeem, A. J. Levine, M. Pouryahya, J. O. Deasy, and A. Tannenbaum. Robust and interpretable PAM50 reclassification exhibits survival advantage for myoepithelial and immune phenotypes.NPJ Breast Cancer, 5(30), 2019. doi:10.1038/s41523-019-0124-82
-
[36]
J. Mehrer, N. Kriegeskorte, and T. Kietzmann. Beware of the beginnings: intermediate and higherlevel representations in deep neural networks are strongly affected by weight initialization. InConference on Cognitive Computational Neuroscience, 2018. doi:10.32470/CCN.2018.1172-01, 2
-
[37]
A. S. Morcos, M. Raghu, and S. Bengio. Insights on representational similarity in neural networks with canonical correlation. InProceedings of the 32nd International Conference on Neural Information Processing Systems, NIPS’18, pp. 5732–5741. Curran Associates Inc., Red Hook, NY , USA, 2018. 1, 2
2018
-
[38]
Nanda, T
V . Nanda, T. Speicher, C. Kolling, J. P. Dickerson, K. Gummadi, and A. Weller. Measuring representational robustness of neural networks through shared invariances. InInternational Conference on Machine Learning, pp. 16368–16382. PMLR, 2022. 1, 2
2022
-
[39]
Nguyen, M
T. Nguyen, M. Raghu, and S. Kornblith. Do wide and deep networks learn the same things? uncovering how neural network representations vary with width and depth. InInternational Conference on Learning Representations, 2021. 1, 2
2021
-
[40]
M. Nicolau, A. J. Levine, and G. Carlsson. Topology based data analysis identifies a subgroup of breast cancers with a unique mutational profile and excellent survival.Proceedings of the National Academy of Sciences, 108(17):7265–7270, 2011. doi:10.1073/pnas.11028261082
-
[41]
A. Patania, F. Vaccarino, and G. Petri. Topological analysis of data.EPJ Data Science, 6(7), 2017. doi:10.1140/epjds/s13688-017-0104-x2
-
[42]
E. Purvine, D. Brown, B. Jefferson, C. Joslyn, B. Praggastis, A. Rathore et al. Experimental observations of the topology of convolutional neural network activations.Proceedings of the AAAI Conference on Artificial Intelligence, 37(8):9470–9479, 2023. doi:10.1609/aaai.v37i8.261341, 2
-
[43]
Radford, J
A. Radford, J. W. Kim, C. Hallacy, A. Ramesh, G. Goh, S. Agarwal et al. Learning transferable visual models from natural language supervision. InInternational conference on machine learning, pp. 8748–8763. PMLR,
-
[44]
N. Rair, A. Goupil, V . Vrabie, and E. Chochoy. When annotators disagree, topology explains: Mapper, a topological tool for exploring text embed- ding geometry and ambiguity. InProceedings of the 2025 Conference on Empirical Methods in Natural Language Processing, pp. 8468–8491,
2025
-
[45]
doi:10.18653/v1/2025.emnlp-main.4261, 2, 3
-
[46]
A. Rathore, N. Chalapathi, S. Palande, and B. Wang. TopoAct: Visually exploring the shape of activations in deep learning.Computer Graphics Forum, 40(1):382–397, 2021. doi:10.1111/cgf.141951, 2, 3
-
[47]
A. Rathore, Y . Zhou, V . Srikumar, and B. Wang. TopoBERT: Exploring the topology of fine-tuned word representations.Information Visualization, 22(3):186–208, 2023. doi:10.1177/147387162311686711, 2, 3, 6, 7
-
[48]
C. K. Reddy and P. Shojaee. Towards scientific discovery with generative ai: Progress, opportunities, and challenges.Proceedings of the AAAI Conference on Artificial Intelligence, 39(27):28601–28609, 2025. doi: 10. 1609/aaai.v39i27.350841
2025
-
[49]
P. F. Rissom, P. Y . Sarmiento, J. Safer, C. W. Coley, B. Y . Renard, H. O. Heyne et al. Decoding protein language models: insights from embed- ding space analysis.bioRxiv, pp. 2024–06, 2024. doi: 10.1101/2024.06.21. 6001391
-
[50]
A. Rogers, O. Kovaleva, and A. Rumshisky. A primer in bertology: What we know about how bert works.Transactions of the association for computational linguistics, 8:842–866, 2020. doi:10.1162/tacl_a_003498
-
[51]
D. Romero-Alvarado, J. Hernández-Orallo, and F. Martínez-Plumed. How resilient are language models to text perturbations? InInternational Conference on Intelligent Data Engineering and Automated Learning, pp. 85–96, 2024. doi:10.1007/978-3-031-77731-8_82
-
[52]
P. J. Rousseeuw. Silhouettes: a graphical aid to the interpretation and validation of cluster analysis.Journal of computational and applied mathematics, 20:53–65, 1987. doi:10.1016/0377-0427(87)90125-75
-
[53]
M. Saggar, O. Sporns, J. Gonzalez-Castillo, P. A. Bandettini, G. Carlsson, G. Glover et al. Towards a new approach to reveal dynamical organization of the brain using topological data analysis.Nature Communications, 9(1399), 2018. doi:10.1038/s41467-018-03664-42
-
[54]
N. Schneider and N. A. Smith. A corpus and model integrating multiword expressions and supersenses. InProceedings of the 2015 Conference of the North American Chapter of the Association for Computational Linguistics: Human Language Technologies, pp. 1537–1547, 2015. doi: 10.3115/v1/N15-11776
-
[55]
T. Schumacher, H. Wolf, M. Ritzert, F. Lemmerich, M. Grohe, and M. Strohmaier. The effects of randomness on the stability of node embed- dings. InJoint European Conference on Machine Learning and Knowledge Discovery in Databases, pp. 197–215. Springer, 2021. doi: 10.48550/arXiv. 2005.100392
work page internal anchor Pith review doi:10.48550/arxiv 2021
-
[56]
R. Sevastjanova, E. Cakmak, S. Ravfogel, R. Cotterell, and M. El-Assady. Visual comparison of language model adaptation.IEEE Transactions on Visualization and Computer Graphics, 29(1):1178–1188, 2022. doi: 10. 1109/TVCG.2022.32094582
-
[57]
Sevastjanova, A.-L
R. Sevastjanova, A.-L. Kalouli, C. Beck, H. Hauptmann, and M. El-Assady. Explaining Contextualization in Language Models using Visual Analytics. InProc. of the Association for Computational Linguistics, ACL. ACL,
-
[58]
doi:10.48448/1bf4-bg311
-
[59]
R. Sevastjanova, A.-L. Kalouli, C. Beck, H. Hauptmann, and M. El-Assady. Lmfingerprints: Visual explanations of language model embedding spaces through layerwise contextualization scores.Computer Graphics Forum, 41(3):295–307, 2022. doi:10.1111/cgf.145412
-
[60]
M. Shahbazi, A. Shirali, H. Aghajan, and H. Nili. Using distance on the riemannian manifold to compare representations in brain and in models. NeuroImage, 239:118271, 2021. doi:10.1101/2020.11.25.3985112
-
[61]
B. Shneiderman. The eyes have it: A task by data type taxonomy for information visualizations. InThe craft of information visualization, pp. 364–371. Elsevier, 2003. doi:10.1109/VL.1996.5453076
-
[62]
Singh, F
G. Singh, F. Mémoli, and G. E. Carlsson. Topological methods for the analysis of high dimensional data sets and 3D object recognition.Euro- graphics Symposium on Point-Based Graphics, pp. 91–100, 2007. doi: 10. 2312/SPBG/SPBG07/091-1001, 2
2007
-
[63]
S. U. Singh and A. S. Namin. A survey on chatbots and large language models: Testing and evaluation techniques.Natural Language Processing Journal, 10:100128, 2025. doi:10.1016/j.nlp.2025.1001281
-
[64]
Sivaraman, Y
V . Sivaraman, Y . Wu, and A. Perer. Emblaze: Illuminating machine learning representations through interactive comparison of embedding spaces. In27th Int. Conf. on Intelligent User Interfaces, pp. 418–432,
-
[65]
doi:10.1145/3490099.35111371, 2
-
[66]
P. Solunke, V . Guardieiro, J. Rulff, P. Xenopoulos, G. Y .-Y . Chan, B. Barr et al. Mountaineer: Topology-driven visual analytics for comparing local explanations.IEEE Transactions on Visualization and Computer Graphics, 30(12):7763–7775, 2024. doi:10.1109/TVCG.2024.34186532, 3
-
[67]
Sucholutsky, L
I. Sucholutsky, L. Muttenthaler, A. Weller, A. Peng, A. Bobu, B. Kim et al. Getting aligned on representational alignment.Transactions on Machine Learning Research, 2025, 2025. 1, 2
2025
-
[68]
U. V on Luxburg. A tutorial on spectral clustering.Statistics and computing, 17(4):395–416, 2007. doi:10.1007/s11222-007-9033-z5
- [69]
-
[70]
A. H. Williams, E. Kunz, S. Kornblith, and S. Linderman. Generalized shape metrics on neural representations.Advances in neural information processing systems, 34:4738–4750, 2021. 2
2021
-
[71]
J. Wu, S. Saha, Y . Bo, and M. Khosla. Measuring the measures: Discrimi- native capacity of representational similarity metrics across model families. InUniReps: 3rd Edition of the Workshop on Unifying Representations in Neural Models, 2025. 2
2025
-
[72]
Xenopoulos, G
P. Xenopoulos, G. Chan, H. Doraiswamy, L. G. Nonato, B. Barr, and C. Silva. GALE: Globally assessing local explanations. InTopological, Algebraic and Geometric Learning Workshops 2022, pp. 322–331. PMLR,
2022
-
[73]
X. Xuan, X. Zhang, O.-H. Kwon, and K.-L. Ma. V AC-CNN: A visual analytics system for comparative studies of deep convolutional neural networks.IEEE Transactions on Visualization and Computer Graphics, 28(6):2326–2337, 2022. doi:10.1109/TVCG.2022.31653472
-
[74]
M. Xue, Y . Wang, Z. Wang, L. Zhu, L. Cui, Y . Chen et al. AutoFDP: Automatic force-based model selection for multicriteria graph drawing. IEEE Transactions on Visualization and Computer Graphics, 32(2):1554– 1568, 2026. doi:10.1109/TVCG.2025.36316593
- [75]
-
[76]
X. Yan, X. Xuan, J. P. Ono, J. Guo, V . Mohanty, S. A. Kumar et al. VISLIX: An XAI framework for validating vision models with slice discovery and analysis.Computer Graphics Forum, 44(3):e70125, 2025. doi: 10.1111/cgf .7012510
work page doi:10.1111/cgf 2025
-
[77]
Y . Ye, C. Ruan, Y . Zhang, Z. Deng, and W. Zeng. DKMap: Interactive exploration of vision-language alignment in multimodal embeddings via dynamic kernel enhanced projection.IEEE Transactions on Visualiza- tion and Computer Graphics, PP:1–11, 01 2026. doi: 10.1109/TVCG.2025. 36426412
-
[78]
Z. Yu, X. Li, P. Liu, and J. Tao. Parallel Clusters: Visual comparison of embeddings based on multi-scale neighborhood analysis.IEEE Transac- tions on Visualization and Computer Graphics, 32(3):2758–2772, 2026. doi:10.1109/TVCG.2026.36545901, 2
-
[79]
F. Zhong, M. Xue, J. Zhang, F. Zhang, R. Ban, O. Deussen et al. Force- directed graph layouts revisited: a new force based on the t-distribution. IEEE Transactions on Visualization and Computer Graphics, 30(7):3650– 3663, 2023. doi:10.1109/TVCG.2023.32388213
-
[80]
Y . Zhou, N. Chalapathi, A. Rathore, Y . Zhao, and B. Wang. Mapper Interactive: A scalable, extendable, and interactive toolbox for the visual exploration of high-dimensional data. InIEEE 14th Pacific Visualization Symposium, pp. 101–110, 2021. doi:10.1109/PacificVis52677.2021.000216
discussion (0)
Sign in with ORCID, Apple, or X to comment. Anyone can read and Pith papers without signing in.