pith. sign in

arxiv: 2606.05237 · v1 · pith:RRV5BQ3Pnew · submitted 2026-06-03 · 🌌 astro-ph.IM · astro-ph.EP· astro-ph.GA· astro-ph.HE· astro-ph.SR

GREX-PLUS Science Book v2

GREX-PLUS Science Team: Shunsuke Baba (ISAS/JAXA) , Sirio Belli (Universita di Bologna) , Pietro Benotto (INAF - Osservatorio Astronomico di Padova / Universita di Bologna) , Ivan Delvecchio (INAF - Osservatorio di Astrofisica e Scienza dello Spazio di Bologna) , Yoshinobu Fudamoto (Chiba University) , Yuka Fujii (NAOJ) , Yuichi Harikane (University of Tokyo) , Yasuhiro Hirahara (Nagoya University)
show 47 more authors
Akio K. Inoue (Waseda University) Yoshiyuki Inoue (University of Osaka) Hajime Kawahara (ISAS/JAXA / University of Tokyo) Taiki Kawamuro (University of Osaka) Yui Kawashima (Kyoto University) Lucas Kimmig (Ludwig-Maximilians-University / University of Nottingham) Tadayuki Kodama (Tohoku University) Mitsuru Kokubo (NAOJ) Hiroyuki Kurokawa (University of Tokyo) Katsunori Kusakabe (University of Osaka) Kosei Matsumoto (Ghent University) Noriyuki Matsunaga (University of Tokyo) Taro Matsuo (University of Osaka) Yoshiki Matsuoka (Ehime University) Shuji Matsuura (Kwansei Gakuin University) Toru Misawa (Shinshu University) Shota Miyazaki (ISAS/JAXA) Alessia Moretti (INAF - Osservatorio Astronomico di Padova) Kumiko Morihana (NAOJ) Takashi Moriya (NAOJ) Kentaro Nagamine (University of Osaka / University of Tokyo / University of Nevada Las Vegas) Kimihiko Nakajima (Kanazawa University) Hideko Nomura (NAOJ) Shota Notsu (University of Tokyo) Takafumi Ootsubo (University of Occupational Environmental Health) Kazumasa Ohno (NAOJ) Giorgia Peluso (INAF - Osservatorio di Astrofisica e Scienza dello Spazio di Bologna) Bianca M. Poggianti (INAF - Osservatorio Astronomico di Padova) Mario Radovich (INAF - Osservatorio Astronomico di Padova) Giulia Rodighiero (University of Padova) Hideo Sagawa (Kyoto Sangyo University) Kazuhiro Shimasaku (University of Tokyo) Takashi Shimonishi (Niigata University) Ken-ichi Tadaki (Hokkai-Gakuen University) Kosuke Takahashi (Tohoku University) Michihiro Takami (ASIAA) Shuya Tan (JAMSTEC) Takumi Tanaka (University of Tokyo) Tsuyoshi Terai (NAOJ) Yoshiki Toba (Ritsumeikan University) Roberta Tripodi (INAF - Astronomical Observatory of Rome) Francesco Valentino (DAWN / Technical University of Denmark) Benedetta Vulcani (INAF - Osservatorio Astronomico di Padova) Taihei Yano (NAOJ) Chikako Yasui (NAOJ) Stefano Zibetti (INAF - Arcetri Astrophysical Observatory)
This is my paper

Pith reviewed 2026-06-28 04:28 UTC · model grok-4.3

classification 🌌 astro-ph.IM astro-ph.EPastro-ph.GAastro-ph.HEastro-ph.SR
keywords galaxy reionizationprotoplanetary diskswater snowlineinfrared astronomyexoplanet atmospheresearly universemolecular spectroscopyspace telescope mission
0
0 comments X

The pith

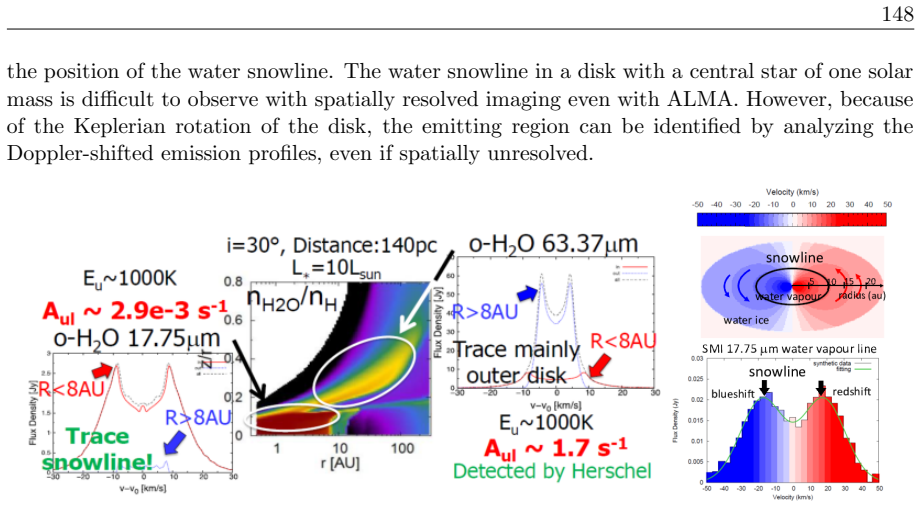
The proposed GREX-PLUS mission with its 1 m cooled telescope would detect galaxies at redshift above 15 and locate water snowlines in protoplanetary disks.

A machine-rendered reading of the paper's core claim, the machinery that carries it, and where it could break.

This paper collects scientific themes for a proposed space mission carrying a 1 m primary mirror cooled to 50 K. The wide-field camera covers 2 to 8 micrometers to target the earliest galaxies, while the high-resolution spectrometer at R=30000 covers 10 to 18 micrometers to map water snowlines. A sympathetic reader would care because these capabilities could open direct views of reionization-era objects and the ice lines that shape planet formation. The text compiles workshop-derived cases for galaxy assembly, black hole origins, exoplanet atmospheres, and interstellar chemistry without providing sensitivity calculations.

Core claim

The paper states that the wide-field camera aims to detect the first generation of galaxies at redshift z greater than 15 and the high-resolution spectrometer aims to identify the location of the water snowline in protoplanetary disks, thereby supplying datasets for galaxy mass assembly, supermassive black hole origins, infrared background radiation, molecular spectroscopy in the interstellar medium, transit spectroscopy of exoplanet atmospheres, and planetary atmospheres in the Solar System.

What carries the argument

The 1 m aperture telescope cooled to 50 K carrying a wide-field camera in the 2-8 micrometer band and a spectrometer with resolution 30000 in the 10-18 micrometer band.

If this is right

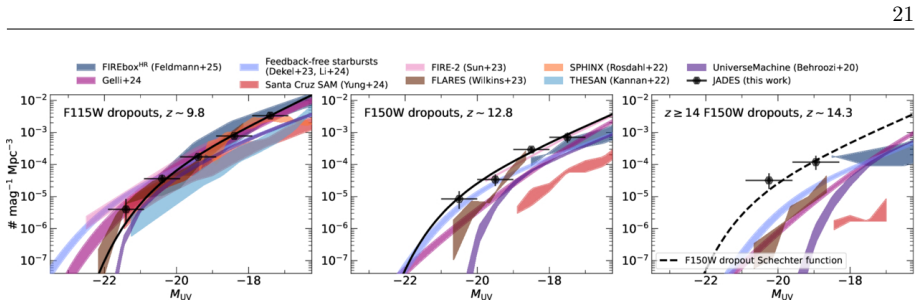
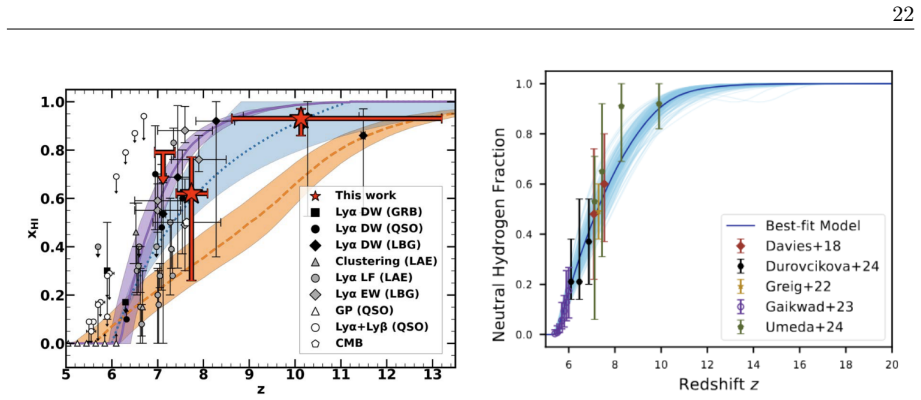
  • Successful detection of z greater than 15 galaxies would directly constrain the timing and sources of cosmic reionization.
  • Locating water snowlines would reveal the radial zones where icy planetesimals can form and migrate.
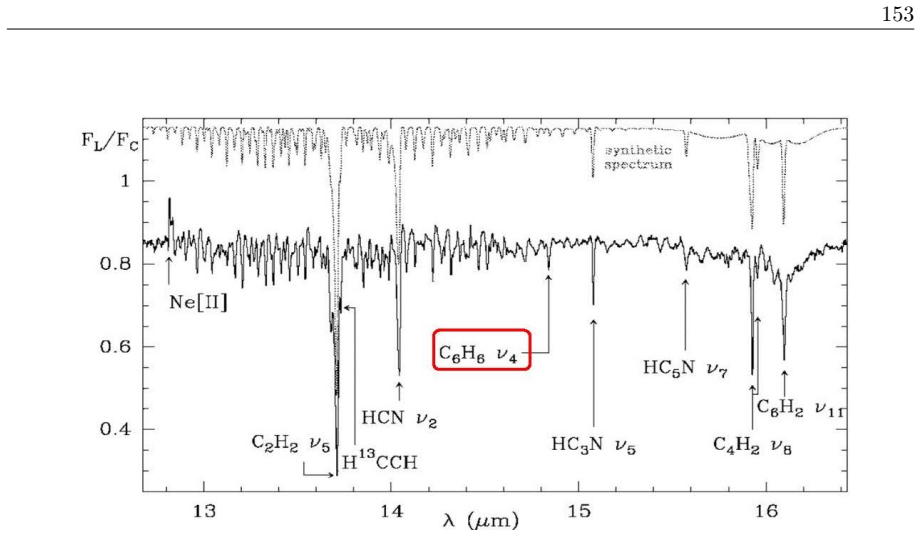
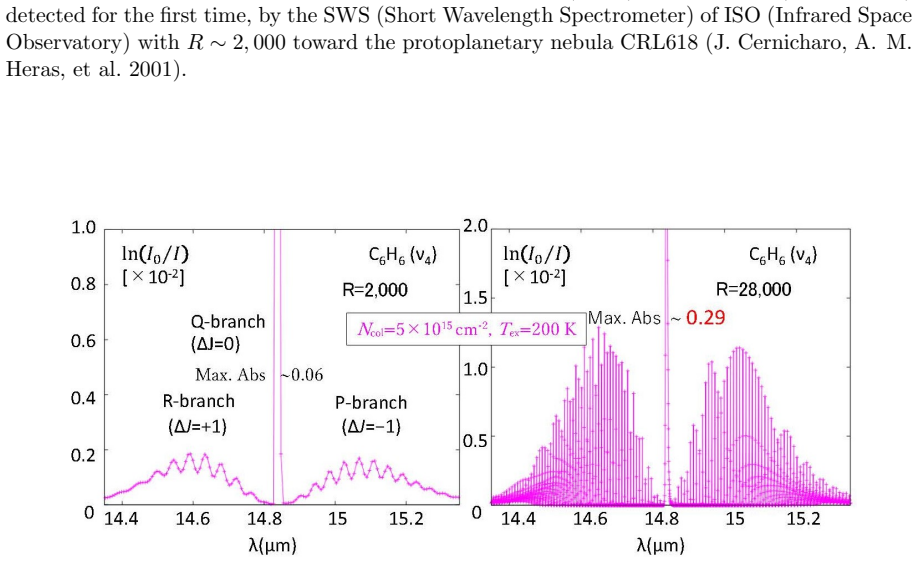
  • High-resolution spectra would enable detailed molecular line studies of the interstellar medium.
  • Transit observations would yield atmospheric composition data for a range of exoplanets.
  • The same instruments would deliver new measurements of Solar System planetary atmospheres and the cosmic infrared background.

Where Pith is reading between the lines

These are editorial extensions of the paper, not claims the author makes directly.

  • Wider-field infrared imaging at these wavelengths could fill gaps left by narrower-field facilities operating at similar epochs.
  • The snowline measurements could be cross-checked against millimeter observations of dust continuum to test disk temperature models.
  • If the mission proceeds, its data archive would support statistical studies of early galaxy luminosity functions beyond current limits.

Load-bearing premise

The stated aperture size, cooling temperature, and instrument wavelength ranges and resolutions will be realized in practice and will prove sufficient to achieve the listed detection goals.

What would settle it

No galaxies detected at redshift above 15 after the planned integration time, or failure to resolve the radial position of the water snowline in a sample of protoplanetary disks at the claimed sensitivity.

Figures

Figures reproduced from arXiv: 2606.05237 by Akio K. Inoue (Waseda University), Alessia Moretti (INAF - Osservatorio Astronomico di Padova), Benedetta Vulcani (INAF - Osservatorio Astronomico di Padova), Bianca M. Poggianti (INAF - Osservatorio Astronomico di Padova), Chikako Yasui (NAOJ), Environmental Health), Francesco Valentino (DAWN / Technical University of Denmark), Giorgia Peluso (INAF - Osservatorio di Astrofisica e Scienza dello Spazio di Bologna), Giulia Rodighiero (University of Padova), GREX-PLUS Science Team: Shunsuke Baba (ISAS/JAXA), Hajime Kawahara (ISAS/JAXA / University of Tokyo), Hideko Nomura (NAOJ), Hideo Sagawa (Kyoto Sangyo University), Hiroyuki Kurokawa (University of Tokyo), Ivan Delvecchio (INAF - Osservatorio di Astrofisica e Scienza dello Spazio di Bologna), Katsunori Kusakabe (University of Osaka), Kazuhiro Shimasaku (University of Tokyo), Kazumasa Ohno (NAOJ), Ken-ichi Tadaki (Hokkai-Gakuen University), Kentaro Nagamine (University of Osaka / University of Tokyo / University of Nevada Las Vegas), Kimihiko Nakajima (Kanazawa University), Kosei Matsumoto (Ghent University), Kosuke Takahashi (Tohoku University), Kumiko Morihana (NAOJ), Lucas Kimmig (Ludwig-Maximilians-University / University of Nottingham), Mario Radovich (INAF - Osservatorio Astronomico di Padova), Michihiro Takami (ASIAA), Mitsuru Kokubo (NAOJ), Noriyuki Matsunaga (University of Tokyo), Pietro Benotto (INAF - Osservatorio Astronomico di Padova / Universita di Bologna), Roberta Tripodi (INAF - Astronomical Observatory of Rome), Shota Miyazaki (ISAS/JAXA), Shota Notsu (University of Tokyo), Shuji Matsuura (Kwansei Gakuin University), Shuya Tan (JAMSTEC), Sirio Belli (Universita di Bologna), Stefano Zibetti (INAF - Arcetri Astrophysical Observatory), Tadayuki Kodama (Tohoku University), Taihei Yano (NAOJ), Taiki Kawamuro (University of Osaka), Takafumi Ootsubo (University of Occupational, Takashi Moriya (NAOJ), Takashi Shimonishi (Niigata University), Takumi Tanaka (University of Tokyo), Taro Matsuo (University of Osaka), Toru Misawa (Shinshu University), Tsuyoshi Terai (NAOJ), Yasuhiro Hirahara (Nagoya University), Yoshiki Matsuoka (Ehime University), Yoshiki Toba (Ritsumeikan University), Yoshinobu Fudamoto (Chiba University), Yoshiyuki Inoue (University of Osaka), Yuichi Harikane (University of Tokyo), Yui Kawashima (Kyoto University), Yuka Fujii (NAOJ).

Figure 1.1
Figure 1.1. Figure 1.1: Scientific objectives, required observations, and instruments of GREX-PLUS. [PITH_FULL_IMAGE:figures/full_fig_p010_1_1.png] view at source ↗
Figure 1.2
Figure 1.2. Figure 1.2: Comparisons of survey areas and depths in the wavelength 3–5 [PITH_FULL_IMAGE:figures/full_fig_p015_1_2.png] view at source ↗
Figure 1.3
Figure 1.3. Figure 1.3: A comparison of the line sensitivity (1 hr exposure, 5 [PITH_FULL_IMAGE:figures/full_fig_p016_1_3.png] view at source ↗
Figure 2
Figure 2. Figure 2 [PITH_FULL_IMAGE:figures/full_fig_p018_2.png] view at source ↗
Figure 2.1
Figure 2.1. Figure 2.1: Structure formation in the ΛCDM cosmology and the scientific focus of GREX [PITH_FULL_IMAGE:figures/full_fig_p019_2_1.png] view at source ↗
Figure 2
Figure 2. Figure 2 [PITH_FULL_IMAGE:figures/full_fig_p019_2.png] view at source ↗
Figure 2.2
Figure 2.2. Figure 2.2: Examples of rest-frame UV luminosity functions of galaxies at [PITH_FULL_IMAGE:figures/full_fig_p020_2_2.png] view at source ↗
Figure 2
Figure 2. Figure 2 [PITH_FULL_IMAGE:figures/full_fig_p020_2.png] view at source ↗
Figure 2.3
Figure 2.3. Figure 2.3: Rest-frame UVLFs from L. Whitler et al. (2025), extending to [PITH_FULL_IMAGE:figures/full_fig_p021_2_3.png] view at source ↗
Figure 2.4
Figure 2.4. Figure 2.4: Volume-averaged neutral fraction as a function of redshift from M. Nakane et al. [PITH_FULL_IMAGE:figures/full_fig_p022_2_4.png] view at source ↗
Figure 2.5
Figure 2.5. Figure 2.5: Thomson optical depth as a function of redshift from R. P. Naidu et al. (2020, [PITH_FULL_IMAGE:figures/full_fig_p023_2_5.png] view at source ↗
Figure 2.6
Figure 2.6. Figure 2.6: Zoom-in cosmological hydrodynamic simulation of high-redshift galaxies, resolving [PITH_FULL_IMAGE:figures/full_fig_p027_2_6.png] view at source ↗
Figure 2.7
Figure 2.7. Figure 2.7: THESAN cosmological radiation hydrodynamic simulation. The left box shows the [PITH_FULL_IMAGE:figures/full_fig_p028_2_7.png] view at source ↗
Figure 2.8
Figure 2.8. Figure 2.8: Comparison of SHMR from both simulations and observations (R. Kannan et al. [PITH_FULL_IMAGE:figures/full_fig_p029_2_8.png] view at source ↗
Figure 2.9
Figure 2.9. Figure 2.9: The galaxy–Lyα transmission cross-correlation as a probe of neutral hydrogen distri￾bution around galaxies during the epoch of reionization. Panel (a): Average Lyα transmission relative to the mean, ⟨T(r)⟩/T¯−1, as a function of distance from galaxies in the THESAN-1 sim￾ulation at z = 5.5 (E. Garaldi et al. 2022). Solid curves show predictions for different minimum host halo masses (Mhalo ≥ 1010, 1011, … view at source ↗
Figure 2
Figure 2. Figure 2: (b) presents a complementary observational measurement from K. Kakiichi et al. [PITH_FULL_IMAGE:figures/full_fig_p030_2.png] view at source ↗
Figure 2.10
Figure 2.10. Figure 2.10: Absolute ultraviolet magnitude of galaxies as a function of redshift. The blue [PITH_FULL_IMAGE:figures/full_fig_p036_2_10.png] view at source ↗
Figure 2.11
Figure 2.11. Figure 2.11: Expected numbers of galaxies detected in the GREX-PLUS imaging surveys (left [PITH_FULL_IMAGE:figures/full_fig_p037_2_11.png] view at source ↗
Figure 2.12
Figure 2.12. Figure 2.12: (Left) Limiting stellar mass of galaxies as a function of redshift with GREX-PLUS. For star-forming galaxies (Blue), we use the model flux in the F397 filter. In contrast, we use the F303 flux to calculate the mass limit for quiescent (Balmer-break) galaxies (Red). The first selection of quiescent galaxies at z > 5.5 must be conducted by GREX-PLUS itself, capturing the Balmer break feature with two adja… view at source ↗
Figure 2
Figure 2. Figure 2: illustrates a possible implementation of medium-band filters on GREX-PLUS. [PITH_FULL_IMAGE:figures/full_fig_p041_2.png] view at source ↗
Figure 2.13
Figure 2.13. Figure 2.13: The left panel shows the proposed medium-band filters for GREX-PLUS. The [PITH_FULL_IMAGE:figures/full_fig_p042_2_13.png] view at source ↗
Figure 2
Figure 2. Figure 2: showcases the opportunities that GREX-PLUS will open. Considering the 700 qui [PITH_FULL_IMAGE:figures/full_fig_p044_2.png] view at source ↗
Figure 2.14
Figure 2.14. Figure 2.14: Left: Stellar mass and JWST/NIRCam F444W magnitude distribution for a sample [PITH_FULL_IMAGE:figures/full_fig_p045_2_14.png] view at source ↗
Figure 2.15
Figure 2.15. Figure 2.15: Top row: For protocluster candidate galaxies with [PITH_FULL_IMAGE:figures/full_fig_p048_2_15.png] view at source ↗
Figure 2.16
Figure 2.16. Figure 2.16: Stellar masses of the most massive galaxies expected in a 100 deg [PITH_FULL_IMAGE:figures/full_fig_p051_2_16.png] view at source ↗
Figure 2.17
Figure 2.17. Figure 2.17 [PITH_FULL_IMAGE:figures/full_fig_p057_2_17.png] view at source ↗
Figure 2.18
Figure 2.18. Figure 2.18: Left: A mock dust-attenuated stellar spectrum of a star-forming galaxy with a stellar mass of 4 × 10¹⁰ M⊙ and AV = 0.3 at various redshifts is shown in black tones, together with the sensitivity limits of the available filters of the Roman Space Telescope, LSST, and GREX-PLUS (plotted in orange, green, and blue, respectively). Right: The redshift evolution of the slopes of the attenuation curves for JWS… view at source ↗
Figure 2.19
Figure 2.19. Figure 2.19: Example of a 3.3 µm PAH emission map for a galaxy undergoing ram pressure stripping in an intermediate-redshift cluster. An RGB image composite of F070W (blue), F115W (green), and F200W (red) filters with the 5σ-significance PAH map of the galaxy (superimposed in purple) is shown on the left. The red ellipse indicates the galaxy disk. The arrow indicates the RPS direction. The surface brightness map of … view at source ↗
Figure 2.20
Figure 2.20. Figure 2.20: Example of a gas kinematics in a ram-pressure-stripped galaxy in different gas [PITH_FULL_IMAGE:figures/full_fig_p069_2_20.png] view at source ↗
Figure 2
Figure 2. Figure 2: ) [PITH_FULL_IMAGE:figures/full_fig_p072_2.png] view at source ↗
Figure 2.21
Figure 2.21. Figure 2.21: Logarithmic differences between total stellar mass estimates obtained from un [PITH_FULL_IMAGE:figures/full_fig_p073_2_21.png] view at source ↗
Figure 2.22
Figure 2.22. Figure 2.22: Mass maps of M101 (upper panels) made from the pixel-by-pixel method of S. Zibetti, S. Charlot, and H.-W. Rix (2009) using g- and i-band images from SDSS (left-hand panel) and from that using a single global M/L with an i-band image (right-hand panel). The torque maps for each respective mass image are shown in the bottom panels. The global M/L methodology enhances the spiral arms and the torques associ… view at source ↗
Figure 2.23
Figure 2.23. Figure 2.23: Left: Expected peak brightness of pair-instability supernovae (PISN) and super￾luminous supernovae (SLSN) at high redshifts in the F232 (around 2 µm) and F397 (around 4 µm) bands. For pair-instability supernovae, we show the two brightest models (R250 and R225). By conducting supernova surveys that reach deeper than 26 AB mag per epoch, we can discover supernovae that are more distant (z ≳ 7) than those… view at source ↗
Figure 2.24
Figure 2.24. Figure 2.24: A summary of background radiation observations. The solid black line and sur [PITH_FULL_IMAGE:figures/full_fig_p083_2_24.png] view at source ↗
Figure 2.25
Figure 2.25. Figure 2.25: A comparison of contributions from direct observations of the cosmic infrared [PITH_FULL_IMAGE:figures/full_fig_p084_2_25.png] view at source ↗
Figure 2
Figure 2. Figure 2: presents the expected surface density of quasars (per 1000 deg [PITH_FULL_IMAGE:figures/full_fig_p087_2.png] view at source ↗
Figure 2.26
Figure 2.26. Figure 2.26: Expected surface density of quasars (per 1000 deg [PITH_FULL_IMAGE:figures/full_fig_p088_2_26.png] view at source ↗
Figure 2
Figure 2. Figure 2: indicates that the situation is similar to the [PITH_FULL_IMAGE:figures/full_fig_p089_2.png] view at source ↗
Figure 2.27
Figure 2.27. Figure 2.27: (a and c) SEDs for the detectable LRDs at each redshift with Strategies 1 and 2, [PITH_FULL_IMAGE:figures/full_fig_p093_2_27.png] view at source ↗
Figure 2.28
Figure 2.28. Figure 2.28: (Left): median SEDs of LRDs at z = 6.2, k-corrected between z = 2 and z = 7. Filter transmission curves are shown at the bottom for JWST/NIRCam and MIRI, Roman/WFI, and GREX-PLUS Wide-Field Camera. (Right): MUV - z parameter space for LRDs. Orange and cyan shaded regions indicate the GREX-PLUS parameter space with Strategies 1 and 2 in Science Case 1 (z ≳ 10), respectively. Red shaded region indicates t… view at source ↗
Figure 2.29
Figure 2.29. Figure 2.29: Typical SEDs of optically dark IR galaxies found in the AKARI NEP (Y. Toba, [PITH_FULL_IMAGE:figures/full_fig_p099_2_29.png] view at source ↗
Figure 2.30
Figure 2.30. Figure 2.30: GREX-PLUS mid-IR color–color diagrams for composite AGN+star-forming galaxy [PITH_FULL_IMAGE:figures/full_fig_p104_2_30.png] view at source ↗
Figure 2.31
Figure 2.31. Figure 2.31: The AGN template spectrum redshifted to z = 1 (mLSST−i = 21 mag), 2 (22 mag), and 3 (23 mag). The UV–NIR spectrum at 0.086 µm ≤ λ ≤ 1.4 µm is that provided by STScI (D. E. Vanden Berk, G. T. Richards, et al. 2001; E. Glikman, D. J. Helfand, and R. L. White 2006), and the MIR spectrum at λ > 1.4 µm is that provided by A. Hern´an-Caballero et al. 2016. The vertical bars indicate the 5σ limiting magnitudes… view at source ↗
Figure 2.32
Figure 2.32. Figure 2.32: Cumulative AGN surface number density per 1 deg [PITH_FULL_IMAGE:figures/full_fig_p113_2_32.png] view at source ↗
Figure 2.33
Figure 2.33. Figure 2.33: Left: The continuous light curves indicate simulated light curves in the F232 and F397 bands for mF397 = 23 mag and 26 mag AGNs at z = 1. The squares and circles denote the low-cadence transient survey with per-epoch exposure times of 10 hours (wide survey) and 100 hours (deep survey), respectively. For clarity, these symbols have been slightly offset along the horizontal axis when plotted. The signific… view at source ↗
Figure 2.34
Figure 2.34. Figure 2.34: Same as the left panel of Figure 2.33 (for an AGN at [PITH_FULL_IMAGE:figures/full_fig_p117_2_34.png] view at source ↗
Figure 2.35
Figure 2.35. Figure 2.35: Left: schematic of the observation of an AGN torus region using near-infrared ab [PITH_FULL_IMAGE:figures/full_fig_p122_2_35.png] view at source ↗
Figure 2.36
Figure 2.36. Figure 2.36: Left: expected R = 25, 000 spectrum of the outflow described in this text observed from the same line of sight as the propagation direction with S/N=2.7 for the continuum level. Right: velocity profiles for the lines of different rotational levels J averaged for each low and high excitation regime. The binning is applied with a velocity width corresponding to the required resolution (R = 10, 000, i.e., … view at source ↗
Figure 2.37
Figure 2.37. Figure 2.37: Voigt profile fits (blue curves) to the 4.7 [PITH_FULL_IMAGE:figures/full_fig_p128_2_37.png] view at source ↗
Figure 2.38
Figure 2.38. Figure 2.38: Synthesized spectrum around the 4.7 µm CO ro-vib bands at z = 2.2. We assume log(NCO/cm−2 ) = 16, Tkin = 100 K, and n(H2) = 18 cm−3 , following R. Srianand et al. (2008), S. A. Balashev et al. (2019), and S. J. Geier et al. (2019). The blue curve denotes the intrinsic spectrum with a thermally broadened line width, while green and red curves are those after convolution with R = 30, 000 and adding noise … view at source ↗
Figure 2.39
Figure 2.39. Figure 2.39: Theoretically predicted infrared fluxes and colors of YSOs at the distance of the [PITH_FULL_IMAGE:figures/full_fig_p131_2_39.png] view at source ↗
Figure 2
Figure 2. Figure 2: shows theoretically predicted infrared fluxes and colors of YSOs at the distance [PITH_FULL_IMAGE:figures/full_fig_p131_2.png] view at source ↗
Figure 2.40
Figure 2.40. Figure 2.40: Spectral energy distributions of various objects related to star and planet formation, [PITH_FULL_IMAGE:figures/full_fig_p132_2_40.png] view at source ↗
Figure 2.41
Figure 2.41. Figure 2.41: Expected brightnesses of Miras (P = 300 days, no dust excess or absorption) and coverage of various surveys indicated in the panel. The observational outputs—AGB catalogs, dust-chemistry maps, and variability information— can be directly compared with existing multiwavelength datasets. Far-infrared dust maps from Herschel and JWST reveal the distribution of ISM dust, while ALMA observations trace molec￾… view at source ↗
Figure 3.1
Figure 3.1. Figure 3.1: Schematic illustration of two different modes of volatile delivery to terrestrial planets. [PITH_FULL_IMAGE:figures/full_fig_p141_3_1.png] view at source ↗
Figure 3.2
Figure 3.2. Figure 3.2: (Left) Model calculations of the distribution of gas-phase water in a protoplanetary disk and their emission-line spectra (S. Notsu, H. Nomura, D. Ishimoto, et al. 2017). The 63.37 µm emission line detected by Herschel mainly traces the hot surface layer of the outer disk, whereas the 17.75 µm emission line, observable by GREX-PLUS, traces the position of the water snowline. (Right) By analysing emission… view at source ↗
Figure 3.3
Figure 3.3. Figure 3.3: The infrared absorption spectrum of benzene (C [PITH_FULL_IMAGE:figures/full_fig_p153_3_3.png] view at source ↗
Figure 3.4
Figure 3.4. Figure 3.4: Simulated IR high-resolution spectrum of benzene (C [PITH_FULL_IMAGE:figures/full_fig_p153_3_4.png] view at source ↗
Figure 3.5
Figure 3.5. Figure 3.5: Molecular structures of aromatic hydrocarbons recently detected in the cold dark [PITH_FULL_IMAGE:figures/full_fig_p154_3_5.png] view at source ↗
Figure 3.6
Figure 3.6. Figure 3.6: Infrared emission spectra of C60 and C70 toward the young planetary nebula Tc-1, continuum-subtracted spectrum between 5 and 23 µm, with the Spitzer IRS (J. Cami et al. 2010). The red and blue curves below the data are thermal emission models for all infrared active bands of C60 and C70 at temperatures of 330 K and 180 K, respectively. UV-irradiated protoplanetary environments. These observations further… view at source ↗
Figure 3
Figure 3. Figure 3: shows an excerpt of conventional “build-up” ion-molecule reaction network for the [PITH_FULL_IMAGE:figures/full_fig_p156_3.png] view at source ↗
Figure 3.7
Figure 3.7. Figure 3.7: A chemical reaction network for the formation of organic molecules from simple [PITH_FULL_IMAGE:figures/full_fig_p158_3_7.png] view at source ↗
Figure 3.8
Figure 3.8. Figure 3.8: Comparison between the observed JWST spectrum of d203-506 and modeled CH [PITH_FULL_IMAGE:figures/full_fig_p158_3_8.png] view at source ↗
Figure 3.9
Figure 3.9. Figure 3.9: Results of the cross-correlation between the mock and template spectra for the case [PITH_FULL_IMAGE:figures/full_fig_p163_3_9.png] view at source ↗
Figure 3
Figure 3. Figure 3: shows the distribution of the estimated radial velocity at these two phases (indi [PITH_FULL_IMAGE:figures/full_fig_p165_3.png] view at source ↗
Figure 3.10
Figure 3.10. Figure 3.10: Top panel: model thermal emission spectrum of a Jupiter-like planet with an [PITH_FULL_IMAGE:figures/full_fig_p168_3_10.png] view at source ↗
Figure 3.11
Figure 3.11. Figure 3.11: Probability distributions of the planetary radial velocity at the two quadrature [PITH_FULL_IMAGE:figures/full_fig_p169_3_11.png] view at source ↗
Figure 3.12
Figure 3.12. Figure 3.12: Top panel: modeled temperature profiles of GJ 1214b with and without a haze layer [PITH_FULL_IMAGE:figures/full_fig_p169_3_12.png] view at source ↗
Figure 3.13
Figure 3.13. Figure 3.13: An example of an infrared spectrum of Titan’s atmosphere observed by [PITH_FULL_IMAGE:figures/full_fig_p171_3_13.png] view at source ↗
Figure 3.14
Figure 3.14. Figure 3.14: Top: Titan JWST/MIRI spectra obtained in a Guaranteed Time Observation [PITH_FULL_IMAGE:figures/full_fig_p172_3_14.png] view at source ↗
Figure 3.15
Figure 3.15. Figure 3.15: Left: Simulated infrared spectrum of Uranus’s atmosphere. A close-up to H [PITH_FULL_IMAGE:figures/full_fig_p174_3_15.png] view at source ↗
Figure 3.16
Figure 3.16. Figure 3.16: Reflectance spectra of representative carbonaceous asteroids (Ryugu and Ceres) and [PITH_FULL_IMAGE:figures/full_fig_p177_3_16.png] view at source ↗
Figure 3.17
Figure 3.17. Figure 3.17: Median reflectance spectra of the TNO compositional groups (left: bowl type, [PITH_FULL_IMAGE:figures/full_fig_p179_3_17.png] view at source ↗
Figure 3.18
Figure 3.18. Figure 3.18: AB magnitude vs. wavelength plots of TNOs at a heliocentric distance of 42 au with [PITH_FULL_IMAGE:figures/full_fig_p180_3_18.png] view at source ↗
Figure 3
Figure 3. Figure 3: ). Wide-field survey observations at low ecliptic latitude (within [PITH_FULL_IMAGE:figures/full_fig_p181_3.png] view at source ↗
Figure 3.19
Figure 3.19. Figure 3.19: Evolution of protoplanetary disks—fraction of stars with NIR disk excess as a [PITH_FULL_IMAGE:figures/full_fig_p186_3_19.png] view at source ↗
Figure 3
Figure 3. Figure 3: ). Although the spectral coverage of its high-resolution (HR) spectrograph is signif [PITH_FULL_IMAGE:figures/full_fig_p187_3.png] view at source ↗
Figure 3.20
Figure 3.20. Figure 3.20: (Left) A variety of molecular emission lines from the disk associated with a low [PITH_FULL_IMAGE:figures/full_fig_p188_3_20.png] view at source ↗
Figure 3.21
Figure 3.21. Figure 3.21: (Left) Number of brown dwarfs within 20 pc of the Sun as a function of estimated [PITH_FULL_IMAGE:figures/full_fig_p191_3_21.png] view at source ↗
Figure 3
Figure 3. Figure 3: shows the relative gain of GREX-PLUS compared to WISE for two cases: [PITH_FULL_IMAGE:figures/full_fig_p194_3.png] view at source ↗
Figure 3.22
Figure 3.22. Figure 3.22: Expected gain in the number of detected Y dwarfs in the GREX-PLUS survey [PITH_FULL_IMAGE:figures/full_fig_p195_3_22.png] view at source ↗
Figure 3
Figure 3. Figure 3: shows the simulated trends of five photometric colors observable with the GREX [PITH_FULL_IMAGE:figures/full_fig_p195_3.png] view at source ↗
Figure 3
Figure 3. Figure 3: clearly demonstrates that the color–magnitude trends differ depending on the [PITH_FULL_IMAGE:figures/full_fig_p196_3.png] view at source ↗
Figure 3.23
Figure 3.23. Figure 3.23: Simulated trends of photometric colors observable with the GREX-PLUS wide [PITH_FULL_IMAGE:figures/full_fig_p197_3_23.png] view at source ↗
Figure 3.24
Figure 3.24. Figure 3.24: The typical spectral energy distribution (SED) of interstellar dust in the Milky Way. [PITH_FULL_IMAGE:figures/full_fig_p200_3_24.png] view at source ↗
Figure 3.25
Figure 3.25. Figure 3.25: All-sky X-ray image (3–20 keV) with MAXI/GSC from 2009 August to 2015 [PITH_FULL_IMAGE:figures/full_fig_p201_3_25.png] view at source ↗
Figure 3.26
Figure 3.26. Figure 3.26: Spitzer/GLIMPSE 360-degree infrared panorama of the Milky Way. This mosaic, [PITH_FULL_IMAGE:figures/full_fig_p202_3_26.png] view at source ↗
Figure 3.27
Figure 3.27. Figure 3.27: Schematic picture of sub-structures of the Galaxy [PITH_FULL_IMAGE:figures/full_fig_p206_3_27.png] view at source ↗
read the original abstract

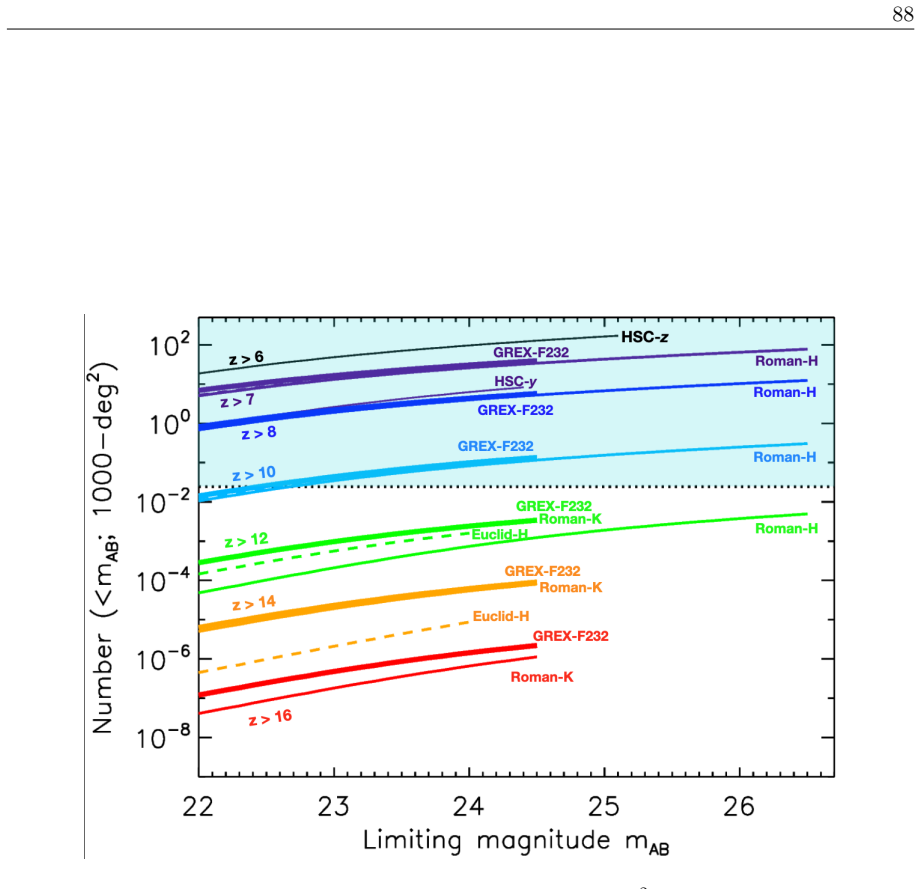
GREX-PLUS (Galaxy Reionization EXplorer and PLanetary Universe Spectrometer) is a mission candidate for a JAXA strategic L-class mission to be launched in the 2030s. Its primary science goals are two-fold: galaxy formation and evolution, and planetary system formation and evolution. The GREX-PLUS spacecraft will carry a telescope with a 1 m primary mirror aperture cooled down to 50 K. The two science instruments will be onboard: a wide-field camera in the 2--8 $\mu$m wavelength band and a high-resolution spectrometer with a wavelength resolution of 30,000 in the 10--18 $\mu$m band. The GREX-PLUS wide-field camera aims to detect the first generation of galaxies at redshift $z>15$. The GREX-PLUS high-resolution spectrometer aims to identify the location of the water ``snowline'' in protoplanetary disks. Both instruments will provide unique datasets for a broad range of scientific topics, including galaxy mass assembly, the origin of supermassive blackholes, infrared background radiation, molecular spectroscopy in the interstellar medium, transit spectroscopy of exoplanet atmospheres, planetary atmospheres in the Solar System, and so on. This document is the second version of a collection of scientific themes that can be achieved with GREX-PLUS. Each section in Chapters~2 and 3 is based on presentations at several GREX-PLUS Science Workshops.

Editorial analysis

A structured set of objections, weighed in public.

Desk editor's note, referee report, simulated authors' rebuttal, and a circularity audit. Tearing a paper down is the easy half of reading it; the pith above is the substance, this is the friction.

Referee Report

2 major / 1 minor

Summary. The manuscript is v2 of the GREX-PLUS Science Book for a proposed JAXA strategic L-class mission. It describes a 1 m primary mirror telescope cooled to 50 K carrying a wide-field camera (2-8 μm) whose goal is to detect first-generation galaxies at z>15 and a high-resolution spectrometer (R=30,000, 10-18 μm) whose goal is to locate the water snowline in protoplanetary disks. The document compiles additional science themes on galaxy mass assembly, supermassive black holes, infrared background, molecular spectroscopy, exoplanet transit spectroscopy, and Solar System atmospheres, with each section in Chapters 2 and 3 drawn from workshop presentations.

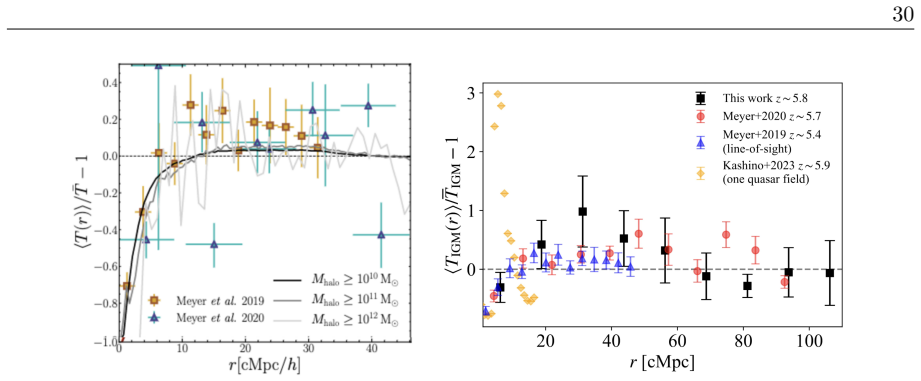
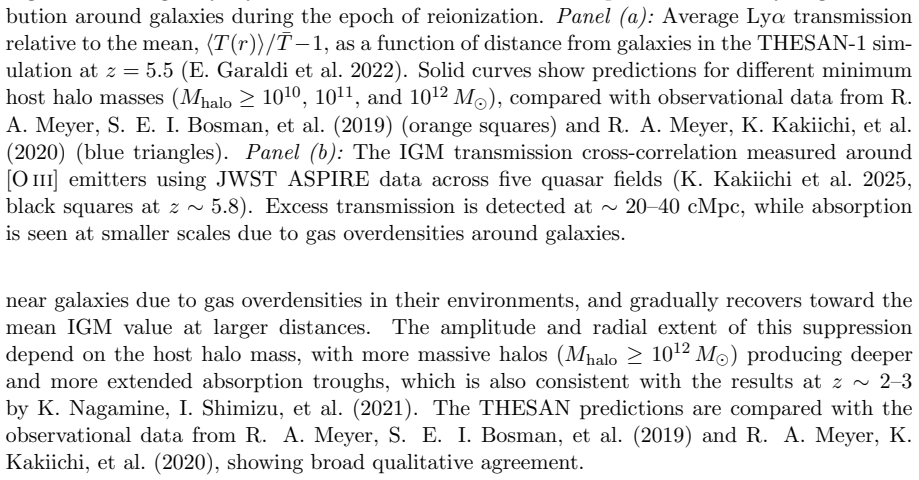
Significance. If the mission is realized with the stated aperture, cooling, and instrument parameters, the resulting infrared datasets could address key questions in early galaxy formation and protoplanetary disk chemistry that are difficult to access from the ground or with existing space facilities. The workshop-derived compilation provides a broad, community-sourced view of possible applications across multiple sub-fields.

major comments (2)
  1. [Abstract] Abstract: The statements that the wide-field camera 'aims to detect' galaxies at z>15 and the spectrometer 'aims to identify' the water snowline are presented as central mission goals without any sensitivity calculations, exposure-time estimates, limiting-magnitude derivations, or comparison to existing facilities that would demonstrate how the 1 m aperture, 50 K cooling, wavelength coverage, and R=30,000 resolution are sufficient to achieve them.
  2. [Chapters 2 and 3] Chapters 2 and 3: Each science theme is described at a conceptual level only; no quantitative performance modeling, signal-to-noise projections, or trade-off analyses are supplied to link the instrument specifications to the listed observables (e.g., galaxy detection rates or snowline radial precision).
minor comments (1)
  1. A summary table mapping each instrument specification to the primary science goals would improve readability and allow readers to quickly assess coverage.

Simulated Author's Rebuttal

2 responses · 0 unresolved

We thank the referee for the constructive review and for recognizing the potential scientific value of the proposed GREX-PLUS mission. The comments correctly identify that the current manuscript is a high-level compilation of science themes rather than a detailed performance study. We address each major comment below.

read point-by-point responses
  1. Referee: [Abstract] Abstract: The statements that the wide-field camera 'aims to detect' galaxies at z>15 and the spectrometer 'aims to identify' the water snowline are presented as central mission goals without any sensitivity calculations, exposure-time estimates, limiting-magnitude derivations, or comparison to existing facilities that would demonstrate how the 1 m aperture, 50 K cooling, wavelength coverage, and R=30,000 resolution are sufficient to achieve them.

    Authors: We agree that the abstract states the primary goals without supporting quantitative analysis. The GREX-PLUS Science Book v2 is a workshop-derived compilation of possible science applications and is not a mission proposal document. The stated goals reflect the intended science drivers for the proposed instrument parameters. We will revise the abstract to clarify the document's scope and note that detailed sensitivity calculations belong in a future technical proposal. revision: partial

  2. Referee: [Chapters 2 and 3] Chapters 2 and 3: Each science theme is described at a conceptual level only; no quantitative performance modeling, signal-to-noise projections, or trade-off analyses are supplied to link the instrument specifications to the listed observables (e.g., galaxy detection rates or snowline radial precision).

    Authors: We acknowledge that Chapters 2 and 3 provide only conceptual descriptions without quantitative modeling. As a community-sourced collection from workshop presentations, the focus is on outlining potential science themes rather than performing detailed simulations. Adding such analyses for each theme is beyond the scope of this document. We will add an explicit statement in the introduction clarifying this limitation. revision: partial

Circularity Check

0 steps flagged

No derivations, predictions, or fitted quantities; purely prospective mission science case

full rationale

The document is a science-case compilation for a proposed JAXA mission (GREX-PLUS). It states mission aims (detect z>15 galaxies with wide-field camera; locate water snowline with spectrometer) and lists potential science themes, but contains no equations, derivations, performance modeling, sensitivity calculations, or quantitative predictions. No parameters are fitted to data and then repurposed as outputs. No self-citations are used to justify uniqueness theorems or ansatzes. The content is forward-looking planning without any load-bearing steps that could reduce to self-referential inputs by construction. This is the most common honest finding for mission-concept documents.

Axiom & Free-Parameter Ledger

0 free parameters · 1 axioms · 0 invented entities

The document rests on domain assumptions about future instrument performance rather than deriving results from existing data or literature; no free parameters or invented entities are introduced because no quantitative modeling is performed.

axioms (1)
  • domain assumption The proposed 1 m aperture, 50 K cooling, and instrument wavelength/resolution specifications will be technically achievable and adequate for the stated science goals.
    Invoked throughout the abstract as the foundation for all listed science themes without supporting analysis.

pith-pipeline@v0.9.1-grok · 6422 in / 1326 out tokens · 42096 ms · 2026-06-28T04:28:07.615153+00:00 · methodology

discussion (0)

Sign in with ORCID, Apple, or X to comment. Anyone can read and Pith papers without signing in.

Reference graph

Works this paper leans on

300 extracted references · 283 canonical work pages · 58 internal anchors

  1. [1]

    arXiv e-prints , keywords =

    GREX-PLUS Science Book. arXiv e-prints , keywords =. doi:10.48550/arXiv.2304.08104 , archivePrefix =. 2304.08104 , primaryClass =

  2. [2]

    C., McLure, R

    A massive quiescent galaxy at redshift 4.658. , keywords =. doi:10.1038/s41586-023-06158-6 , archivePrefix =. 2301.11413 , primaryClass =

  3. [3]

    C., Cullen, F., McLure, R

    The JWST EXCELS survey: too much, too young, too fast? Ultra-massive quiescent galaxies at 3 < z < 5. , keywords =. doi:10.1093/mnras/stae2092 , archivePrefix =. 2405.02242 , primaryClass =

  4. [4]

    , keywords =

    A massive galaxy that formed its stars at z 11. , keywords =. doi:10.1038/s41586-024-07191-9 , archivePrefix =. 2308.05606 , primaryClass =

  5. [5]

    Nature Astronomy , keywords =

    Efficient formation of a massive quiescent galaxy at redshift 4.9. Nature Astronomy , keywords =. doi:10.1038/s41550-024-02424-3 , archivePrefix =. 2404.05683 , primaryClass =

  6. [6]

    , keywords =

    Ejective Feedback as a Quenching Mechanism in the First 1.5 Billion Years of the Universe: Detection of Neutral Gas Outflow in a z = 4 Recently Quenched Galaxy. , keywords =. doi:10.3847/1538-4357/ad98ef , archivePrefix =. 2409.00471 , primaryClass =

  7. [7]

    , keywords =

    RUBIES Reveals a Massive Quiescent Galaxy at z = 7.3. , keywords =. doi:10.3847/1538-4357/adab7a , archivePrefix =. 2409.03829 , primaryClass =

  8. [8]

    E., Brammer, G., et al

    Gas outflows in two recently quenched galaxies at z = 4 and 7. , keywords =. doi:10.1051/0004-6361/202553908 , archivePrefix =. 2503.01990 , primaryClass =

  9. [9]

    , keywords =

    An Atlas of Color-selected Quiescent Galaxies at z > 3 in Public JWST Fields. , keywords =. doi:10.3847/1538-4357/acbefa , archivePrefix =. 2302.10936 , primaryClass =

  10. [10]

    , keywords =

    A surprising abundance of massive quiescent galaxies at 3 < z < 5 in the first data from JWST CEERS. , keywords =. doi:10.1093/mnras/stad369 , archivePrefix =. 2208.00986 , primaryClass =

  11. [11]

    , keywords =

    Star formation shut down by multiphase gas outflow in a galaxy at a redshift of 2.45. , keywords =. doi:10.1038/s41586-024-07412-1 , archivePrefix =. 2308.05795 , primaryClass =

  12. [12]

    Nature Astronomy , keywords =

    A fast-rotator post-starburst galaxy quenched by supermassive black-hole feedback at z = 3. Nature Astronomy , keywords =. doi:10.1038/s41550-024-02345-1 , archivePrefix =. 2308.06317 , primaryClass =

  13. [13]

    , keywords =

    JWST reveals widespread AGN-driven neutral gas outflows in massive z 2 galaxies. , keywords =. doi:10.1093/mnras/stae327 , archivePrefix =. 2310.17939 , primaryClass =

  14. [14]

    , keywords =

    Exploring over 700 massive quiescent galaxies at z = 2─7: Demographics and stellar mass functions. , keywords =. doi:10.1051/0004-6361/202555829 , archivePrefix =. 2506.04119 , primaryClass =

  15. [15]

    2025, arXiv e-prints, arXiv:2506.22642, doi: 10.48550/arXiv.2506.22642

    DeepDive: A deep dive into the physics of the first massive quiescent galaxies in the Universe. arXiv e-prints , keywords =. doi:10.48550/arXiv.2506.22642 , archivePrefix =. 2506.22642 , primaryClass =

  16. [16]

    , keywords =

    Active Galactic Nucleus Feedback in Quiescent Galaxies at Cosmic Noon Traced by Ionized Gas Emission. , keywords =. doi:10.3847/1538-4357/adaeaf , archivePrefix =. 2406.08547 , primaryClass =

  17. [17]

    , keywords =

    Tracing the quenching journey across cosmic time. , keywords =. doi:10.1051/0004-6361/202349045 , archivePrefix =. 2401.06211 , primaryClass =

  18. [18]

    , keywords =

    Quenching massive galaxies across cosmic time with the semi-analytic model SHARK V2.0. , keywords =. doi:10.1093/mnras/stae1024 , archivePrefix =. 2309.02310 , primaryClass =

  19. [19]

    , keywords =

    Blowing Out the Candle: How to Quench Galaxies at High Redshift An Ensemble of Rapid Starbursts, AGN Feedback, and Environment. , keywords =. doi:10.3847/1538-4357/ad9472 , archivePrefix =. 2310.16085 , primaryClass =

  20. [20]

    Damped Lyman-Alpha Absorption by Disk Galaxies with Large Redshifts. I. The Lick Survey. , keywords =. doi:10.1086/191114 , adsurl =

  21. [21]

    The Neutral Atomic Phases of the ISM in the Galaxy

    Neutral Atomic Phases of the Interstellar Medium in the Galaxy. , keywords =. doi:10.1086/368016 , archivePrefix =. astro-ph/0207098 , primaryClass =

  22. [22]

    The cosmic evolution of dust-corrected metallicity in the neutral gas

    The cosmic evolution of dust-corrected metallicity in the neutral gas. , keywords =. doi:10.1051/0004-6361/201731970 , archivePrefix =. 1709.06578 , primaryClass =

  23. [23]

    , keywords =

    The Sloan Digital Sky Survey Quasar Catalog: Sixteenth Data Release. , keywords =. doi:10.3847/1538-4365/aba623 , archivePrefix =. 2007.09001 , primaryClass =

  24. [24]

    A connection between extremely strong Damped Lyman-alpha Systems and Lyman-alpha Emitting Galaxies at small impact parameters

    A connection between extremely strong damped Lyman- systems and Lyman- emitting galaxies at small impact parameters. , keywords =. doi:10.1051/0004-6361/201322809 , archivePrefix =. 1403.4115 , primaryClass =

  25. [25]

    The SDSS Damped Lya Survey: Data Release 3

    The SDSS Damped Ly Survey: Data Release 3. , keywords =. doi:10.1086/497287 , archivePrefix =. astro-ph/0508361 , primaryClass =

  26. [26]

    , keywords =

    Damped Lyman- absorbers from Sloan digital sky survey DR16Q with Gaussian processes. , keywords =. doi:10.1093/mnras/stab2169 , archivePrefix =. 2103.10964 , primaryClass =

  27. [27]

    Star formation thresholds and galaxy edges: why and where

    Star Formation Thresholds and Galaxy Edges: Why and Where. , keywords =. doi:10.1086/421232 , archivePrefix =. astro-ph/0205125 , primaryClass =

  28. [28]

    A survey of interstellar molecular hydrogen. I. , keywords =. doi:10.1086/155471 , adsurl =

  29. [29]

    , keywords =

    X-shooter observations of strong H _ 2 -bearing DLAs at high redshift. , keywords =. doi:10.1093/mnras/stz2707 , archivePrefix =. 1909.11064 , primaryClass =

  30. [30]

    , keywords =

    First detection of CO in a high-redshift damped Lyman- system. , keywords =. doi:10.1051/0004-6361:200809727 , archivePrefix =. 0804.0116 , primaryClass =

  31. [31]

    Spotting high-z molecular absorbers using neutral carbon: Results from a complete spectroscopic survey with the VLT

    Spotting high-z molecular absorbers using neutral carbon. Results from a complete spectroscopic survey with the VLT. , keywords =. doi:10.1051/0004-6361/201732266 , archivePrefix =. 1801.08357 , primaryClass =

  32. [32]

    Gaia-assisted selection of a quasar reddened by dust in an extremely-strong Damped Lyman-{\alpha} Absorber at z=2.226

    Gaia-assisted selection of a quasar reddened by dust in an extremely strong damped Lyman- absorber at z = 2.226. , keywords =. doi:10.1051/0004-6361/201935108 , archivePrefix =. 1904.01686 , primaryClass =

  33. [33]

    , keywords =

    Microwave background temperature at a redshift of 6.34 from H _ 2 O absorption. , keywords =. doi:10.1038/s41586-021-04294-5 , archivePrefix =. 2202.00693 , primaryClass =

  34. [34]

    A computer program for fast non-LTE analysis of interstellar line spectra

    A computer program for fast non-LTE analysis of interstellar line spectra. With diagnostic plots to interpret observed line intensity ratios. , keywords =. doi:10.1051/0004-6361:20066820 , archivePrefix =. 0704.0155 , primaryClass =

  35. [35]

    , keywords =

    An Extremely Bright QSO at z = 2.89. , keywords =. doi:10.3847/1538-4357/ab9c95 , archivePrefix =. 2006.11915 , primaryClass =

  36. [36]

    Unidentified quasars among stationary objects from Gaia DR2

    Unidentified quasars among stationary objects from Gaia DR2. , keywords =. doi:10.1051/0004-6361/201833396 , archivePrefix =. 1805.03394 , primaryClass =

  37. [37]

    Experimental Astronomy , keywords =

    Cosmology and fundamental physics with the ELT-ANDES spectrograph. Experimental Astronomy , keywords =. doi:10.1007/s10686-024-09928-w , archivePrefix =. 2311.16274 , primaryClass =

  38. [38]

    , year = 2024, month = sep, volume =

    Excitation of CO molecules in diffuse gas over cosmic history. , year = 2024, month = sep, volume =. doi:10.1093/mnras/stae1863 , adsurl =

  39. [39]

    , keywords =

    The Completed Sloan Digital Sky Survey IV Extended Baryon Oscillation Spectroscopic Survey: The Damped Ly Systems Catalog. , keywords =. doi:10.3847/1538-4365/ac366e , archivePrefix =. 2107.09612 , primaryClass =

  40. [40]

    doi:10.1038/s41586-025-08779-5 , eprint =

    , keywords =. doi:10.1038/s41586-025-08779-5 , eprint =

  41. [41]

    arXiv , author =:2411.18680 , journal =

    doi:10.3847/2041-8213/adaf95 , eid =. arXiv , author =:2411.18680 , journal =

  42. [42]

    arXiv , author =:2407.20861 , journal =

    doi:10.3847/1538-4357/ad6980 , eid =. arXiv , author =:2407.20861 , journal =

  43. [43]

    arXiv , author =:2306.05648 , journal =

    doi:10.1088/1674-4527/ad0864 , eid =. arXiv , author =:2306.05648 , journal =

  44. [44]

    arXiv , author =:2501.11702 , journal =

    doi:10.1051/0004-6361/202553820 , eid =. arXiv , author =:2501.11702 , journal =

  45. [45]

    Census of

    doi:10.3847/1538-4365/adc690 , eid =. arXiv , author =:2501.05834 , journal =

  46. [46]

    arXiv , author =:2409.02989 , journal =

    doi:10.3847/1538-4357/ada152 , eid =. arXiv , author =:2409.02989 , journal =

  47. [47]

    arXiv , author =:2312.06804 , journal =

    doi:10.3847/1538-4357/ad38c2 , eid =. arXiv , author =:2312.06804 , journal =

  48. [48]

    arXiv , author =:2504.12504 , journal =

    doi:10.3847/2041-8213/ade8f5 , eid =. arXiv , author =:2504.12504 , journal =

  49. [49]

    doi:10.1093/mnras/staf1699 , eprint =

    , keywords =. doi:10.1093/mnras/staf1699 , eprint =

  50. [50]

    doi:10.1093/mnras/stae2633 , eprint =

    , keywords =. doi:10.1093/mnras/stae2633 , eprint =

  51. [51]

    arXiv , author =:2402.11220 , journal =

    doi:10.1051/0004-6361/202449644 , eid =. arXiv , author =:2402.11220 , journal =

  52. [52]

    arXiv , author =:2504.04683 , journal =

    doi:10.3847/1538-4357/ae232b , eid =. arXiv , author =:2504.04683 , journal =

  53. [53]

    doi:10.1038/s41586-024-07860-9 , eprint =

    , keywords =. doi:10.1038/s41586-024-07860-9 , eprint =

  54. [54]

    arXiv , author =:2404.02879 , journal =

    doi:10.1088/1475-7516/2024/07/078 , eid =. arXiv , author =:2404.02879 , journal =

  55. [55]

    Probing Reionization-Era Galaxies with

    Probing reionization-era galaxies with JWST UV luminosity functions and large-scale clustering. , keywords =. doi:10.1088/1475-7516/2026/01/008 , archivePrefix =. 2503.07590 , primaryClass =

  56. [56]

    Behroozi, P. et al. , year=. MNRAS , volume=

  57. [57]

    and Garaldi, E

    , keywords =. doi:10.1093/mnras/stab3710 , eprint =

  58. [58]

    doi:10.1093/mnras/stac1942 , eprint =

    , keywords =. doi:10.1093/mnras/stac1942 , eprint =

  59. [59]

    doi:10.1093/mnras/stac3280 , eprint =

    , keywords =. doi:10.1093/mnras/stac3280 , eprint =

  60. [60]

    arXiv , author =:2405.13108 , journal =

    doi:10.3847/1538-4357/ad7b36 , eid =. arXiv , author =:2405.13108 , journal =

  61. [61]

    doi:10.1093/mnras/staf1692 , eprint =

    , keywords =. doi:10.1093/mnras/staf1692 , eprint =

  62. [62]

    2023, MNRAS, 523, 3201, doi: 10.1093/mnras/stad1557

    Efficient formation of massive galaxies at cosmic dawn by feedback-free starbursts. , keywords =. doi:10.1093/mnras/stad1557 , archivePrefix =. 2303.04827 , primaryClass =

  63. [63]

    Sun, G. et al. , year=. ApJ , volume=

  64. [64]

    Gelli, V. et al. , year=. MNRAS , volume=

  65. [65]

    Li, Z. et al. , year=. ApJ , volume=

  66. [66]

    Yung, L. Y. A. et al. , year=. MNRAS , volume=

  67. [67]

    Feldmann, R. et al. , year=. MNRAS , inpress=

  68. [68]

    , keywords =

    The z 9 Galaxy UV Luminosity Function from the JWST Advanced Deep Extragalactic Survey: Insights into Early Galaxy Evolution and Reionization. , keywords =. doi:10.3847/1538-4357/adfddc , archivePrefix =. 2501.00984 , primaryClass =

  69. [69]

    doi:10.1093/mnras/stz1182 , eprint =

    , keywords =. doi:10.1093/mnras/stz1182 , eprint =

  70. [70]

    arXiv , author =:2203.10895 , journal =

    doi:10.1051/0004-6361/202243136 , eid =. arXiv , author =:2203.10895 , journal =

  71. [71]

    arXiv , author =:2103.16571 , journal =

    doi:10.3847/1538-4357/ac1bb6 , eid =. arXiv , author =:2103.16571 , journal =

  72. [72]

    doi:10.1093/mnras/stac028 , eprint =

    , keywords =. doi:10.1093/mnras/stac028 , eprint =

  73. [73]

    doi:10.1093/mnras/sty1655 , eprint =

    , keywords =. doi:10.1093/mnras/sty1655 , eprint =

  74. [74]

    doi:10.1093/mnras/stab2148 , eprint =

    , keywords =. doi:10.1093/mnras/stab2148 , eprint =

  75. [75]

    and Kannan, R

    , keywords =. doi:10.1093/mnras/stac257 , eprint =

  76. [76]

    doi:10.1093/mnras/stad210 , eprint =

    , keywords =. doi:10.1093/mnras/stad210 , eprint =

  77. [77]

    arXiv , author =:2110.05508 , journal =

    doi:10.3847/2041-8213/ac3333 , eid =. arXiv , author =:2110.05508 , journal =

  78. [78]

    C., Kim, J.-G., & Kim, C.-G

    doi:10.3847/1538-4357/abf8ac , eid =. arXiv , author =:2104.07722 , journal =

  79. [79]

    C., Kim, J.-G., & Kim, C.-G

    doi:10.3847/1538-4357/abf8ab , eid =. arXiv , author =:2104.07691 , journal =

  80. [80]

    doi:10.1093/mnras/stz2773 , eprint =

    , keywords =. doi:10.1093/mnras/stz2773 , eprint =

Showing first 80 references.