Magnitude-Based Features for Multispecies Spatial Data
Pith reviewed 2026-06-27 07:52 UTC · model grok-4.3
The pith
Magnitude of metric spaces produces feature vectors that capture interactions in multispecies spatial data such as tumor microenvironments.
A machine-rendered reading of the paper's core claim, the machinery that carries it, and where it could break.
Core claim
Global and local magnitude feature vectors applied to multispecies point sets as finite metric spaces recover known classifications of long-term simulation outcomes across parameter regimes and highlight the importance of CD4+ T cells and CD163+ macrophages in distinguishing favourable from unfavourable immune infiltration patterns in colorectal cancer samples.
What carries the argument
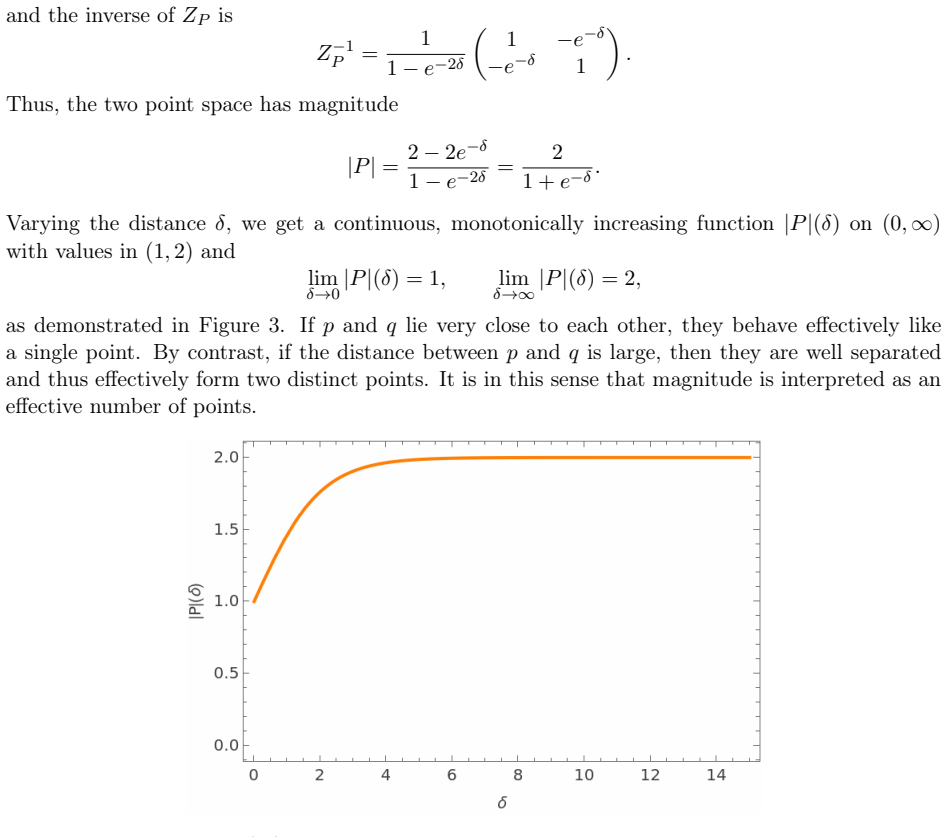
Magnitude, a real-valued invariant of finite metric spaces interpreted as an effective number of points that incorporates spatial configuration and scale.
If this is right
- Local magnitude vectors identify distinct neighbourhood types and spatial heterogeneity including radial patterns tied to simulation outcomes.
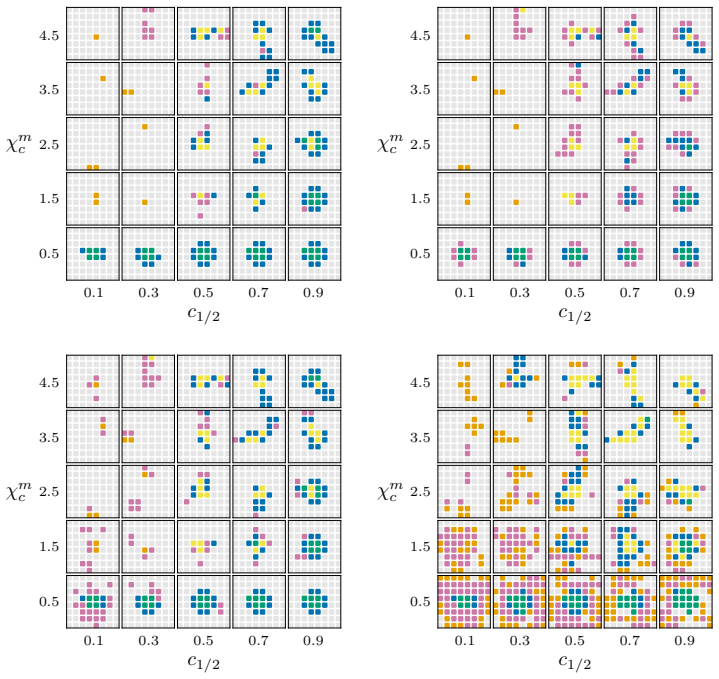
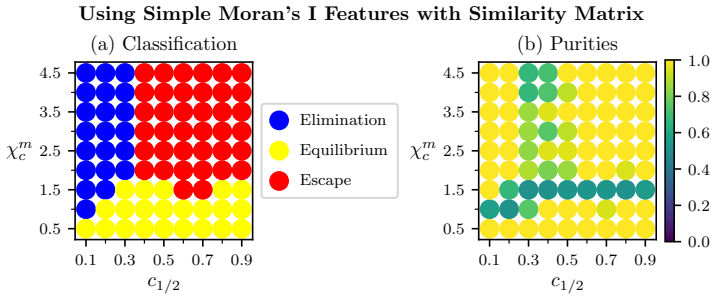
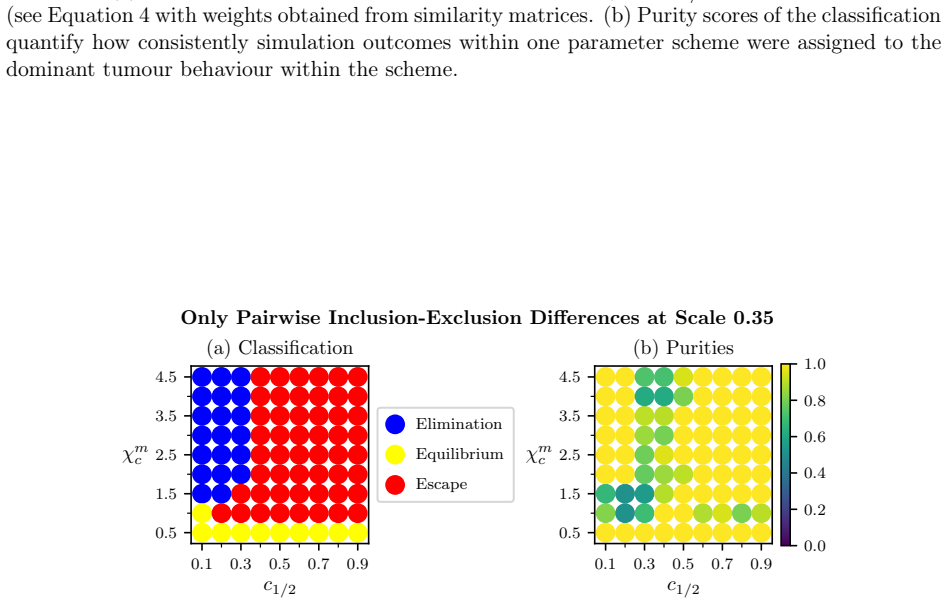
- Global magnitude vectors recover classifications of long-term outcomes across different parameter regimes in synthetic data.
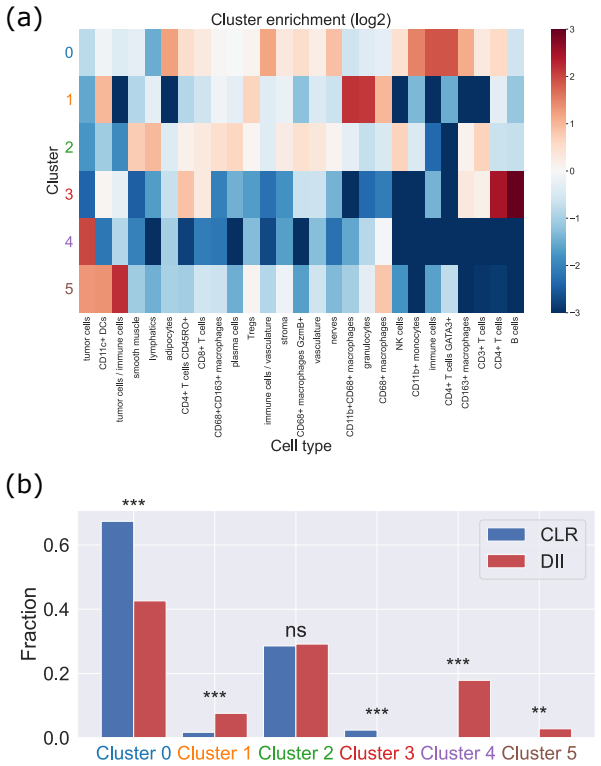
- The features indicate key roles for CD4+ T cells and CD163+ macrophages in separating patient groups by immune reaction type.
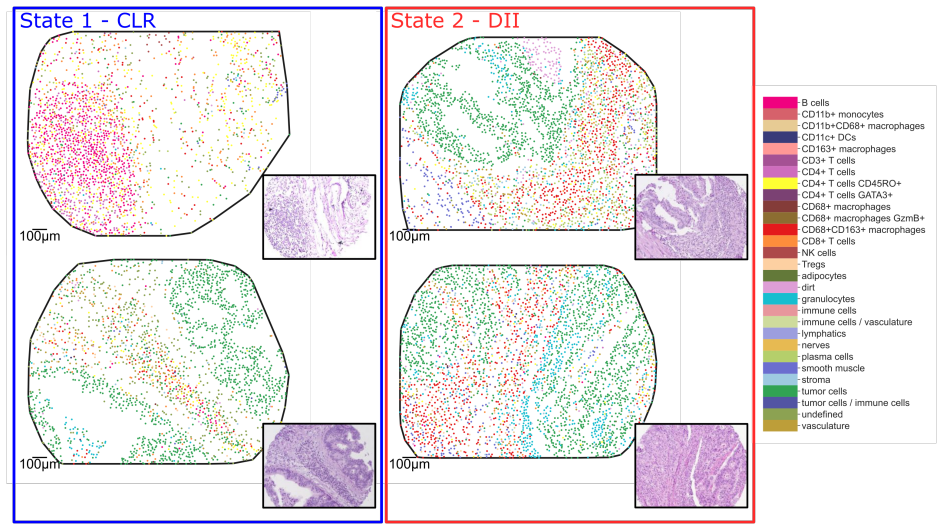
- In tissue data the approach surfaces tertiary lymphoid structure-like interactions between B and T cell populations.
Where Pith is reading between the lines
- The same magnitude vectors could be applied to multispecies ecological count data to quantify interaction scales without new domain models.
- Varying the underlying distance function to encode different biological rules would test whether the extracted features remain stable.
- Applying the method to time-series snapshots of cell positions could track how effective point counts evolve during disease progression.
Load-bearing premise
Representing multispecies point sets as finite metric spaces with a distance that encodes biological interactions lets magnitude extract the relevant spatial structure without extra tuning.
What would settle it
A dataset of known distinct tumor simulation outcomes or patient groups where magnitude features computed from a biologically plausible distance fail to separate the classes.
Figures


read the original abstract
Multispecies spatial data arise in many applications where interactions between different entities are central to system behaviour, including biomedical imaging, geospatial analysis, and species ecology. Despite their importance, relatively few quantitative tools exist to capture such interactions. In this work, we propose magnitude-based features for the analysis of multispecies spatial data. Magnitude is a real-valued invariant of finite metric spaces that can be interpreted as an effective number of points, incorporating both spatial configuration and scale. We develop global and local magnitude feature vectors and demonstrate their utility on synthetic tumour microenvironment data, and in tissue microarray data from human colorectal cancer samples. Locally, the method identifies distinct neighbourhood types and reveals spatial heterogeneity; in the model, this includes radial patterns associated with different qualitative outcomes of the simulations, while in the real-world data it reflects the importance of tertiary lymphoid structure-like interactions between B and T cell populations. Globally, the approach recovers known classifications of long-term simulation outcomes across parameter regimes in synthetic data, and suggests important roles for CD4+ T cells and CD163+ macrophages in distinguishing patients with favourable Crohn's like reactions from unfavourable diffuse immune infiltration. Together, these results suggest that magnitude-based features provide a powerful and flexible tool for the analysis of multispecies spatial data.
Editorial analysis
A structured set of objections, weighed in public.
Referee Report
Summary. The manuscript proposes magnitude-based features for multispecies spatial data by representing point sets as finite metric spaces and computing the magnitude invariant (effective number of points) to capture spatial configuration and scale. It develops global and local magnitude feature vectors, applies them to synthetic tumour microenvironment simulations and real colorectal cancer tissue microarray data, and claims that local features identify neighbourhood types and spatial heterogeneity (including radial patterns and B-T cell interactions in tertiary lymphoid structures) while global features recover simulation outcome classifications and distinguish patient groups by immune cell roles.
Significance. If the central claims hold after addressing the metric construction, the work would provide a mathematically grounded, interpretable tool for quantifying interactions in multispecies point patterns, extending the magnitude invariant from pure mathematics to applied spatial analysis in biomedicine and ecology. The combination of synthetic parameter sweeps with real patient data is a positive aspect for demonstrating utility.
major comments (1)
- [Methods (metric space construction for multispecies points)] The construction of the finite metric space for multispecies data is load-bearing for the claim that magnitude extracts relevant structure 'without additional domain-specific tuning.' The inter-species distance must incorporate both Euclidean separation and cell-type identity, which typically requires at least one scaling parameter; the manuscript should explicitly define this distance (likely in the Methods section on metric spaces) and demonstrate that downstream results (neighbourhood identification, patient separation) are insensitive to its value. Without such evidence the flexibility claim reduces to standard feature engineering.
minor comments (1)
- [Abstract] The abstract asserts recovery of 'known classifications of long-term simulation outcomes across parameter regimes' and 'important roles for CD4+ T cells and CD163+ macrophages' but does not reference specific figures, tables, or quantitative metrics (e.g., classification accuracy, feature importance scores) that would allow immediate assessment of effect sizes.
Simulated Author's Rebuttal
We thank the referee for their constructive review and for identifying the metric construction as a key point requiring clarification. We address the major comment below and will revise the manuscript accordingly.
read point-by-point responses
-
Referee: [Methods (metric space construction for multispecies points)] The construction of the finite metric space for multispecies data is load-bearing for the claim that magnitude extracts relevant structure 'without additional domain-specific tuning.' The inter-species distance must incorporate both Euclidean separation and cell-type identity, which typically requires at least one scaling parameter; the manuscript should explicitly define this distance (likely in the Methods section on metric spaces) and demonstrate that downstream results (neighbourhood identification, patient separation) are insensitive to its value. Without such evidence the flexibility claim reduces to standard feature engineering.
Authors: We agree that an explicit definition of the metric is necessary to support the claim of operating without domain-specific tuning. In the revised manuscript we will add a dedicated paragraph in the Methods section on metric spaces that defines the distance between two points (x, type_i) and (y, type_j) as the Euclidean distance ||x-y|| when type_i = type_j, and ||x-y|| + c when type_i ≠ type_j, where c is a fixed offset set to the median nearest-neighbour distance observed across all cells in the given imaging modality (approximately 10–15 µm for the colorectal TMA data). This choice is determined once from the data resolution and is not re-tuned per analysis or per patient. We will also add a short sensitivity study in the supplement showing that the Silhouette scores for neighbourhood clustering and the separation of the two patient subgroups (via global magnitude features) remain qualitatively unchanged for c values in [0.5c, 1.5c]. These additions directly address the referee’s request and strengthen rather than weaken the flexibility claim. revision: yes
Circularity Check
No significant circularity; magnitude applied as external invariant to new data domain
full rationale
The paper introduces magnitude-based features by applying the established magnitude invariant of finite metric spaces (an external concept from metric geometry) to multispecies point clouds. The central claims concern the utility of these features on synthetic and real biological data after equipping the spaces with a distance that encodes interactions. No equations or steps in the abstract or described chain reduce the reported classifications, neighbourhood identifications, or performance claims to self-definitions, fitted parameters renamed as predictions, or self-citation chains. The distance construction is a modeling choice whose sensitivity is not demonstrated to be zero, but this is a standard assumption in feature engineering rather than a circular reduction of the derivation itself. The work is therefore self-contained against external benchmarks.
Axiom & Free-Parameter Ledger
axioms (1)
- standard math Magnitude is a real-valued invariant of finite metric spaces that can be interpreted as an effective number of points, incorporating both spatial configuration and scale.
Reference graph
Works this paper leans on
-
[1]
Stopover captures spatial colocalization and interaction in the tumor microenvironment using topological analysis in spatial transcriptomics data.Genome Medicine, 17(1):33, 2025
Sungwoo Bae, Hyekyoung Lee, Kwon Joong Na, Dong Soo Lee, Hongyoon Choi, and Young Tae Kim. Stopover captures spatial colocalization and interaction in the tumor microenvironment using topological analysis in spatial transcriptomics data.Genome Medicine, 17(1):33, 2025
2025
-
[2]
Defining and modeling dynamic spatial heterogeneity within tumor microenvironments.Current Opinion in Cell Biology, 90:102422, 2024
Bethany Bareham, Matthew Dibble, and Maddy Parsons. Defining and modeling dynamic spatial heterogeneity within tumor microenvironments.Current Opinion in Cell Biology, 90:102422, 2024
2024
-
[3]
Quantitative char- 18 acterization of cell niches in spatially resolved omics data.Nature Genetics, 57(4):897–909, 2025
Sebastian Birk, Irene Bonafonte-Pardàs, Adib Miraki Feriz, Adam Boxall, Eneritz Agirre, Fani Memi, Anna Maguza, Anamika Yadav, Erick Armingol, Rong Fan, et al. Quantitative char- 18 acterization of cell niches in spatially resolved omics data.Nature Genetics, 57(4):897–909, 2025
2025
-
[4]
Agent-based modeling: Methods and techniques for simulating human systems
Eric Bonabeau. Agent-based modeling: Methods and techniques for simulating human systems. Proceedings of the national academy of sciences, 99(suppl_3):7280–7287, 2002
2002
-
[5]
Bull and H.M
J.A. Bull and H.M. Byrne. Quantification of spatial and phenotypic heterogeneity in an agent-based model of tumour-macrophage interactions.PLOS Computational Biology, 3(19):e1010994, 2023
2023
-
[6]
Bull, Joshua W
Joshua A. Bull, Joshua W. Moore, Shania M. Corry, Muyang Lin, Hayley L. Belnoue-Davis, Eoghan J. Mulholland-Illingworth, Simon J. Leedham, and Helen M. Byrne. MuSpAn: A Toolbox for Multiscale Spatial Analysis. February 2025
2025
-
[7]
Extended correlation functions for spatial analysis of multiplex imaging data.Biological Imaging, 4:e2, 2024
Joshua A Bull, Eoghan J Mulholland, Simon J Leedham, and Helen M Byrne. Extended correlation functions for spatial analysis of multiplex imaging data.Biological Imaging, 4:e2, 2024
2024
-
[8]
Spatial computation of intratumoral t cells correlates with survival of patients with pancreatic cancer.Nature communications, 8(1):15095, 2017
Julienne L Carstens, Pedro Correa de Sampaio, Dalu Yang, Souptik Barua, Huamin Wang, Arvind Rao, James P Allison, Valerie S LeBleu, and Raghu Kalluri. Spatial computation of intratumoral t cells correlates with survival of patients with pancreatic cancer.Nature communications, 8(1):15095, 2017
2017
-
[9]
Spatial multiplexing and omics.Nature Reviews Methods Primers, 4(1):54, 2024
JulienneLCarstens, SanthoshiNKrishnan, ArvindRao, AnnaGSorace, ErinHSeeley, Sammy Ferri-Borgogno, and Jared K Burks. Spatial multiplexing and omics.Nature Reviews Methods Primers, 4(1):54, 2024
2024
-
[10]
di Montesano, O
S.C. di Montesano, O. Draganov, H. Edelsbrunner, and M. Saghafian. Chromatic alpha com- plexes.Foundations of Data Science, 2025
2025
-
[11]
Yaoying Fu, Evgeniya Lagoda, Shiying Li, Tom Needham, Lander Ver Hoef, and Morgan Weiler. Persistent homology for labeled datasets: Gromov-hausdorff stability and generalized landscapes.arXiv preprint arXiv:2512.08794, 2025
arXiv 2025
-
[12]
Deep profiling of mouse splenic architecture with codex multiplexed imaging.Cell, 174(4):968–981, 2018
Yury Goltsev, Nikolay Samusik, Julia Kennedy-Darling, Salil Bhate, Matthew Hale, Gustavo Vazquez, Sarah Black, and Garry P Nolan. Deep profiling of mouse splenic architecture with codex multiplexed imaging.Cell, 174(4):968–981, 2018
2018
-
[13]
Govc and R
D. Govc and R. Hepworth. Persistent magnitude.Journal of Pure and Applied Algebra, 225, 2021
2021
-
[14]
Accessories to the crime: functions of cells recruited to the tumor microenvironment.Cancer cell, 21(3):309–322, 2012
Douglas Hanahan and Lisa M Coussens. Accessories to the crime: functions of cells recruited to the tumor microenvironment.Cancer cell, 21(3):309–322, 2012
2012
-
[15]
The cell biologist’s guide to super-resolution microscopy.Journal of cell science, 133(11):jcs240713, 2020
Guillaume Jacquemet, Alexandre F Carisey, Hellyeh Hamidi, Ricardo Henriques, and Christophe Leterrier. The cell biologist’s guide to super-resolution microscopy.Journal of cell science, 133(11):jcs240713, 2020
2020
-
[16]
Method of the year 2024: spatial proteomics.Nat Methods, 21(2195-2196):1, 2024
ELHAM Karimi, N Simo, N Milet, W Te, A Alsh, N Qu, L Ail, R Abs, A Alind, NM Goodma, et al. Method of the year 2024: spatial proteomics.Nat Methods, 21(2195-2196):1, 2024
2024
-
[17]
Leinster
T. Leinster. The euler characteristic of a category.Documenta Mathematica, 13:21–49, 2008. 19
2008
-
[18]
Leinster and C
T. Leinster and C. A. Cobbold. Measuring diversity: the importance of species similarity. Ecology, 93:477–489, 2012
2012
-
[19]
Leinster and S
T. Leinster and S. Willerton. On the asymptotic magnitude of subsets of euclidean space. Geometriae Dedicata, 164:87–310, 2013
2013
-
[20]
The magnitude of metric spaces.Documenta Mathematica, 18:857–905, 2013
Tom Leinster. The magnitude of metric spaces.Documenta Mathematica, 18:857–905, 2013
2013
-
[21]
Spatial omics and multiplexed imaging to explore cancer biology.Nature methods, 18(9):997–1012, 2021
Sabrina M Lewis, Marie-Liesse Asselin-Labat, Quan Nguyen, Jean Berthelet, Xiao Tan, Ver- ena C Wimmer, Delphine Merino, Kelly L Rogers, and Shalin H Naik. Spatial omics and multiplexed imaging to explore cancer biology.Nature methods, 18(9):997–1012, 2021
2021
-
[22]
Metric space magnitude for evaluating the diversity of latent representations
Katharina Limbeck, Rayna Andreeva, Rik Sarkar, and Bastian Rieck. Metric space magnitude for evaluating the diversity of latent representations. InProceedings of the 38th International Conference on Neural Information Processing Systems, NIPS ’24. Curran Associates Inc., 2025
2025
-
[23]
M.W. Meckes. Magnitude, diversity, capacities, and dimensions of metric spaces.Potential Analysis, 42:549–572, 2015
2015
-
[24]
The emerging landscape of spatial profiling technologies.Nature Reviews Genetics, 23(12):741–759, 2022
Jeffrey R Moffitt, Emma Lundberg, and Holger Heyn. The emerging landscape of spatial profiling technologies.Nature Reviews Genetics, 23(12):741–759, 2022
2022
-
[25]
Patrick A. P. Moran. Notes on continuous stochastic phenomena.Biometrika, 37(1–2):17–23, 1950
1950
-
[26]
Topology of multi-species localization.arXiv preprint arXiv:2603.03237, 2026
Abhinav Natarajan, Thomas Chaplin, Joshua A Bull, Eoghan J Mulholland-Illingworth, Si- mon J Leedham, Helen M Byrne, Maria-Jose Jimenez, and Heather A Harrington. Topology of multi-species localization.arXiv preprint arXiv:2603.03237, 2026
arXiv 2026
-
[27]
Alpha magnitude.Journal of Pure and Applied Algebra, 227(11):107396, 2023
Miguel O’Malley, Sara Kalisnik, and Nina Otter. Alpha magnitude.Journal of Pure and Applied Algebra, 227(11):107396, 2023
2023
-
[28]
Magnitude meets persistence
Nina Otter. Magnitude meets persistence. Homology theories for filtered simplicial sets.Ho- mology, Homotopy and Applications, 24:401–423, 2022
2022
-
[29]
Squidpy: a scalable framework for spatial omics analysis.Nature methods, 19(2):171–178, 2022
Giovanni Palla, Hannah Spitzer, Michal Klein, David Fischer, Anna Christina Schaar, Louis Benedikt Kuemmerle, Sergei Rybakov, Ignacio L Ibarra, Olle Holmberg, Isaac Virshup, et al. Squidpy: a scalable framework for spatial omics analysis.Nature methods, 19(2):171–178, 2022
2022
-
[30]
Spatial omics technologies at multimodal and single cell/subcellular level.Genome biology, 23(1):256, 2022
Jiwoon Park, Junbum Kim, Tyler Lewy, Charles M Rice, Olivier Elemento, André F Rendeiro, and Christopher E Mason. Spatial omics technologies at multimodal and single cell/subcellular level.Genome biology, 23(1):256, 2022
2022
-
[31]
Spatial analysisofmalignant-immunecellinteractionsinthetumormicroenvironmentusingtopological data analysis.bioRxiv, pages 2025–03, 2025
Seol Ah Park, Yongsoo Kim, Paweł Dłotko, Davide Gurnari, and Jooyoung Hahn. Spatial analysisofmalignant-immunecellinteractionsinthetumormicroenvironmentusingtopological data analysis.bioRxiv, pages 2025–03, 2025
2025
-
[32]
Methods to determine and analyze the cellular spatial distribution ex- tracted from multiplex immunofluorescence data to understand the tumor microenvironment
Edwin Roger Parra. Methods to determine and analyze the cellular spatial distribution ex- tracted from multiplex immunofluorescence data to understand the tumor microenvironment. Frontiers in Molecular Biosciences, 8:668340, 2021. 20
2021
-
[33]
Pedregosa, G
F. Pedregosa, G. Varoquaux, A. Gramfort, V. Michel, B. Thirion, O. Grisel, M. Blondel, P. Prettenhofer, R. Weiss, V. Dubourg, J. Vanderplas, A. Passos, D. Cournapeau, M. Brucher, M. Perrot, and E. Duchesnay. Scikit-learn: Machine learning in Python.Journal of Machine Learning Research, 12:2825–2830, 2011
2011
-
[34]
Rey and Luc Anselin
Sergio J. Rey and Luc Anselin. PySAL: A Python Library of Spatial Analytical Methods.The Review of Regional Studies, 37(1):5–27, 2007
2007
-
[35]
Rousseeuw
Peter J. Rousseeuw. Silhouettes: A graphical aid to the interpretation and validation of cluster analysis.Journal of Computational and Applied Mathematics, 20:53–65, 1987
1987
-
[36]
Schürch, Salil S
Christian M. Schürch, Salil S. Bhate, Graham L. Barlow, Darci J. Phillips, Luca Noti, Inti Zlobec, Pauline Chu, Sarah Black, Janos Demeter, David R. McIlwain, Shigemi Kinoshita, Nikolay Samusik, Yury Goltsev, and Garry P. Nolan. Coordinated Cellular Neighborhoods Orchestrate Antitumoral Immunity at the Colorectal Cancer Invasive Front.Cell, 182(5):1341– 1...
2020
-
[37]
Solow and Stephen Polasky
Andrew R. Solow and Stephen Polasky. Measuring biological diversity.Environmental and Ecological Statistics, 1(2):95–103, Jun 1994
1994
-
[38]
Stolz, J
B.J. Stolz, J. Dhesi, J.A. Bull, H.A. Harrington, H.M. Byrne, and I.H.R. Yoon. Relational persistent homology for multispecies data with application to the tumor microenvironment. Bulletin of Mathematical Biology, 86(11):128, 2024
2024
-
[39]
Stolz, J
B.J. Stolz, J. Dhesi, and I.H.R. (https://github.com/irishryoon/multiplex_relations) Yoon. multiplex relations, 2023
2023
-
[40]
Tumor budding t-cell graphs: assessing the need for resection in pt1 colorectal cancer patients
Linda Studer, John-Melle Bokhorst, Iris Nagtegaal, Inti Zlobec, Heather Dawson, and Andreas Fischer. Tumor budding t-cell graphs: assessing the need for resection in pt1 colorectal cancer patients. InMedical Imaging with Deep Learning, 2023
2023
-
[41]
Magnitude distance: A geometric measure of dataset similarity, 2026
Sahel Torkamani, Henry Gouk, and Rik Sarkar. Magnitude distance: A geometric measure of dataset similarity, 2026
2026
-
[42]
Methods and applications for single-cell and spatial multi-omics.Nature Reviews Genetics, 24(8):494–515, 2023
Katy Vandereyken, Alejandro Sifrim, Bernard Thienpont, and Thierry Voet. Methods and applications for single-cell and spatial multi-omics.Nature Reviews Genetics, 24(8):494–515, 2023
2023
-
[43]
Multiparameter persistent homology landscapes identify immune cell spatial patterns in tumors.Proceedings of the National Academy of Sci- ences, 118(41):e2102166118, 2021
Oliver Vipond, Joshua A Bull, Philip S Macklin, Ulrike Tillmann, Christopher W Pugh, He- len M Byrne, and Heather A Harrington. Multiparameter persistent homology landscapes identify immune cell spatial patterns in tumors.Proceedings of the National Academy of Sci- ences, 118(41):e2102166118, 2021
2021
-
[44]
On the magnitude of spheres, surfaces and other homogeneous spaces.Ge- ometriae Dedicata, 168(1):291–310, Feb 2014
Simon Willerton. On the magnitude of spheres, surfaces and other homogeneous spaces.Ge- ometriae Dedicata, 168(1):291–310, Feb 2014
2014
-
[45]
Method of the year 2020: spatially resolved transcriptomics.Nat
A Xiaowei. Method of the year 2020: spatially resolved transcriptomics.Nat. Methods, 18(1):10–1038, 2021
2020
-
[46]
Topological classification of tumour-immune interactions and dynamics: J
Jingjie Yang, Heidi Fang, Jagdeep Dhesi, Iris HR Yoon, Joshua A Bull, Helen M Byrne, Heather A Harrington, and Gillian Grindstaff. Topological classification of tumour-immune interactions and dynamics: J. yang et al.Journal of mathematical biology, 91(3):25, 2025. 21
2025
-
[47]
Spatialheterogeneityinthetumormicroenvironment.Cold Spring Harbor perspectives in medicine, 6, 08 2016
Y.Yuan. Spatialheterogeneityinthetumormicroenvironment.Cold Spring Harbor perspectives in medicine, 6, 08 2016. 22 A Further Local Magnitude Variations and Comparisons Further categorisations of local neighbourhoods are given using more intricate non-topological fea- ture vectors using cell counts and pairwise distances, as well as different numbers of cl...
2016
discussion (0)
Sign in with ORCID, Apple, or X to comment. Anyone can read and Pith papers without signing in.