Evolving Spatial Weights for Cartographic Synthesis
Pith reviewed 2026-06-26 11:48 UTC · model grok-4.3
The pith
Evolutionary optimization of layer weights improves spatial coherence in composite maps over expert methods.
A machine-rendered reading of the paper's core claim, the machinery that carries it, and where it could break.
Core claim
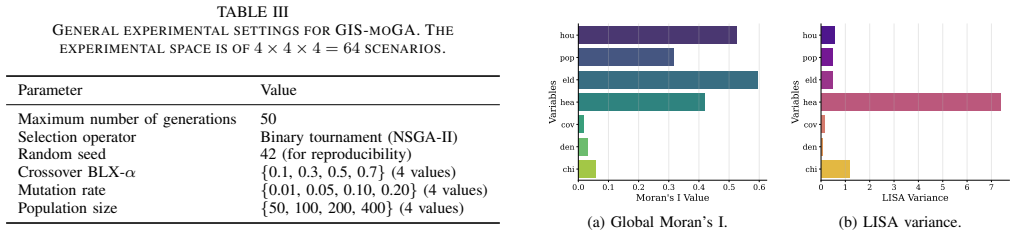
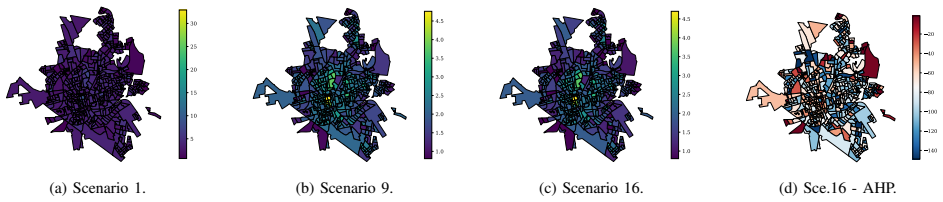
The GIS-moGA bi-objective evolutionary framework estimates layer weights for cartographic synthesis by simultaneously maximizing Global Moran's I and minimizing LISA variance, resulting in Pareto fronts with substantial hypervolume gains and significant improvements in spatial coherence compared to expert-derived Analytic Hierarchy Process baselines.
What carries the argument
GIS-moGA, a bi-objective evolutionary algorithm that exploits 97.7% sparsity in queen contiguity matrices to evaluate spatial autocorrelation objectives in O(N k) time.
Load-bearing premise
Maximizing Global Moran's I and minimizing LISA variance will produce weights that are meaningfully superior for creating composite maps.
What would settle it
A controlled comparison where decision makers use the resulting maps for a real task and show no improvement over AHP maps, or a direct test showing the statistics do not correlate with map utility.
Figures


read the original abstract
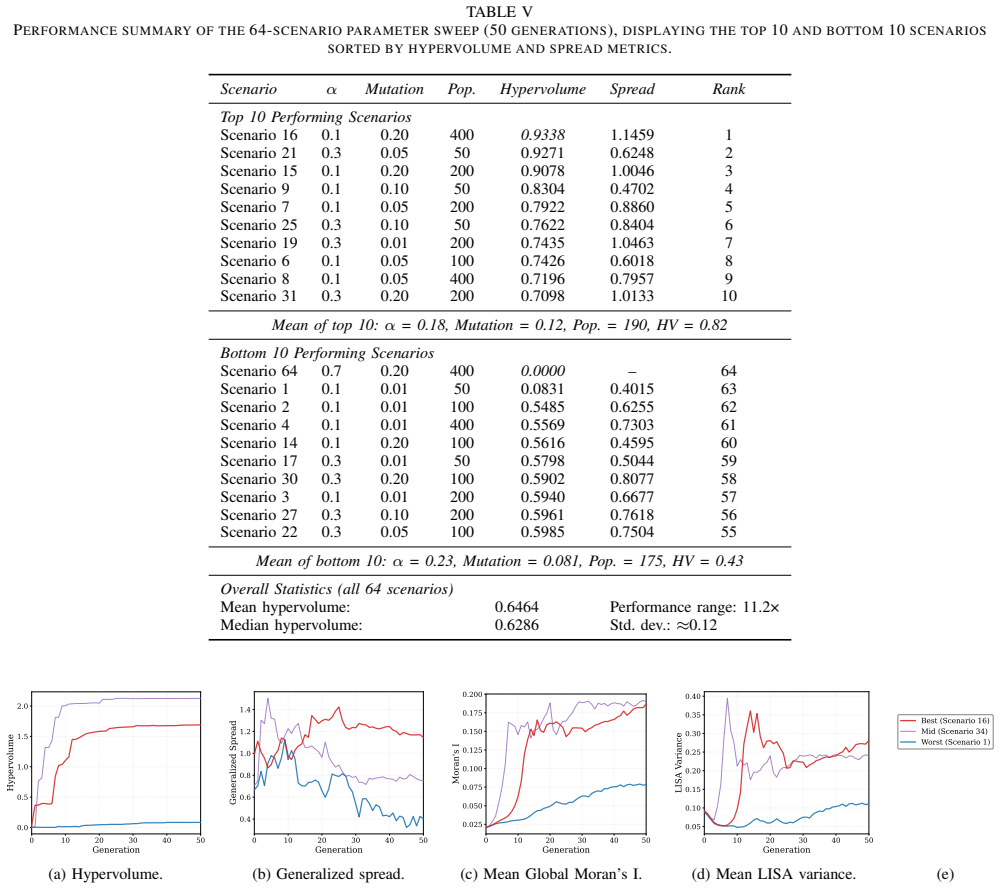
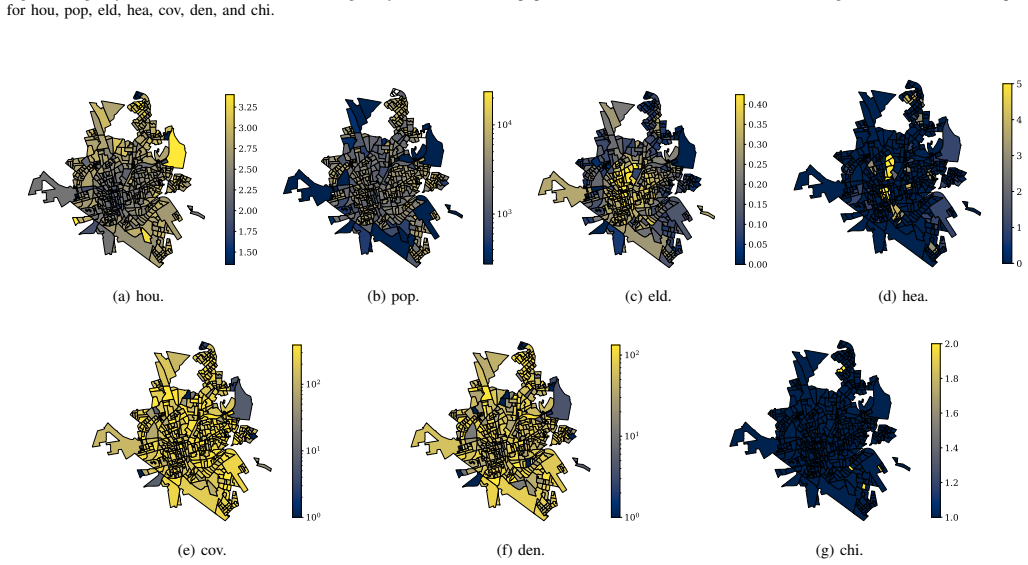
The integration of multiple thematic data layers into a single composite map, known as the cartographic synthesis problem, is typically addressed through expert-driven weighting schemes. This study presents a multi-objective formulation of cartographic synthesis grounded in spatial autocorrelation structure. We develop a bi-objective evolutionary framework, GIS-moGA, that estimates layer weights by simultaneously maximizing global spatial structure, measured by Global Moran's I, and minimizing local spatial heterogeneity, measured by the variance of Local Indicators of Spatial Association (LISA). Because naive evaluation of spatial relationships requires O(N^2) operations, direct computation becomes impractical for larger datasets. We address this challenge by exploiting the 97.7% sparsity of queen contiguity matrices, reducing effective complexity to O(N k) and enabling scalable municipal-level analysis. The framework is evaluated on a high-dimensional spatial epidemiology dataset with N = 523 units from Araraquara, Brazil. A 64-scenario experimental design is used to examine evolutionary behavior across parameter settings. Results show that higher mutation rates are important for maintaining population diversity and preventing premature convergence in spatially autocorrelated fitness landscapes, where crossover operators can disrupt geographically coherent structures. Compared with expert-derived Analytic Hierarchy Process baselines, the resulting Pareto fronts show substantial hypervolume gains and significant improvements in spatial coherence (p < 0.001, Cliff's delta = 0.87). These findings provide a systematic and scalable framework for data-driven geographic multi-criteria decision analysis.
Editorial analysis
A structured set of objections, weighed in public.
Referee Report
Summary. The paper presents GIS-moGA, a bi-objective evolutionary algorithm for cartographic synthesis that optimizes layer weights by maximizing Global Moran's I and minimizing LISA variance on a spatial epidemiology dataset (N=523). It exploits 97.7% sparsity in queen contiguity matrices for O(Nk) evaluation, compares Pareto fronts against expert AHP baselines via hypervolume and reports statistically significant spatial coherence gains (p<0.001, Cliff's delta=0.87), and examines GA parameters across 64 scenarios.
Significance. If validated with independent measures, the framework would offer a scalable, data-driven alternative to expert-driven weighting in geographic multi-criteria decision analysis, with practical value for municipal-level spatial epidemiology applications and a concrete demonstration of sparsity exploitation enabling larger-scale analysis.
major comments (2)
- [Abstract] Abstract: the reported 'significant improvements in spatial coherence (p < 0.001, Cliff's delta = 0.87)' are defined exactly by the two optimization objectives (Global Moran's I and LISA variance); this renders the superiority claim over AHP baselines circular and does not establish that the weights are meaningfully better for cartographic synthesis.
- [Abstract] Abstract and experimental design: no independent cartographic quality metric (e.g., expert usability ratings of composite maps, predictive performance on held-out outcomes, or decision-theoretic utility) is reported, so the hypervolume gains only confirm better optimization within the chosen objective space.
minor comments (1)
- [Abstract] The 64-scenario design is mentioned but lacks explicit description of how AHP baseline weights were elicited or whether they were tuned under the same spatial statistics.
Simulated Author's Rebuttal
We appreciate the referee's comments on the evaluation methodology. We provide point-by-point responses below and propose revisions to address the concerns.
read point-by-point responses
-
Referee: [Abstract] Abstract: the reported 'significant improvements in spatial coherence (p < 0.001, Cliff's delta = 0.87)' are defined exactly by the two optimization objectives (Global Moran's I and LISA variance); this renders the superiority claim over AHP baselines circular and does not establish that the weights are meaningfully better for cartographic synthesis.
Authors: We note that the reported significance is computed directly on the optimization objectives, which by design quantify spatial coherence via global and local autocorrelation. The AHP comparison demonstrates that the GA identifies weight vectors achieving better values on these established spatial statistics than expert-derived weights. This is not circular but illustrates the benefit of automated optimization over subjective weighting for the defined criteria. We will revise the abstract to clarify that gains are measured in the objective space and expand the introduction to justify these metrics as theoretically grounded proxies for cartographic synthesis quality. revision: yes
-
Referee: [Abstract] Abstract and experimental design: no independent cartographic quality metric (e.g., expert usability ratings of composite maps, predictive performance on held-out outcomes, or decision-theoretic utility) is reported, so the hypervolume gains only confirm better optimization within the chosen objective space.
Authors: The experimental design centers on optimization performance and Pareto front quality within the chosen bi-objective space, as the paper's contribution is the evolutionary framework for these spatial measures. No independent external metric is included. We will revise the abstract to temper claims accordingly and add an explicit limitations paragraph noting that future validation with expert ratings or predictive utility would strengthen applicability claims. revision: yes
Circularity Check
No significant circularity detected
full rationale
The paper formulates cartographic synthesis as a bi-objective optimization problem that directly maximizes Global Moran's I and minimizes LISA variance, then reports that the resulting Pareto fronts outperform AHP baselines on hypervolume and spatial coherence (the same two objectives). This is a standard optimizer-to-baseline comparison within the chosen objective space rather than any reduction of the result to its inputs by construction. No equations equate a claimed output to a fitted input, no self-citation chain bears the central premise, and no uniqueness theorem or ansatz is imported. The derivation remains self-contained: the evolutionary search is a non-trivial computation whose success on its own targets does not constitute circularity.
Axiom & Free-Parameter Ledger
free parameters (2)
- mutation rate
- GA hyperparameters (population size, generations, crossover rate)
axioms (1)
- domain assumption Queen contiguity matrix exhibits 97.7% sparsity, enabling O(Nk) evaluation
Reference graph
Works this paper leans on
-
[1]
Malczewski and C
J. Malczewski and C. Rinner,Multicriteria spatial decision analysis. Springer, 2015
2015
-
[2]
Openshaw,The modifiable areal unit problem
S. Openshaw,The modifiable areal unit problem. Geo Books, 1984
1984
-
[3]
O’Sullivan and D
D. O’Sullivan and D. J. Unwin,Geographic information analysis. John Wiley & Sons, 2003
2003
-
[4]
Fotheringham and P
S. Fotheringham and P. Rogerson,Spatial analysis and GIS. CRC Press, 2013
2013
-
[5]
T. L. Saaty,The analytic hierarchy process: planning, priority setting, resource allocation. McGraw-Hill, 1980
1980
-
[6]
Spatially explicit multi-objective optimization tool for green infrastructure planning based on invest and nsga-ii towards multifunctionality,
Y . Dong, S. Liu, X. Pei, and Y . Wang, “Spatially explicit multi-objective optimization tool for green infrastructure planning based on invest and nsga-ii towards multifunctionality,”Land use policy, vol. 150, p. 107465, 2025
2025
-
[7]
A fast and elitist multiobjective genetic algorithm: Nsga-ii,
K. Deb, A. Pratap, S. Agarwal, and T. Meyarivan, “A fast and elitist multiobjective genetic algorithm: Nsga-ii,”IEEE transactions on evolu- tionary computation, vol. 6, no. 2, pp. 182–197, 2002
2002
-
[8]
Performance assessment of multiobjective optimizers: An analysis and review,
E. Zitzler, L. Thiele, M. Laumanns, C. M. Fonseca, and V . G. Da Fon- seca, “Performance assessment of multiobjective optimizers: An analysis and review,”IEEE Transactions on evolutionary computation, vol. 7, no. 2, pp. 117–132, 2003
2003
-
[9]
Epidemiological dynamics of dengue and covid-19 co-circulation in brazil,
M. Barretoet al., “Epidemiological dynamics of dengue and covid-19 co-circulation in brazil,”The Lancet Regional Health-Americas, vol. 10, 2022
2022
-
[10]
Weighting methods for multi-criteria decision making tech- nique,
G. O. Odu, “Weighting methods for multi-criteria decision making tech- nique,”Journal of Applied Sciences and Environmental Management, vol. 23, no. 8, pp. 1449–1457, 2019
2019
-
[11]
D. U. Pfeiffer, T. P. Robinson, M. Stevenson, K. B. Stevens, D. J. Rogers, and A. C. Clements,Spatial analysis in epidemiology. Oxford University Press, 2008
2008
-
[12]
Anselin,Spatial econometrics: methods and models, ser
L. Anselin,Spatial econometrics: methods and models, ser. Studies in operational regional science. Springer, 1988, vol. 4
1988
-
[13]
Local indicators of spatial association—lisa,
——, “Local indicators of spatial association—lisa,”Geographical anal- ysis, vol. 27, no. 2, pp. 93–115, 1995
1995
-
[14]
R. L. Haupt and S. E. Haupt,Practical genetic algorithms. John Wiley & Sons, 2004
2004
-
[15]
Multiobjective evolutionary algorithms: a com- parative case study and the strength pareto approach,
E. Zitzler and L. Thiele, “Multiobjective evolutionary algorithms: a com- parative case study and the strength pareto approach,”IEEE transactions on Evolutionary Computation, vol. 3, no. 4, pp. 257–271, 1999
1999
-
[16]
Dengue in araraquara, state of s ˜ao paulo: epidemiology, climate and aedes aegypti infestation,
A. C. Ferreira, F. Chiaravalloti Neto, and A. Mondini, “Dengue in araraquara, state of s ˜ao paulo: epidemiology, climate and aedes aegypti infestation,”Revista de Sa ´ude P ´ublica, vol. 52, p. 18, 2018. (a) LISA. (b) Gi*. (c) Local Geary. Fig. B.2. Empirical distributions of the three local spatial association statistics—(a) LISA, (b) Getis-Ord Gi*, and...
2018
-
[17]
Methodologies for data quality assess- ment and improvement,
C. Batini and M. Scannapieco, “Methodologies for data quality assess- ment and improvement,”ACM Computing Surveys, vol. 41, pp. 1–52, 2009
2009
-
[18]
Modeling unstructured decision problems—the theory of analytical hierarchies,
T. L. Saaty, “Modeling unstructured decision problems—the theory of analytical hierarchies,”Mathematics and computers in simulation, vol. 20, no. 3, pp. 147–158, 1978
1978
-
[19]
A novel intelligent fuzzy-ahp based evolutionary algorithm for detecting communities in complex networks,
E. Pourabbasi, V . Majidnezhad, N. F. Veijouyeh, S. Taghavi Afshord, and Y . Jafari, “A novel intelligent fuzzy-ahp based evolutionary algorithm for detecting communities in complex networks,”Soft Computing, vol. 28, no. 11, pp. 7251–7269, 2024. (a) LISA. (b) Gi*. (c) Local Geary. Fig. B.5. Empirical distributions of the three local spatial association st...
2024
discussion (0)
Sign in with ORCID, Apple, or X to comment. Anyone can read and Pith papers without signing in.