Recognition: no theorem link
Catalogs of optically-selected clusters and photometric luminous red galaxies from the Hyper Suprime-Cam Subaru Strategic Program final year dataset
Pith reviewed 2026-05-16 21:24 UTC · model grok-4.3
The pith
The final Hyper Suprime-Cam dataset yields catalogs of more than 10,000 optically selected galaxy clusters and about 6 million photometric luminous red galaxies.
A machine-rendered reading of the paper's core claim, the machinery that carries it, and where it could break.
Core claim
We construct samples of optically-selected clusters and photometric luminous red galaxies from the Hyper Suprime-Cam Subaru Strategic Program final year dataset covering ∼1200 deg². The cluster catalogs extend out to the redshift of 1.38 and contain more than 10000 clusters with richness larger than 15, where the richness is defined to be a membership probability weighted number of galaxies above the stellar masses of approximately 10^{10.2}M_⊙. The total number of probable red cluster member galaxies in these clusters are more than 6×10^5. Photometric redshifts of the clusters are shown to be precise with the scatter better than ∼0.01 for a wide redshift range. We detect stacked weak lensed
What carries the argument
Richness, defined as the membership probability weighted number of galaxies above a stellar mass threshold of about 10^{10.2} solar masses, which selects cluster members and serves as a mass proxy.
Load-bearing premise
Color-based selection and photometric redshift estimates remain reliable with minimal bias or contamination across the full redshift range up to 1.38.
What would settle it
Spectroscopic observations of a subsample of high-redshift clusters revealing that the photometric redshift scatter exceeds 0.01 or that the stacked weak lensing signal is inconsistent with the reported mass-richness relation.
Figures


read the original abstract
We construct samples of optically-selected clusters and photometric luminous red galaxies (LRGs) from the Hyper Suprime-Cam Subaru Strategic Program final year dataset covering $\sim 1200$~deg$^2$. The cluster catalogs extend out to the redshift of $1.38$ and contain more than 10000 clusters with richness larger than $15$, where the richness is defined to be a membership probability weighted number of galaxies above the stellar masses of approximately $10^{10.2}M_\odot$. The total number of probable red cluster member galaxies in these clusters are more than $6\times 10^5$. Photometric redshifts of the clusters are shown to be precise with the scatter better than $\sim 0.01$ for a wide redshift range. We detect stacked weak lensing signals of clusters out to the redshift of $1$, and use them to update constraints on the mass-richness relation. Our catalog of about 6 million photometric LRGs extend out to the redshift of $1.25$, and have the scatter of the photometric redshift better than $\sim 0.02$ for the redshift range between $0.4$ and $1.0$.
Editorial analysis
A structured set of objections, weighed in public.
Referee Report
Summary. The manuscript constructs catalogs of optically-selected galaxy clusters and photometric luminous red galaxies from the Hyper Suprime-Cam Subaru Strategic Program final year dataset covering ~1200 deg². The cluster catalog contains more than 10,000 clusters with richness >15 (defined as membership-probability-weighted galaxy counts above ~10^10.2 M_⊙) extending to z=1.38, reports photo-z scatter better than ~0.01, detects stacked weak lensing signals to z=1 to update the mass-richness relation, and provides a catalog of ~6 million LRGs to z=1.25 with photo-z scatter better than ~0.02 for 0.4<z<1.0.
Significance. If the photo-z and membership calibrations hold, the catalogs represent a substantial increase in high-redshift optically selected clusters and LRGs over a wide area, enabling improved cosmological constraints and galaxy evolution studies; the weak-lensing mass calibration update is a clear strength for the cluster sample.
major comments (1)
- [photometric redshift validation and cluster membership section] The section describing cluster photo-z performance and membership probabilities: the reported scatter better than ~0.01 up to z=1.38 and the resulting richness values (>10k clusters, >6e5 members) are derived from color-based selection and photo-z weighting, but the manuscript shows only the scatter on the full sample without an independent spectroscopic validation set that is both (a) separate from the training set and (b) representative of the cluster environment at z≈1.2–1.38. This directly affects the reliability of the high-redshift richness and stacked lensing mass-richness relation.
minor comments (2)
- Clarify in the text whether the ~1200 deg² coverage represents the full final-year footprint after masking or a specific subset, and provide the exact effective area used for the cluster and LRG samples.
- [weak lensing section] In the weak-lensing results, specify the exact redshift bins used for the stacked signals and report the signal-to-noise or detection significance per bin to allow direct assessment of the mass-richness update.
Simulated Author's Rebuttal
We thank the referee for their thorough review and valuable comments on our manuscript. We address the major comment point by point below, clarifying our validation approach and indicating the revisions we will make.
read point-by-point responses
-
Referee: [photometric redshift validation and cluster membership section] The section describing cluster photo-z performance and membership probabilities: the reported scatter better than ~0.01 up to z=1.38 and the resulting richness values (>10k clusters, >6e5 members) are derived from color-based selection and photo-z weighting, but the manuscript shows only the scatter on the full sample without an independent spectroscopic validation set that is both (a) separate from the training set and (b) representative of the cluster environment at z≈1.2–1.38. This directly affects the reliability of the high-redshift richness and stacked lensing mass-richness relation.
Authors: We appreciate the referee pointing out the need for clearer validation details. The photo-z scatter is indeed reported for the full photometric sample, but this includes a cross-validation where the spectroscopic training set is split, with the validation portion held out and not used in training. This held-out set is representative of the general galaxy population. For cluster-specific performance, we have performed checks using spectroscopic redshifts of confirmed cluster members from overlapping surveys at z<1, showing consistent scatter. At z=1.2-1.38, while a large independent spectroscopic sample of cluster galaxies is not available (as noted in the literature due to observational challenges), the photo-z method relies on colors that are calibrated across environments, and the richness definition uses probability weighting to mitigate outliers. The stacked weak lensing detection to z=1 provides supporting evidence for the catalog reliability. In the revised manuscript, we will add a dedicated subsection detailing the training/validation split, present any available high-z spec comparisons, and discuss the potential impact on high-redshift results. This will strengthen the presentation without altering the core results. revision: partial
Circularity Check
Observational catalog paper with no load-bearing circular derivations
full rationale
This is a data release and catalog construction paper. Cluster richness is defined directly as a membership-probability-weighted count of galaxies above a stellar-mass threshold, and photometric redshifts are computed from standard color-based methods. No equations or results are presented as 'predictions' that reduce to the same fitted inputs by construction. The stacked weak-lensing mass-richness update uses external shear measurements and does not loop back to the selection function. Self-citations exist for prior HSC work but are not load-bearing for the central catalog numbers. Overall circularity is minimal (score 1).
Axiom & Free-Parameter Ledger
axioms (1)
- domain assumption Standard assumptions in photometric redshift estimation and optical cluster finding algorithms hold across the surveyed redshift range
Reference graph
Works this paper leans on
-
[1]
Publications of the Astronomical Society of Japan, 2024,00, 1–13 doi: 10.1093/pasj/xxx000 Advance access publication date: Catalogs of optically-selected clusters and photometric lu- minous red galaxies from the Hyper Suprime-Cam Subaru Strategic Program final year dataset Masamune OGURI, 1,2,∗ Yen-Ting LIN, 3 Nobuhiro OKABE, 4,5,6 Naomi OTA, 7 I-Non CHIU...
-
[2]
Photometric redshifts of the clusters are shown to be precise with the scatter better than∼0.01for a wide redshift range. We detect stacked weak lensing signals of clusters out to the redshift of1, and use them to update constraints on the mass-richness relation. Our catalog of about 6 million photometric LRGs extend out to the redshift of1.25, and have t...
work page 2024
-
[3]
Astronomical Society of Japan. arXiv:2512.13954v1 [astro-ph.CO] 15 Dec 2025 2Publications of the Astronomical Society of Japan(2024), Vol. 00, No. 0 ing weak gravitational lensing (see Oguri & Miyazaki 2025, for a review). Clusters of galaxies are efficiently identified from concentra- tions of red galaxies (e.g., Gladders & Yee 2000; Koester et al. 2007;...
work page internal anchor Pith review Pith/arXiv arXiv 2025
-
[4]
that makes use of the stellar pop- ulation synthesis model of Bruzual & Charlot (2003) to model the red-sequence, Oguri et al. (2018a) construct an optically-selected cluster catalog out to the redshift of1.1from the first-year (S16A) HSC-SSP dataset covering∼232deg
work page 2003
-
[5]
The mass-richness relation of CAMIRA clusters are calibrated by weak gravitational lens- ing (Murata et al. 2019; Chiu et al. 2020b) and clustering (Chiu et al. 2020a). Follow-up observations with X-ray (Ota et al
work page 2019
-
[6]
and the Sunyaev-Zel’dovich effect (Okabe et al. 2021; Kitayama et al
work page 2021
-
[7]
confirm that the hot gas is indeed associated with rich CAMIRA clusters. As the HSC-SSP survey progresses, the CAMIRA cluster catalog is continuously updated (e.g., Willis et al. 2021; Oguri et al. 2021; Klein et al. 2022; Hashiguchi et al. 2023; Toba et al. 2024; Chen et al. 2024). Wen & Han (2021) construct an independent cluster catalog from the HSC-SS...
work page 2021
-
[8]
We study the properties of our cluster catalogs, including the mis-centering and the mass- richness relation. In addition to the cluster catalogs, we construct catalogs of photometric luminous red galaxies (LRGs), which are byproducts of the CAMIRA algorithm to fit galaxy colors and red- shifts. The photometric LRG catalog from the first-year (S16A) HSC-S...
work page 2021
-
[9]
Catalogs will be made available at https://github.com/oguri/cluster_catalogs. 2 Data and method 2.1 HSC-SSP final year dataset The HSC-SSP is a wide-field optical imaging survey with the Hyper Suprime-Cam (HSC; Miyazaki et al. 2018; Komiyama et al. 2018; Furusawa et al
work page 2018
-
[10]
over more than 1,000 deg2 with a limiting magnitude ofi lim ∼26at5σfor point sources with a2 ′′ diameter aperture. The HSC-SSP observations are conduced in 2014–2021 and the data are reduced with hscPipe (Bosch et al. 2018). The HSC-SSP data are made publicly available through a series of data releases (Aihara et al. 2018a, 2019, 2022). The HSC-SSP final ...
work page 2014
-
[11]
Additionally we remove galaxies withz-bandcmodelmagnitude error larger than0.1
brighter thanz-band magnitudes of24. Additionally we remove galaxies withz-bandcmodelmagnitude error larger than0.1. As in Oguri et al. (2018a), we usecmodelmagni- tudes for magnitudes of galaxies, while the point spread function (PSF)-matched aperture photometry with the target PSF size of 1.′′3and the aperture of1. ′′5in diameter to avoid the deblending...
work page 2018
-
[12]
2.1), using a matching separation tolerance of1 ′′
We cross match these spectroscopic galaxies with photometric galaxies in the HSC-SSP with the bright star mask (see Sec. 2.1), using a matching separation tolerance of1 ′′. We remove any spec- troscopic galaxies with measurement error larger than0.01(1 + zspec). The numbers of spectroscopic galaxies that are cross- matched are 2925976 for Wide and 172930 ...
work page 2014
-
[13]
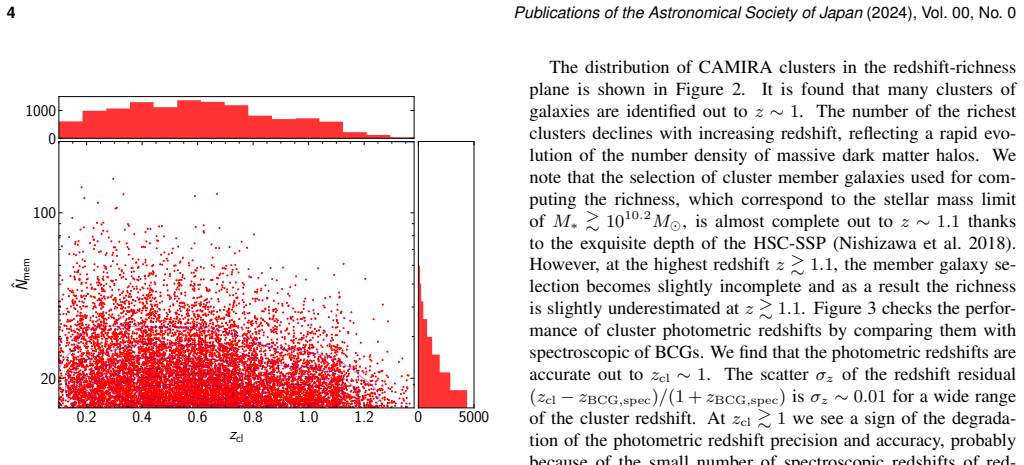
It is found that many clusters of galaxies are identified out toz∼1. The number of the richest clusters declines with increasing redshift, reflecting a rapid evo- lution of the number density of massive dark matter halos. We note that the selection of cluster member galaxies used for com- puting the richness, which correspond to the stellar mass limit ofM...
work page 2018
-
[14]
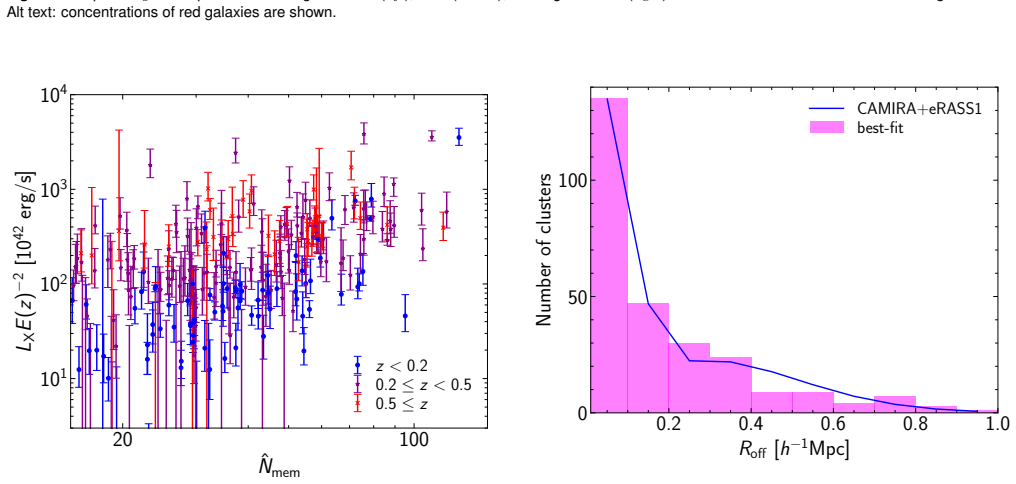
3.2 Comparison with an X-ray cluster catalog We cross match the CAMIRA cluster catalog with SRG/eROSITA All-Sky Survey first cluster catalog (hereafter eRASS1; Bulbul et al. 2024). The matching condition is the redshift difference of |∆z| ≤0.05and the physical transverse distance ofR≤1h −1Mpc, where the transverse distance is computed assuming the redshif...
work page 2024
-
[15]
We find a positive correlation between these two quantities, which is consistent with previous analysis of X-ray properties of CAMIRA clusters (e.g., Oguri et al. 2018a; Okabe et al. 2019; Willis et al. 2021; Ota et al. 2023). The relatively large scatter mainly reflects the large scatter of the richness-mass relation. A detailed analysis of the richness-...
work page 2019
-
[16]
that covers ∼430deg 2 of the HSC-SSP footprint with the raw number density of22.9arcmin −2. We derive differential surface mass density profiles∆Σ(R) for subsamples of CAMIRA clusters following Medezinski et al. (2018). Errors on the measurements include intrinsic ellipticities of galaxies. We use theP(z)cut method, for which an integrated probability of ...
work page 2018
-
[17]
From the MCMC analysis, we find that our model fits the ob- served lensing profiles reasonably well with the minimumχ 2 of χmin/dof = 182.4/182. In Table 2, we summarize the median and 68% credible interval of each model parameter after marginalizing over the other parameters. We find that model parameters of the richness-mass relation are broadly consist...
work page 2019
-
[18]
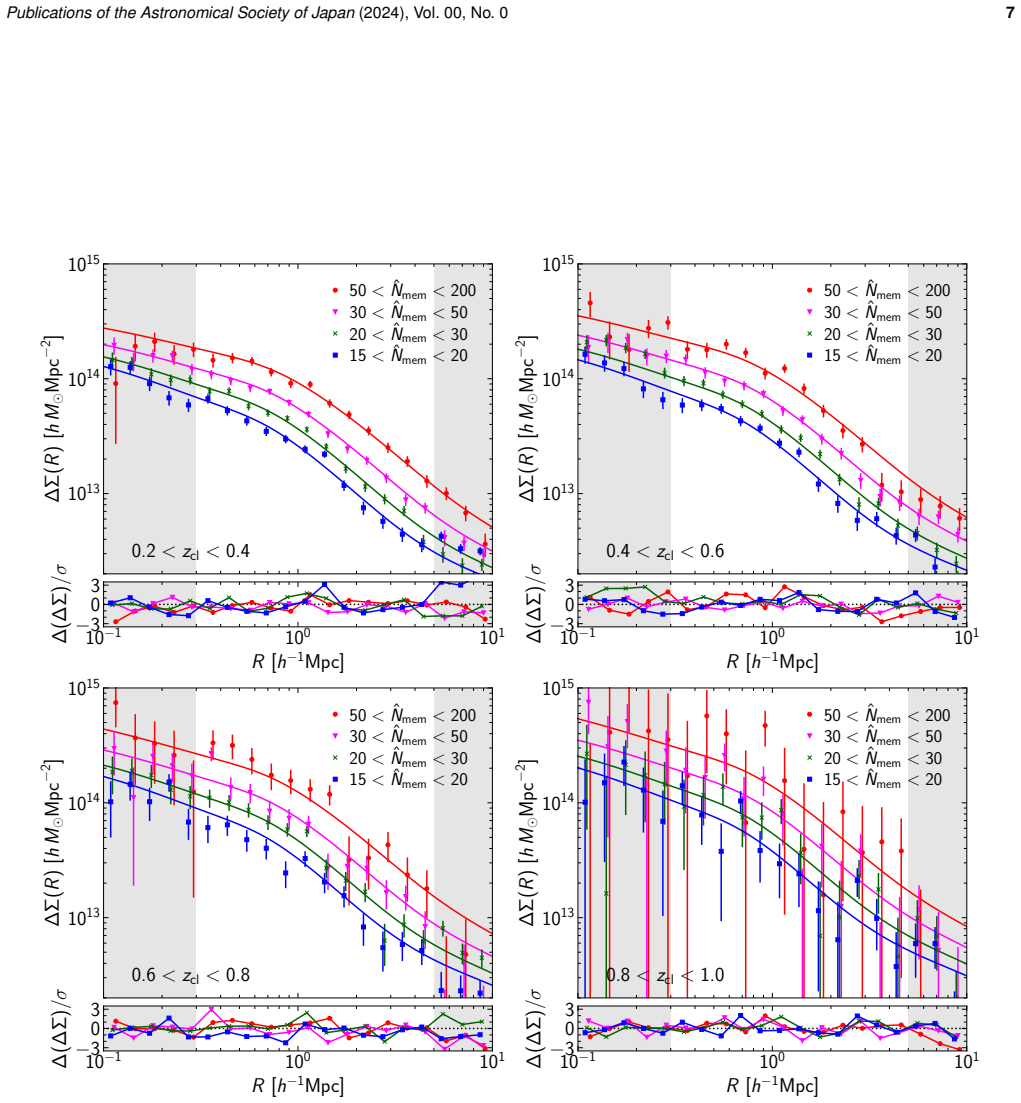
have to be taken into account as emphasized in Murata et al. (2019). We compare observed lensing profiles with our best-fit model in Figure
work page 2019
-
[19]
Given the richness-mass relation constrained from observed lensing profiles, we can derive the mass-richness relation using the Bayes theorem (Murata et al. 2019). P(lnM|N, z) = P(lnN|M, z)P(lnM|z)R dlnM P(lnN|M, z)P(lnM|z) ,(8) whereP(lnN|M, z)is defined in equation (2) and we use the halo mass function Publications of the Astronomical Society of Japan(2...
work page 2019
-
[20]
In sub-panels, we also show residuals (i.e., observed minus model predicted values) normalized by errors. Alt text: In each panel, the x axis shows the distance from the cluster center from 0.1 to 10 megaparsec. The y axis shows the differential surface mass distribution. 8Publications of the Astronomical Society of Japan(2024), Vol. 00, No. 0 15 20 30 40...
work page 2024
-
[21]
However, in order to place accurate constraints on cosmological parameters, the projection effect arising from the asphericity of clusters as well as neighboring galaxies have to be carefully taken into account (e.g., Osato et al. 2018; Sunayama et al. 2020; Wu et al. 2022; Lee et al. 2025). For instance, Sunayama et al. (2020) show that optically-selecte...
work page 2018
-
[22]
the method described in Sec. 2.3.2 The photometric LRG catalogs contain 6705294 galaxies from the Wide layer after applying for the bright star mask, and 119955 galaxies from the Deep+UD layer after applying for the bright star mask. We note that the photomet- ric LRG catalogs are constructed independently of the CAMIRA cluster catalogs presented in Sec. ...
work page 2014
-
[23]
Acknowledgments We thank an anonymous referee for useful suggestions. This work was supported by JSPS KAKENHI Grant Numbers JP25H00662, JP25H00672, JP25H01551, JP25K01026, JP25K01044, JP24H00002, JP24K00684, JP23H00108, JP23K22537, JP22K21349. YTL acknowledge support from National Science and Technology Council of Taiwan under grant NSTC 114-2112-M-001-03...
work page 2024
-
[24]
has been used for the previous analysis of the mass-richness relation in Murata et al. (2019), here we take the so-called halo model approach to compute cluster lensing profiles, largely following Oguri & Hamana (2011). In this approach, contributions from one-halo (1h) and two-halo (2h) terms are considered separately. For the one-halo term, we adopt the...
work page 2019
-
[25]
This density profile is smoothly truncated atr≃r t. The parameterρ s andr s are connected with the halo mass and the concentration parameter ignoring the truncation (see Oguri & Hamana 2011). We introduce the dimensionless truncation radius defined byτ 200m =r t/r200m, and assumeτ 200m = 2.5through- out the paper based on the comparison with ray-tracing s...
work page 2011
-
[26]
(2020) and also used inDarkEmulator(Nishimichi et al
implemented by Fang et al. (2020) and also used inDarkEmulator(Nishimichi et al
work page 2020
-
[27]
for fast calculations of the inverse Fourier transform. Following Oguri & Hamana (2011) and Oguri & Takada (2011), the Fourier transform of the two-halo term is computed as ˜Σ2h(k) = ¯ρm0bh(M)Pm(k/(1 +z);z),(A12) 10□2 10□1 100 101 102 R [h□1Mpc] 1011 1012 1013 1014 1015 Σ(R) [ h M⊙Mpc□2] total 1h center 1h mis-center 2h 10□2 10□1 100 101 102 R [h□1Mpc] 10...
work page 2011
-
[28]
Data Release 1 of the Dark Energy Spectroscopic Instrument
Appendix. References Abbott, T. M. C., Aguena, M., Alarcon, A., et al. 2025, Phys. Rev. D, 112, 083535 Aguado, D. S., Ahumada, R., Almeida, A., et al. 2019, ApJS, 240, 23 Aihara, H., Armstrong, R., Bickerton, S., et al. 2018a, PASJ, 70, S8 Aihara, H., Arimoto, N., Armstrong, R., et al. 2018b, PASJ, 70, S4 Aihara, H., AlSayyad, Y ., Ando, M., et al. 2019, ...
work page internal anchor Pith review Pith/arXiv arXiv 2025
discussion (0)
Sign in with ORCID, Apple, or X to comment. Anyone can read and Pith papers without signing in.