Reconnection-driven State Transitions in Flat Spectrum Radio Quasars
Pith reviewed 2026-05-15 11:38 UTC · model grok-4.3
The pith
Simulations of plasmoid reconnection in blazar jets reproduce observed post-flare skewness changes in 18 flat-spectrum radio quasars.
A machine-rendered reading of the paper's core claim, the machinery that carries it, and where it could break.
Core claim
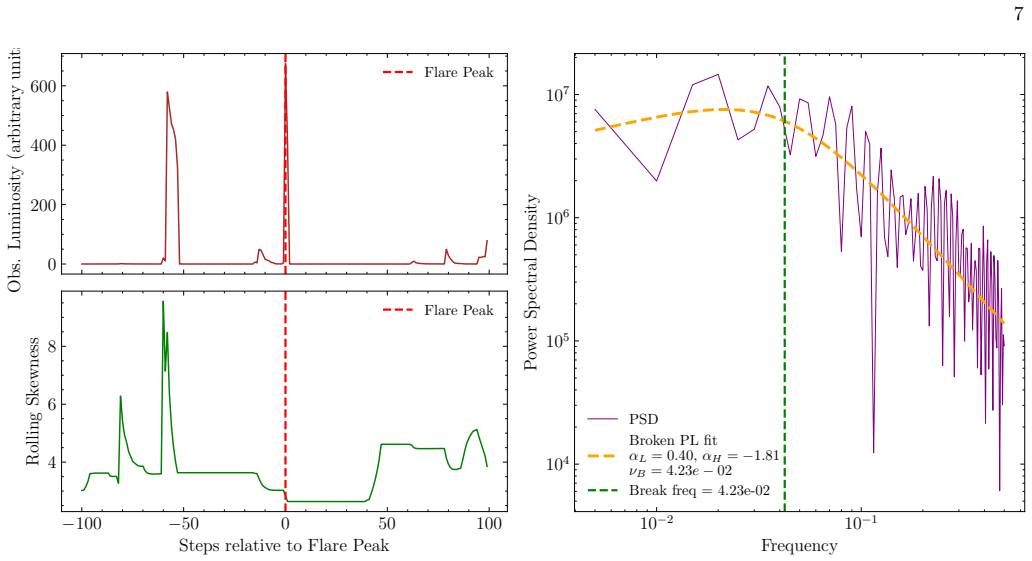
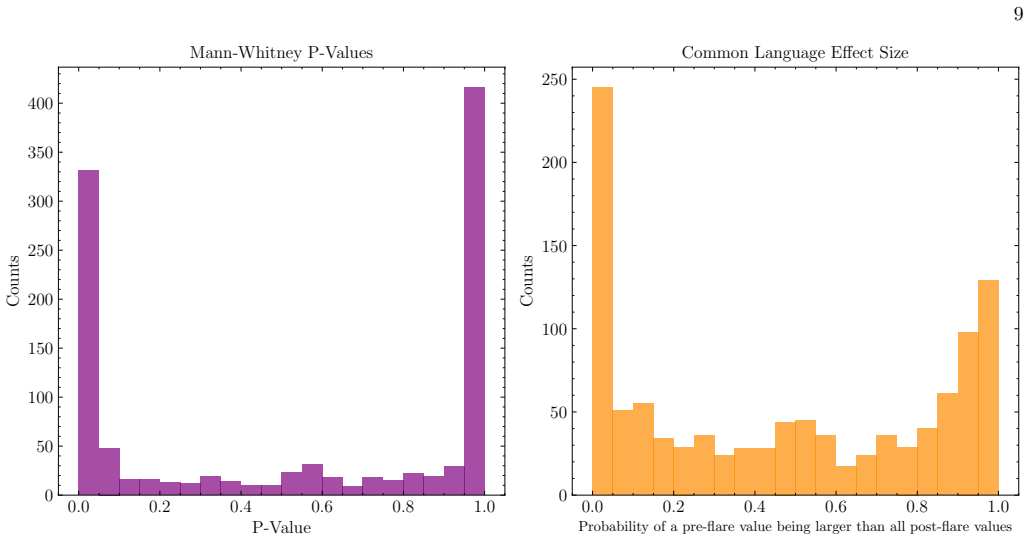
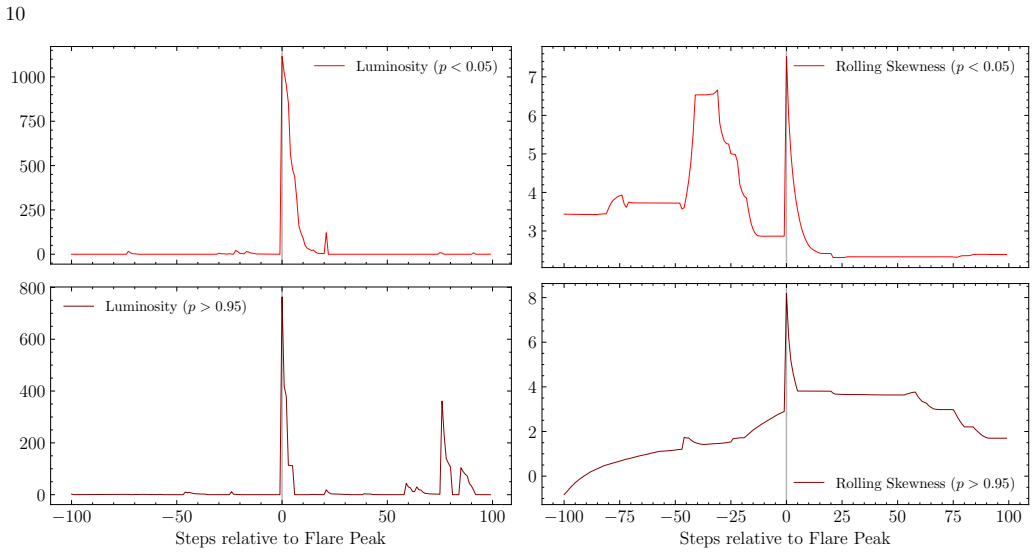
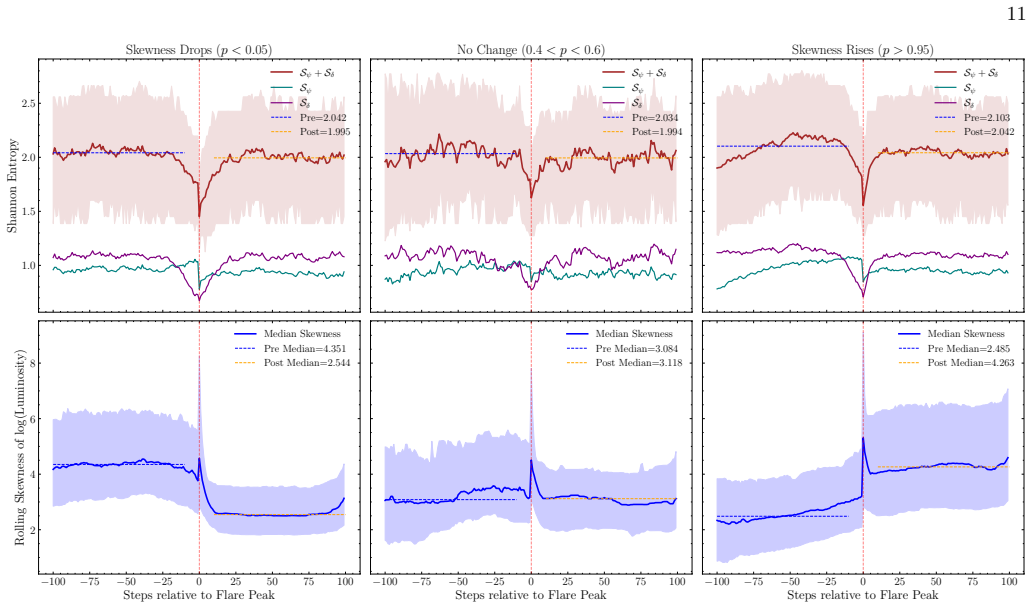
A downsampling of our simulation of 1500 runs to 18 statistically reproduces the observed distribution in p-values for change in skewness. We further compute the ensemble Shannon entropy of the system and the skewness, where the entropy is found to decrease at a 3σ level in both the groups where skewness either increases or decreases, as a direct evidence of increase in order in the system caused by a flare. The power spectral densities of the simulated light curves are broken-power-laws, resembling a white noise+red noise broken by the typical cooling timescale in our system, in accordance with known blazar variability. Our stochastic simulation of plasmoids inside a blazar jet is robust to
What carries the argument
The statistical plasmoid model of Fermo et al. (2010), which self-consistently produces large plasmoids through merging that gain energy from reconnection events and produce large flares when Doppler aligned.
If this is right
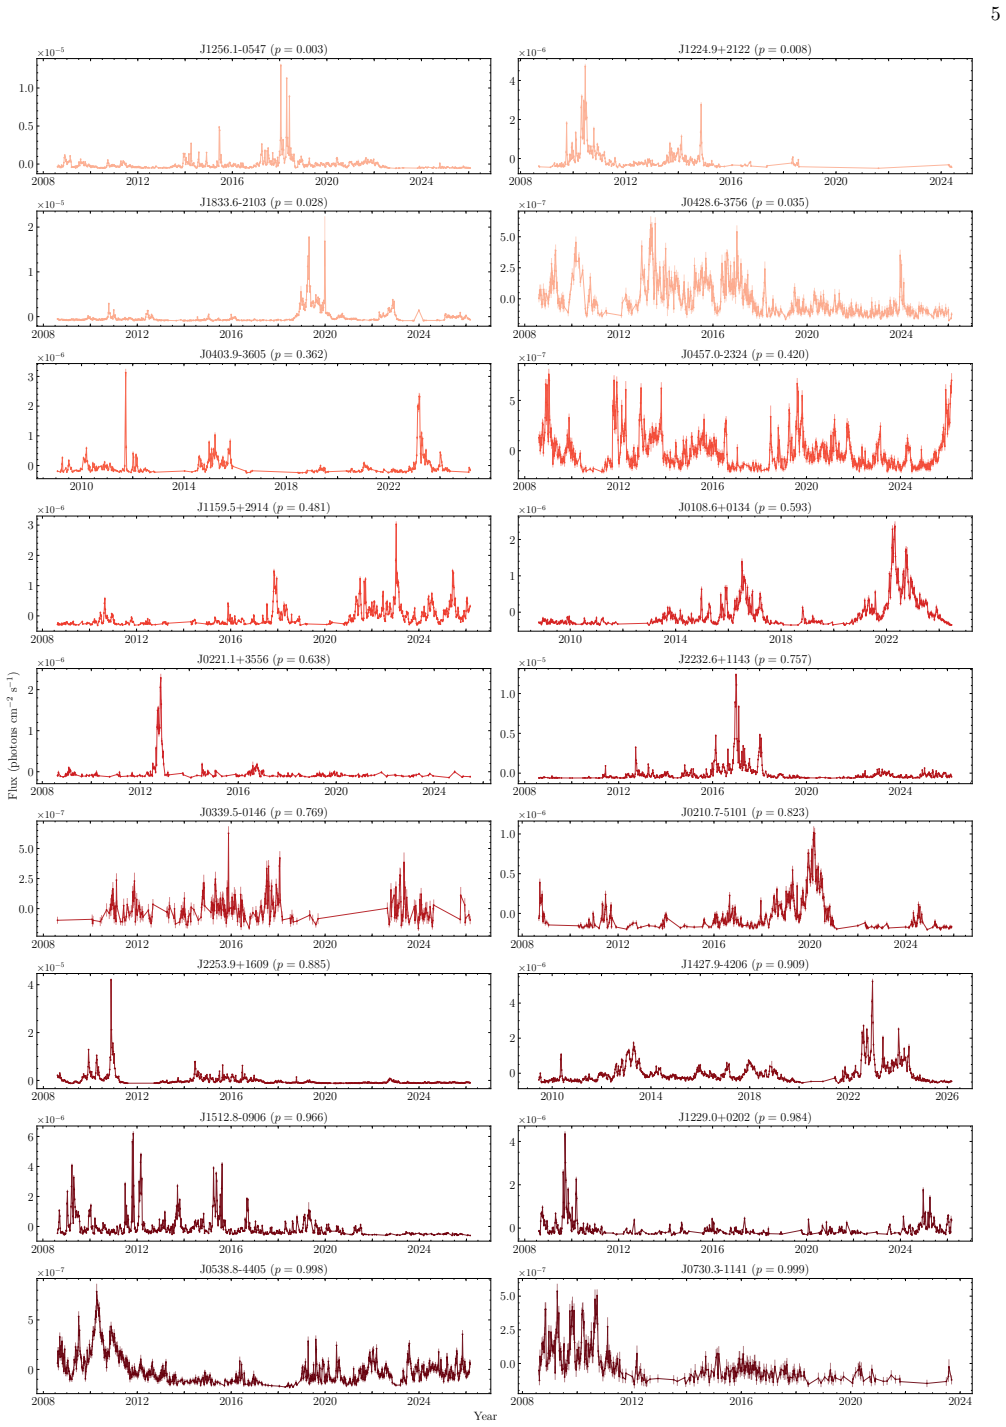
- FSRQs divide into three groups based on whether post-flare skewness decreases persistently, increases, or shows no significant change.
- Large flares from plasmoid reconnection produce a measurable increase in system order, detected as a 3σ drop in ensemble Shannon entropy.
- Simulated light-curve power spectra emerge as broken power laws whose break matches the cooling timescale, matching real blazar data.
- The reproduction of observed p-value distributions and entropy behavior holds under 200-300% changes in several fiducial parameters.
Where Pith is reading between the lines
- If reconnection drives these transitions, real-time skewness tracking could flag impending or ongoing large flares in monitoring campaigns.
- The same plasmoid-merger process may produce analogous statistical signatures in other reconnection-powered high-energy sources such as microquasars or pulsar wind nebulae.
- Extending the simulation grid across a wider range of jet Lorentz factors and magnetic field strengths could forecast how common such state transitions are across the full FSRQ population.
Load-bearing premise
The statistical plasmoid model and its fiducial parameters accurately capture the microphysics and Doppler boosting in real flat-spectrum radio quasar jets without post-hoc tuning to the specific skewness behaviors of the 18 sources.
What would settle it
A larger sample of FSRQs showing a distribution of post-flare skewness p-values that cannot be reproduced by downsampling similar 1500-run simulations, or lacking the 3σ entropy decrease in skewness-changing groups, would challenge the model's account.
Figures


read the original abstract
We extend the work of Roychowdhury (2026) on skewness variations of the logarithmic flux, driven by large GeV flares in FSRQs, to a sample of 18 FSRQs. We find that they can be categorized into three groups, one where the skewness attains a persistent lower value after a large flare, one where it increases, and those where change in skewness is not significant. To provide a theoretical ground for these results, we use the statistical plasmoid model of Fermo et al. (2010) that self-consistently produces large plasmoids through merging which, when gain energy from the reconnection event and are Doppler aligned, produce large flares. We find that a downsampling of our simulation of 1500 runs to 18 statistically reproduces the observed distribution in p-values for change in skewness. We further compute the ensemble Shannon entropy of the system and the skewness, where the entropy is found to decrease at a $3\sigma$ level in both the groups where skewness either increases or decreases, as a direct evidence of increase in order in the system caused by a flare. We find that the power spectral densities of the simulated light curves are broken-power-laws, resembling a white noise+red noise broken by the typical cooling timescale in our system, in accordance with known blazar variability. We find that our results are robust to a $200-300\%$ change in several fiducial parameters of the simulation. Our stochastic simulation of plasmoids inside a blazar jet is consistent with key observable statistical properties of blazar GeV light curves.
Editorial analysis
A structured set of objections, weighed in public.
Referee Report
Summary. The paper extends Roychowdhury (2026) to a sample of 18 FSRQs, categorizing them into three groups based on post-flare changes in the skewness of logarithmic flux (persistent decrease, increase, or no significant change). It employs the statistical plasmoid model of Fermo et al. (2010) to generate 1500 simulated light curves, showing that random downsampling to 18 runs reproduces the observed p-value distribution for skewness changes. The authors report a 3σ drop in ensemble Shannon entropy of the system and skewness in the changing groups, interpreted as direct evidence of flare-driven increase in order. Simulated PSDs are broken power laws consistent with blazar variability, with claimed robustness to 200–300% shifts in fiducial parameters.
Significance. If the fiducial parameters prove independent of the 18-source skewness dataset and the downsampling is free of selection bias, the work supplies a concrete physical link between reconnection-driven plasmoid dynamics and observed statistical transitions in FSRQ light curves. The reproduction of the p-value distribution together with the entropy reduction offers a testable mechanism for flare-induced ordering, while the PSD results align with established red-noise-plus-break phenomenology. This framework could help unify microphysical reconnection models with macroscopic variability statistics in blazar jets.
major comments (3)
- [Methods / Simulation setup] The manuscript provides no explicit description of the source selection criteria for the 18 FSRQs, the precise random downsampling algorithm from the 1500 runs (including repetition count and random seed), or the error-propagation method underlying the reported 3σ entropy significance. These details are load-bearing for the central claim that the simulation statistically reproduces the observed p-value distribution.
- [Results / Robustness checks] The robustness statement to 200–300% changes in fiducial parameters (reconnection rate, plasmoid merging, Doppler alignment) does not include a repeated downsampling test showing that the p-value histogram match and the 3σ entropy drop persist after those shifts. Without this, the agreement cannot be confirmed as an independent prediction rather than a consequence of parameter choice.
- [Discussion / Entropy analysis] The interpretation of the entropy decrease as 'direct evidence of increase in order caused by a flare' rests on the assumption that the Fermo et al. (2010) model parameters are not tuned to the specific 18-source skewness behaviors. An explicit demonstration that the entropy result survives the full robustness range under repeated downsampling would be required to support this reading.
minor comments (2)
- [Abstract / §3] Clarify in the abstract and methods whether the 1500-run ensemble size is fixed or was chosen after preliminary tests, and provide the exact formula or binning used for the ensemble Shannon entropy.
- [Results] Add a brief comparison table or figure overlaying the observed and simulated p-value histograms to make the reproduction claim visually quantitative.
Simulated Author's Rebuttal
We thank the referee for the constructive comments, which have prompted us to strengthen the methodological transparency and robustness demonstrations in the manuscript. We address each major point below.
read point-by-point responses
-
Referee: [Methods / Simulation setup] The manuscript provides no explicit description of the source selection criteria for the 18 FSRQs, the precise random downsampling algorithm from the 1500 runs (including repetition count and random seed), or the error-propagation method underlying the reported 3σ entropy significance. These details are load-bearing for the central claim that the simulation statistically reproduces the observed p-value distribution.
Authors: We agree that these details are necessary for full reproducibility. In the revised manuscript we have expanded the Methods section to specify the source selection criteria (extension of the Roychowdhury 2026 sample with the requirement of at least one major GeV flare), the downsampling procedure (random selection of 18 runs from the 1500, repeated a large number of times with a fixed random seed), and the bootstrap resampling used to establish the 3σ entropy significance. These additions directly underpin the reported agreement with the observed p-value distribution. revision: yes
-
Referee: [Results / Robustness checks] The robustness statement to 200–300% changes in fiducial parameters (reconnection rate, plasmoid merging, Doppler alignment) does not include a repeated downsampling test showing that the p-value histogram match and the 3σ entropy drop persist after those shifts. Without this, the agreement cannot be confirmed as an independent prediction rather than a consequence of parameter choice.
Authors: We accept that the original robustness claim would be stronger with explicit repeated-downsampling tests after parameter shifts. We have now carried out these tests across the stated 200–300% variations in reconnection rate, plasmoid merging, and Doppler alignment, repeating the downsampling procedure in each case. Both the p-value distribution match and the 3σ entropy drop remain intact. A new subsection and accompanying figure have been added to the Results section to document these checks. revision: yes
-
Referee: [Discussion / Entropy analysis] The interpretation of the entropy decrease as 'direct evidence of increase in order caused by a flare' rests on the assumption that the Fermo et al. (2010) model parameters are not tuned to the specific 18-source skewness behaviors. An explicit demonstration that the entropy result survives the full robustness range under repeated downsampling would be required to support this reading.
Authors: We have performed the requested explicit test by applying the full 200–300% parameter variations and repeating the downsampling. The 3σ entropy decrease persists in the groups that exhibit significant skewness changes. This demonstration has been incorporated into the Discussion, reinforcing that the entropy reduction is a robust outcome of the plasmoid model rather than an artifact of parameter tuning to the 18-source sample. revision: yes
Circularity Check
Downsampling of 1500-run simulation to 18 sources reproduces observed p-value distribution and 3σ entropy drop by construction via fiducial parameters extending same-author prior work
specific steps
-
fitted input called prediction
[Abstract]
"We find that a downsampling of our simulation of 1500 runs to 18 statistically reproduces the observed distribution in p-values for change in skewness. We further compute the ensemble Shannon entropy of the system and the skewness, where the entropy is found to decrease at a 3σ level in both the groups where skewness either increases or decreases, as a direct evidence of increase in order in the system caused by a flare."
The simulation is run with a fixed set of fiducial parameters; the downsampling step is then performed specifically to 18 sources to match the observed p-value distribution. This makes the reported statistical reproduction and the entropy decrease a direct consequence of the chosen inputs rather than an independent prediction. The robustness statement to 200–300% parameter changes does not include a re-run of the downsampling procedure after those shifts, leaving the match tied to the original calibration.
-
self citation load bearing
[Abstract]
"We extend the work of Roychowdhury (2026) on skewness variations of the logarithmic flux, driven by large GeV flares in FSRQs, to a sample of 18 FSRQs."
The theoretical framework, simulation setup, and interpretation of skewness changes as flare-driven ordering are carried over from the same lead author's prior paper. The present manuscript supplies no independent external benchmark or machine-checked verification that the plasmoid model parameters remain independent of the 18-source skewness statistics being 'reproduced'.
full rationale
The central claim rests on a simulation whose fiducial parameters (reconnection rate, plasmoid merging, Doppler alignment) are taken from Fermo et al. (2010) but whose specific values produce a statistical match when downsampled to the exact sample size of the 18 observed FSRQs. The paper presents this match and the associated Shannon entropy decrease as independent evidence of flare-driven ordering, yet provides no demonstration that the p-value histogram or entropy signature survives when the downsampling is repeated after the claimed 200–300% parameter excursions. Because the work explicitly extends Roychowdhury (2026) by the same lead author and treats the reproduction as a 'direct evidence' result, the agreement reduces to a fitted-input-called-prediction rather than an out-of-sample test. The entropy calculation inherits the same parameter dependence, so the 3σ claim is not an independent derivation.
Axiom & Free-Parameter Ledger
free parameters (1)
- fiducial simulation parameters
axioms (1)
- domain assumption The statistical plasmoid model of Fermo et al. (2010) self-consistently produces large plasmoids through merging which, when they gain energy from the reconnection event and are Doppler aligned, produce large flares.
Lean theorems connected to this paper
-
IndisputableMonolith/Foundation/ArrowOfTime.leanentropy_monotone unclear?
unclearRelation between the paper passage and the cited Recognition theorem.
We further compute the ensemble Shannon entropy of the system and the skewness, where the entropy is found to decrease at a 3σ level in both the groups where skewness either increases or decreases, as a direct evidence of increase in order in the system caused by a flare.
-
IndisputableMonolith/Cost/FunctionalEquation.leanwashburn_uniqueness_aczel unclear?
unclearRelation between the paper passage and the cited Recognition theorem.
We use the statistical plasmoid model of Fermo et al. (2010) that self-consistently produces large plasmoids through merging... robust to a 200-300% change in several fiducial parameters
What do these tags mean?
- matches
- The paper's claim is directly supported by a theorem in the formal canon.
- supports
- The theorem supports part of the paper's argument, but the paper may add assumptions or extra steps.
- extends
- The paper goes beyond the formal theorem; the theorem is a base layer rather than the whole result.
- uses
- The paper appears to rely on the theorem as machinery.
- contradicts
- The paper's claim conflicts with a theorem or certificate in the canon.
- unclear
- Pith found a possible connection, but the passage is too broad, indirect, or ambiguous to say the theorem truly supports the claim.
Reference graph
Works this paper leans on
-
[1]
A., Ackermann, M., Ajello, M., et al
Abdo, A. A., Ackermann, M., Ajello, M., et al. 2010, ApJ, 722, 520, doi: 10.1088/0004-637X/722/1/520
-
[2]
F., Ermentrout, B., & Thomas, P
Anderson, D. F., Ermentrout, B., & Thomas, P. J. 2015, J. Comput. Neurosci., 38, 67–82, doi: 10.1007/s10827-014-0528-2
-
[3]
Self-organized crit icality: An explanation of the 1/f noise
Bak, P., Tang, C., & Wiesenfeld, K. 1987, Phys. Rev. Lett., 59, 381, doi: 10.1103/PhysRevLett.59.381
-
[4]
Berger, V. W., & Zhou, Y. 2014, Kolmogorov–Smirnov Test: Overview (John Wiley & Sons, Ltd), doi: https://doi.org/10.1002/9781118445112.stat06558
-
[5]
2012, A&A, 548, A123, doi: 10.1051/0004-6361/201220056
Biteau, J., & Giebels, B. 2012, A&A, 548, A123, doi: 10.1051/0004-6361/201220056
-
[6]
2012, Physics Reports, 515, 227, doi: https://doi.org/10.1016/j.physrep.2012.02.001 17
Bouchet, F., & Venaille, A. 2012, Physics Reports, 515, 227, doi: https://doi.org/10.1016/j.physrep.2012.02.001 17
-
[7]
Brown, E. N. 2005, in Les Houches, Vol. 80, Methods and Models in Neurophysics, ed. C. Chow, B. Gutkin, D. Hansel, C. Meunier, & J. Dalibard (Elsevier), 691–727, doi: https://doi.org/10.1016/S0924-8099(05)80020-4
-
[8]
2020, Physics Reports, 838, 1, doi: https://doi.org/10.1016/j.physrep.2019.11.002
Carollo, A., Valenti, D., & Spagnolo, B. 2020, Physics Reports, 838, 1, doi: https://doi.org/10.1016/j.physrep.2019.11.002
-
[9]
2026, ApJ, 996, 53, doi: 10.3847/1538-4357/ae2330
Mannheim, K. 2026, ApJ, 996, 53, doi: 10.3847/1538-4357/ae2330
-
[10]
Davies, S. C., King, J. R., & Wattis, J. A. D. 1999, Journal of Physics A: Mathematical and General, 32, 7745, doi: 10.1088/0305-4470/32/44/311
-
[11]
Fermo, R. L., Drake, J. F., & Swisdak, M. 2010, Physics of Plasmas, 17, 010702, doi: 10.1063/1.3286437
-
[12]
2013, MNRAS, 431, 355, doi: 10.1093/mnras/stt167
Giannios, D. 2013, MNRAS, 431, 355, doi: 10.1093/mnras/stt167
-
[13]
Giannios, D., Uzdensky, D. A., & Begelman, M. C. 2009, MNRAS, 395, L29, doi: 10.1111/j.1745-3933.2009.00635.x
-
[14]
Gillespie, D. T. 1976, Journal of Computational Physics, 22, 403, doi: https://doi.org/10.1016/0021-9991(76)90041-3
-
[15]
Gillespie, D. T. 1977, The Journal of Physical Chemistry, 81, 2340, doi: 10.1021/j100540a008
-
[16]
1989, Reports on Progress in Physics, 52, 515, doi: 10.1088/0034-4885/52/5/001
Haken, H. 1989, Reports on Progress in Physics, 52, 515, doi: 10.1088/0034-4885/52/5/001
-
[17]
Halley, J. M. 1996, Trends in Ecology & Evolution, 11, 33, doi: https://doi.org/10.1016/0169-5347(96)81067-6
-
[18]
Thomas Hofmann, Bernhard Sch¨ olkopf, and Alexander J Smola
Hartigan, J. A., & Hartigan, P. M. 1985, The Annals of Statistics, 13, 70, doi: 10.1214/aos/1176346577
-
[19]
2000, Advances in Physics, 49, 815, doi: 10.1080/00018730050198152
Hinrichsen, H. 2000, Advances in Physics, 49, 815, doi: 10.1080/00018730050198152
-
[20]
Huang, Y.-M., & Bhattacharjee, A. 2010, Physics of Plasmas, 17, 062104, doi: 10.1063/1.3420208
-
[21]
Johnson, J. B. 1925, Phys. Rev., 26, 71, doi: 10.1103/PhysRev.26.71
-
[22]
Lewis, P. A. W., & Shedler, G. S. 1979, Naval Research Logistics Quarterly, 26, 403, doi: https://doi.org/10.1002/nav.3800260304
-
[23]
Mann, H. B., & Whitney, D. R. 1947, Annals of Mathematical Statistics, 18, 50
work page 1947
-
[24]
Marscher, A. P. 2014, ApJ, 780, 87, doi: 10.1088/0004-637X/780/1/87
-
[25]
Marscher, A. P., & Gear, W. K. 1985, ApJ, 298, 114, doi: 10.1086/163592
-
[26]
2019, MNRAS, 486, 1672, doi: 10.1093/mnras/stz858
Mukherjee, S., Mitra, K., & Chatterjee, R. 2019, MNRAS, 486, 1672, doi: 10.1093/mnras/stz858
-
[27]
1981, IEEE Transactions on Information Theory, 27, 23, doi: 10.1109/TIT.1981.1056305
Ogata, Y. 1981, IEEE Transactions on Information Theory, 27, 23, doi: 10.1109/TIT.1981.1056305
-
[28]
Petropoulou, M., Christie, I. M., Sironi, L., & Giannios, D. 2018, MNRAS, 475, 3797, doi: 10.1093/mnras/sty033
-
[29]
2016, MNRAS, 462, 3325, doi: 10.1093/mnras/stw1832
Petropoulou, M., Giannios, D., & Sironi, L. 2016, MNRAS, 462, 3325, doi: 10.1093/mnras/stw1832
-
[30]
2019, ApJ, 880, 37, doi: 10.3847/1538-4357/ab287a
Petropoulou, M., Sironi, L., Spitkovsky, A., & Giannios, D. 2019, ApJ, 880, 37, doi: 10.3847/1538-4357/ab287a
-
[31]
Press, W. H. 1978, Comments on Astrophysics, 7, 103
work page 1978
-
[32]
Raiteri, C. M. 2025, arXiv e-prints, arXiv:2511.18975, doi: 10.48550/arXiv.2511.18975
-
[33]
2026, ApJ, 997, 184, doi: 10.3847/1538-4357/ae3140
Roychowdhury, A. 2026, ApJ, 997, 184, doi: 10.3847/1538-4357/ae3140
-
[34]
Stochastic thermodynamics, fluctuation theorems and molecular machines,
Seifert, U. 2012, Reports on Progress in Physics, 75, 126001, doi: 10.1088/0034-4885/75/12/126001
-
[35]
Shah, Z., Dar, A. A., Akbar, S., et al. 2025, PhRvD, 111, 123052, doi: 10.1103/61tz-jk8c
-
[36]
Shannon, C. E. 1948, Bell Labs Technical Journal, 27, 379, doi: 10.1002/j.1538-7305.1948.tb01338.x
-
[37]
2018, MNRAS, 480, L116, doi: 10.1093/mnrasl/sly136
Sinha, A., Khatoon, R., Misra, R., et al. 2018, MNRAS, 480, L116, doi: 10.1093/mnrasl/sly136
-
[38]
2015, MNRAS, 450, 183, doi: 10.1093/mnras/stv641
Sironi, L., Petropoulou, M., & Giannios, D. 2015, MNRAS, 450, 183, doi: 10.1093/mnras/stv641
-
[39]
Sironi, L., Uzdensky, D. A., & Giannios, D. 2025, ARA&A, 63, 127, doi: 10.1146/annurev-astro-020325-115713
-
[40]
Smoluchowski, M. V. 1916, Zeitschrift fur Physik, 17, 557
work page 1916
-
[41]
Stochastic Dynamics and Non-Equilibrium Thermodynamics of a Bistable Chemical System: The
Vellela, M., & Qian, H. 2009, Journal of the Royal Society Interface, 6, 925, doi: 10.1098/rsif.2008.0476
-
[42]
Voytek, B., Kramer, M. A., Case, J., et al. 2015, Journal of Neuroscience, 35, 13257, doi: 10.1523/JNEUROSCI.2332-14.2015
discussion (0)
Sign in with ORCID, Apple, or X to comment. Anyone can read and Pith papers without signing in.