Recognition: 2 theorem links
· Lean TheoremChartNet: A Million-Scale, High-Quality Multimodal Dataset for Robust Chart Understanding
Pith reviewed 2026-05-14 22:35 UTC · model grok-4.3
The pith
ChartNet supplies 1.5 million aligned multimodal chart samples to improve vision-language model performance on chart reasoning tasks.
A machine-rendered reading of the paper's core claim, the machinery that carries it, and where it could break.
Core claim
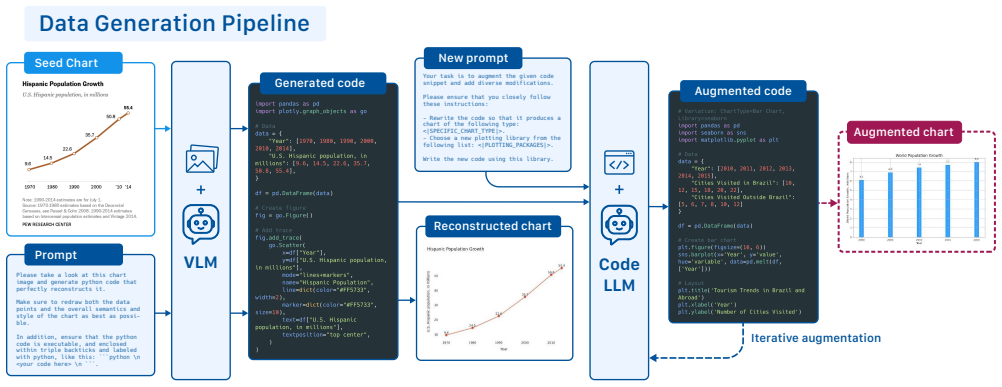
ChartNet is generated through a code-guided synthesis pipeline producing 1.5 million samples across 24 chart types from 6 libraries, with each sample containing plotting code, rendered image, data table, natural language summary, and QA with reasoning, supplemented by human-annotated, real-world, safety, and grounding subsets, all processed through rigorous quality filtering to enable robust multimodal chart understanding.
What carries the argument
Code-guided synthesis pipeline that creates fine-grained cross-modal alignments between plotting code, chart images, data tables, summaries, and reasoning-based QA pairs.
If this is right
- Fine-tuning on ChartNet improves performance across multiple chart understanding benchmarks.
- The dataset serves as large-scale supervision for developing foundation models with better chart comprehension.
- Specialized subsets address safety, grounding, and real-world variations in chart data.
- Diverse generation across plotting libraries increases representation variety in the training data.
Where Pith is reading between the lines
- Models trained this way may generalize better to unseen chart styles or complex multi-panel figures.
- Similar synthesis methods could be applied to other structured visual domains like scientific diagrams or maps.
- Open availability of such data lowers the barrier for research in specialized visual reasoning tasks.
Load-bearing premise
The synthetic data from the code-guided pipeline and quality filters matches the statistical properties of real-world charts closely enough that models trained on it perform well on actual charts.
What would settle it
A model fine-tuned on ChartNet performing no better or worse than one trained only on existing smaller real-world chart datasets when tested on a new collection of diverse real charts would falsify the utility claim.
Figures


read the original abstract
Understanding charts requires models to jointly reason over geometric visual patterns, structured numerical data, and natural language -- a capability where current vision-language models (VLMs) remain limited. We introduce ChartNet, a high-quality, million-scale multimodal dataset designed to advance chart interpretation and reasoning. ChartNet leverages a novel code-guided synthesis pipeline to generate 1.5 million diverse chart samples spanning 24 chart types and 6 plotting libraries. Each sample consists of five aligned components: plotting code, rendered chart image, data table, natural language summary, and question-answering with reasoning, providing fine-grained cross-modal alignment. To capture the full spectrum of chart comprehension, ChartNet additionally includes specialized subsets encompassing human annotated data, real-world data, safety, and grounding. Moreover, a rigorous quality-filtering pipeline ensures visual fidelity, semantic accuracy, and diversity across chart representations. Fine-tuning on ChartNet consistently improves results across benchmarks, demonstrating its utility as large-scale supervision for multimodal models. As the largest open-source dataset of its kind, ChartNet aims to support the development of foundation models with robust and generalizable capabilities for data visualization understanding. The dataset is publicly available at https://huggingface.co/datasets/ibm-granite/ChartNet
Editorial analysis
A structured set of objections, weighed in public.
Referee Report
Summary. The manuscript introduces ChartNet, a 1.5-million-sample multimodal dataset for chart understanding constructed primarily via a code-guided synthesis pipeline across 24 chart types and 6 plotting libraries. Each sample provides five aligned modalities (plotting code, rendered image, data table, natural-language summary, and QA pairs with reasoning), augmented by human-annotated, real-world, safety, and grounding subsets and a quality-filtering pipeline. The central claim is that fine-tuning vision-language models on ChartNet produces consistent benchmark gains, establishing the dataset as the largest open-source resource for robust chart interpretation.
Significance. If the benchmark gains are shown to arise from genuine generalization rather than synthetic in-distribution performance, ChartNet would be a high-impact contribution as the largest publicly released chart dataset with explicit cross-modal alignments. The scale, diversity of generation libraries, and inclusion of specialized subsets could materially advance VLM training for visualization reasoning tasks. The open release itself is a clear strength that supports reproducibility.
major comments (2)
- [Abstract] Abstract: the claim that fine-tuning on ChartNet 'consistently improves results across benchmarks' is stated without any numerical scores, error bars, per-benchmark breakdowns, or ablation tables isolating the effect of the synthetic pipeline versus the real-world/human-annotated subsets. This absence directly undermines evaluation of the headline generalization claim.
- [Abstract] Abstract: no quantitative split is reported between the 1.5 M synthetic samples and the real-world/human-annotated subsets, nor are any ablation results shown that test whether the quality-filtering pipeline closes the distribution gap to noisy real charts (scanning artifacts, compression, hand-drawn variation). This information is load-bearing for the robustness argument.
minor comments (1)
- The description of the five aligned components per sample would be clearer with an explicit diagram or table showing the exact format and alignment mechanism for each modality.
Simulated Author's Rebuttal
We thank the referee for their constructive feedback, which helps clarify the presentation of our results and the robustness claims. We address each major comment point by point below, indicating planned revisions where appropriate.
read point-by-point responses
-
Referee: [Abstract] Abstract: the claim that fine-tuning on ChartNet 'consistently improves results across benchmarks' is stated without any numerical scores, error bars, per-benchmark breakdowns, or ablation tables isolating the effect of the synthetic pipeline versus the real-world/human-annotated subsets. This absence directly undermines evaluation of the headline generalization claim.
Authors: We agree that the abstract would benefit from explicit quantitative support for the generalization claim. The full manuscript reports detailed benchmark results in the Experiments section, including per-benchmark scores, improvements over baselines, and comparisons involving the synthetic core versus supplementary subsets. To directly address the concern, we will revise the abstract to include key numerical highlights (e.g., average gains and representative per-benchmark deltas) along with pointers to the relevant tables and ablations. revision: yes
-
Referee: [Abstract] Abstract: no quantitative split is reported between the 1.5 M synthetic samples and the real-world/human-annotated subsets, nor are any ablation results shown that test whether the quality-filtering pipeline closes the distribution gap to noisy real charts (scanning artifacts, compression, hand-drawn variation). This information is load-bearing for the robustness argument.
Authors: We appreciate this observation. Section 3 of the manuscript already specifies the composition (core 1.5 M synthetic samples generated across 24 chart types and 6 libraries, augmented by smaller human-annotated, real-world, safety, and grounding subsets). We will update the abstract to report the approximate quantitative split. For the quality-filtering pipeline, Section 4 describes the visual, semantic, and diversity checks; however, we acknowledge that dedicated ablations isolating performance on specific real-world artifacts (scanning, compression, hand-drawn) are not exhaustively presented. We will add a concise discussion of the pipeline's design rationale and any supporting quality metrics in the revision. revision: partial
Circularity Check
No circularity: empirical dataset construction with external benchmarks
full rationale
The paper describes a code-guided synthesis pipeline to create 1.5M chart samples across 24 types and 6 libraries, augmented by real-world and human-annotated subsets plus a quality-filtering step, followed by empirical fine-tuning results on external benchmarks. No mathematical derivations, equations, fitted parameters renamed as predictions, or load-bearing self-citations exist. All claims rest on observable dataset construction and measured performance gains against independent test sets, making the work self-contained without any reduction of outputs to inputs by construction.
Axiom & Free-Parameter Ledger
axioms (2)
- domain assumption Code-guided rendering produces visually faithful and semantically accurate chart images across 24 types and 6 libraries
- domain assumption Quality-filtering pipeline preserves diversity while ensuring visual fidelity and semantic accuracy
Lean theorems connected to this paper
-
IndisputableMonolith/Cost/FunctionalEquation.leanwashburn_uniqueness_aczel unclear?
unclearRelation between the paper passage and the cited Recognition theorem.
ChartNet leverages a novel code-guided synthesis pipeline to generate 1.5 million diverse chart samples spanning 24 chart types and 6 plotting libraries... rigorous quality-filtering pipeline ensures visual fidelity, semantic accuracy, and diversity
-
IndisputableMonolith/Foundation/ArithmeticFromLogic.leanLogicNat.induction unclear?
unclearRelation between the paper passage and the cited Recognition theorem.
We use pixtral-large-instruct-2411 in the Chart-to-Code Reconstruction, Quality Filtering... gpt-oss-120b in the Code-Guided Chart Augmentation stage
What do these tags mean?
- matches
- The paper's claim is directly supported by a theorem in the formal canon.
- supports
- The theorem supports part of the paper's argument, but the paper may add assumptions or extra steps.
- extends
- The paper goes beyond the formal theorem; the theorem is a base layer rather than the whole result.
- uses
- The paper appears to rely on the theorem as machinery.
- contradicts
- The paper's claim conflicts with a theorem or certificate in the canon.
- unclear
- Pith found a possible connection, but the passage is too broad, indirect, or ambiguous to say the theorem truly supports the claim.
Reference graph
Works this paper leans on
-
[1]
gpt-oss-120b & gpt-oss-20b Model Card
Sandhini Agarwal, Lama Ahmad, Jason Ai, Sam Altman, Andy Applebaum, Edwin Arbus, Rahul K Arora, Yu Bai, Bowen Baker, Haiming Bao, et al. gpt-oss-120b & gpt-oss- 20b model card.arXiv preprint arXiv:2508.10925, 2025. 4, I, II
work page internal anchor Pith review Pith/arXiv arXiv 2025
-
[2]
LLaVA-OneVision-1.5: Fully Open Framework for Democratized Multimodal Training
Xiang An, Yin Xie, Kaicheng Yang, Wenkang Zhang, Xiuwei Zhao, Zheng Cheng, Yirui Wang, Songcen Xu, Changrui Chen, Chunsheng Wu, et al. Llava-onevision-1.5: Fully open framework for democratized multimodal training. arXiv preprint arXiv:2509.23661, 2025. 2
work page internal anchor Pith review Pith/arXiv arXiv 2025
-
[3]
Vqa: Visual question answering
Stanislaw Antol, Aishwarya Agrawal, Jiasen Lu, Margaret Mitchell, Dhruv Batra, C Lawrence Zitnick, and Devi Parikh. Vqa: Visual question answering. InProceedings of the IEEE international conference on computer vision, 2015. 3
work page 2015
-
[4]
Shuai Bai, Keqin Chen, Xuejing Liu, Jialin Wang, Wenbin Ge, Sibo Song, Kai Dang, Peng Wang, Shijie Wang, Jun Tang, et al. Qwen2. 5-vl technical report.arXiv preprint arXiv:2502.13923, 2025. 6
work page internal anchor Pith review Pith/arXiv arXiv 2025
-
[5]
Bain & company insights.https://www.bain
Bain. Bain & company insights.https://www.bain. com/insights/, 2025. 5
work page 2025
-
[6]
Matt Deitke, Christopher Clark, Sangho Lee, Rohun Tri- pathi, Yue Yang, Jae Sung Park, Mohammadreza Salehi, Niklas Muennighoff, Kyle Lo, Luca Soldaini, et al. Molmo and pixmo: Open weights and open data for state-of-the-art multimodal models.arXiv e-prints, 2024. 3
work page 2024
-
[7]
Mammoth-vl: Eliciting multimodal reasoning with in- struction tuning at scale
Jiawei Guo, Tianyu Zheng, Yizhi Li, Yuelin Bai, Bo Li, Yubo Wang, King Zhu, Graham Neubig, Wenhu Chen, and Xiang Yue. Mammoth-vl: Eliciting multimodal reasoning with in- struction tuning at scale. InProceedings of the 63rd Annual Meeting of the Association for Computational Linguistics,
-
[8]
Llava-uhd: an lmm perceiving any aspect ratio and high- resolution images
Zonghao Guo, Ruyi Xu, Yuan Yao, Junbo Cui, Zanlin Ni, Chunjiang Ge, Tat-Seng Chua, Zhiyuan Liu, and Gao Huang. Llava-uhd: an lmm perceiving any aspect ratio and high- resolution images. InEuropean Conference on Computer Vision, 2024. 2
work page 2024
-
[9]
Chartllama: A mul- timodal llm for chart understanding and generation, 2023
Yucheng Han, Chi Zhang, Xin Chen, Xu Yang, Zhibin Wang, Gang Yu, Bin Fu, and Hanwang Zhang. Chartllama: A mul- timodal llm for chart understanding and generation, 2023. 2
work page 2023
-
[10]
Wenyi Hong, Wenmeng Yu, Xiaotao Gu, Guo Wang, Guob- ing Gan, Haomiao Tang, Jiale Cheng, Ji Qi, Junhui Ji, Li- hang Pan, et al. Glm-4.1 v-thinking: Towards versatile multi- modal reasoning with scalable reinforcement learning.arXiv e-prints, 2025. 2
work page 2025
-
[11]
Fine- match: Aspect-based fine-grained image and text mismatch detection and correction
Hang Hua, Jing Shi, Kushal Kafle, Simon Jenni, Daoan Zhang, John Collomosse, Scott Cohen, and Jiebo Luo. Fine- match: Aspect-based fine-grained image and text mismatch detection and correction. InEuropean Conference on Com- puter Vision, 2024. 3
work page 2024
-
[12]
Hang Hua, Yunlong Tang, Ziyun Zeng, Liangliang Cao, Zhengyuan Yang, Hangfeng He, Chenliang Xu, and Jiebo Luo. Mmcomposition: Revisiting the compositionality of pre-trained vision-language models.arXiv preprint arXiv:2410.09733, 2024. 3
-
[13]
Finecaption: Compositional image captioning focusing on wherever you want at any granularity
Hang Hua, Qing Liu, Lingzhi Zhang, Jing Shi, Soo Ye Kim, Zhifei Zhang, Yilin Wang, Jianming Zhang, Zhe Lin, and Jiebo Luo. Finecaption: Compositional image captioning focusing on wherever you want at any granularity. InPro- ceedings of the Computer Vision and Pattern Recognition Conference, 2025. 2
work page 2025
-
[14]
V2xum-llm: Cross-modal video summarization with tempo- ral prompt instruction tuning
Hang Hua, Yunlong Tang, Chenliang Xu, and Jiebo Luo. V2xum-llm: Cross-modal video summarization with tempo- ral prompt instruction tuning. InProceedings of the AAAI Conference on Artificial Intelligence, 2025. 3
work page 2025
-
[15]
Hang Hua, Ziyun Zeng, Yizhi Song, Yunlong Tang, Liu He, Daniel Aliaga, Wei Xiong, and Jiebo Luo. Mmig- bench: Towards comprehensive and explainable evaluation of multi-modal image generation models.arXiv preprint arXiv:2505.19415, 2025. 3
-
[16]
Brandon Huang, Hang Hua, Zhuoran Yu, Trevor Darrell, Rogerio Feris, and Roei Herzig. Dave: A vlm vision encoder for document understanding and web agents.arXiv preprint arXiv:2512.17221, 2025. 3
-
[17]
Evochart: A benchmark and a self-training approach towards real-world chart understand- ing, 2025
Muye Huang, Han Lai, Xinyu Zhang, Wenjun Wu, Jie Ma, Lingling Zhang, and Jun Liu. Evochart: A benchmark and a self-training approach towards real-world chart understand- ing, 2025. 2
work page 2025
-
[18]
Vision-R1: Incentivizing Reasoning Capability in Multimodal Large Language Models
Wenxuan Huang, Bohan Jia, Zijie Zhai, Shaosheng Cao, Zheyu Ye, Fei Zhao, Zhe Xu, Yao Hu, and Shaohui Lin. Vision-r1: Incentivizing reasoning capability in multimodal large language models.arXiv preprint arXiv:2503.06749,
work page internal anchor Pith review Pith/arXiv arXiv
-
[19]
Gqa: A new dataset for real-world visual reasoning and compositional question answering
Drew A Hudson and Christopher D Manning. Gqa: A new dataset for real-world visual reasoning and compositional question answering. InProceedings of the IEEE/CVF con- ference on computer vision and pattern recognition, 2019. 3
work page 2019
-
[20]
Clevr: A diagnostic dataset for compositional language and elementary visual reasoning
Justin Johnson, Bharath Hariharan, Laurens Van Der Maaten, Li Fei-Fei, C Lawrence Zitnick, and Ross Girshick. Clevr: A diagnostic dataset for compositional language and elementary visual reasoning. InProceedings of the IEEE conference on computer vision and pattern recognition, 2017. 3
work page 2017
-
[21]
Dvqa: Understanding data visualizations via ques- tion answering, 2018
Kushal Kafle, Brian Price, Scott Cohen, and Christopher Kanan. Dvqa: Understanding data visualizations via ques- tion answering, 2018. 2
work page 2018
-
[22]
Fig- ureqa: An annotated figure dataset for visual reasoning,
Samira Ebrahimi Kahou, Vincent Michalski, Adam Atkin- son, Akos Kadar, Adam Trischler, and Yoshua Bengio. Fig- ureqa: An annotated figure dataset for visual reasoning,
-
[23]
Opencqa: Open-ended question answering with charts, 2022
Shankar Kantharaj, Xuan Long Do, Rixie Tiffany Ko Leong, Jia Qing Tan, Enamul Hoque, and Shafiq Joty. Opencqa: Open-ended question answering with charts, 2022. 2
work page 2022
-
[24]
Chart-to-text: A large-scale benchmark for chart sum- marization, 2022
Shankar Kantharaj, Rixie Tiffany Ko Leong, Xiang Lin, Ahmed Masry, Megh Thakkar, Enamul Hoque, and Shafiq Joty. Chart-to-text: A large-scale benchmark for chart sum- marization, 2022. 2
work page 2022
-
[25]
A diagram is 9 worth a dozen images
Aniruddha Kembhavi, Mike Salvato, Eric Kolve, Minjoon Seo, Hannaneh Hajishirzi, and Ali Farhadi. A diagram is 9 worth a dozen images. InEuropean conference on computer vision, 2016. 3
work page 2016
-
[26]
Chartgen: Scaling chart understanding via code-guided synthetic chart gener- ation, 2025
Jovana Kondic, Pengyuan Li, Dhiraj Joshi, Zexue He, Shafiq Abedin, Jennifer Sun, Ben Wiesel, Eli Schwartz, Ahmed Nassar, Bo Wu, Assaf Arbelle, Aude Oliva, Dan Gutfreund, Leonid Karlinsky, and Rogerio Feris. Chartgen: Scaling chart understanding via code-guided synthetic chart gener- ation, 2025. 3
work page 2025
-
[27]
Multimodal ArXiv: A dataset for improving scientific comprehension of large vision-language models
Lei Li, Yuqi Wang, Runxin Xu, Peiyi Wang, Xiachong Feng, Lingpeng Kong, and Qi Liu. Multimodal ArXiv: A dataset for improving scientific comprehension of large vision-language models. InProceedings of the 62nd An- nual Meeting of the Association for Computational Linguis- tics (Volume 1: Long Papers), Bangkok, Thailand, 2024. As- sociation for Computation...
work page 2024
-
[28]
Chart- cap: Mitigating hallucination of dense chart captioning
Junyoung Lim, Jaewoo Ahn, and Gunhee Kim. Chart- cap: Mitigating hallucination of dense chart captioning. In Proceedings of the IEEE/CVF International Conference on Computer Vision, 2025. 7
work page 2025
-
[29]
Mmc: Advancing multimodal chart understanding with large-scale instruction tuning, 2024
Fuxiao Liu, Xiaoyang Wang, Wenlin Yao, Jianshu Chen, Kaiqiang Song, Sangwoo Cho, Yaser Yacoob, and Dong Yu. Mmc: Advancing multimodal chart understanding with large-scale instruction tuning, 2024. 2
work page 2024
-
[30]
Improved baselines with visual instruction tuning, 2023
Haotian Liu, Chunyuan Li, Yuheng Li, and Yong Jae Lee. Improved baselines with visual instruction tuning, 2023. 2, 6
work page 2023
-
[31]
Synchart: Synthesizing charts from language models, 2024
Mengchen Liu, Qixiu Li, Dongdong Chen, Dong Chen, Jian- min Bao, and Yunsheng Li. Synchart: Synthesizing charts from language models, 2024. 2
work page 2024
-
[33]
Nikolaos Livathinos, Christoph Auer, Maksym Lysak, Ahmed Nassar, Michele Dolfi, Panos Vagenas, Ce- sar Berrospi Ramis, Matteo Omenetti, Kasper Dinkla, Yusik Kim, et al. Docling: An efficient open-source toolkit for ai-driven document conversion.arXiv preprint arXiv:2501.17887, 2025. 6
-
[34]
SmolVLM: Redefining small and efficient multimodal models
Andr ´es Marafioti, Orr Zohar, Miquel Farr ´e, Merve Noyan, Elie Bakouch, Pedro Cuenca, Cyril Zakka, Loubna Ben Allal, Anton Lozhkov, Nouamane Tazi, et al. Smolvlm: Redefining small and efficient multimodal models.arXiv preprint arXiv:2504.05299, 2025. 6
work page internal anchor Pith review Pith/arXiv arXiv 2025
-
[35]
Ok-vqa: A visual question answering benchmark requiring external knowledge
Kenneth Marino, Mohammad Rastegari, Ali Farhadi, and Roozbeh Mottaghi. Ok-vqa: A visual question answering benchmark requiring external knowledge. InProceedings of the IEEE/cvf conference on computer vision and pattern recognition, 2019. 3
work page 2019
-
[36]
Chartqa: A benchmark for question an- swering about charts with visual and logical reasoning, 2022
Ahmed Masry, Do Xuan Long, Jia Qing Tan, Shafiq Joty, and Enamul Hoque. Chartqa: A benchmark for question an- swering about charts with visual and logical reasoning, 2022. 2
work page 2022
-
[37]
Ahmed Masry, Parsa Kavehzadeh, Xuan Long Do, Ena- mul Hoque, and Shafiq Joty. Unichart: A universal vision- language pretrained model for chart comprehension and rea- soning, 2023. 2
work page 2023
-
[38]
Chartgemma: Vi- sual instruction-tuning for chart reasoning in the wild, 2024
Ahmed Masry, Megh Thakkar, Aayush Bajaj, Aaryaman Kartha, Enamul Hoque, and Shafiq Joty. Chartgemma: Vi- sual instruction-tuning for chart reasoning in the wild, 2024. 7
work page 2024
-
[39]
Ahmed Masry, Mohammed Saidul Islam, Mahir Ahmed, Aayush Bajaj, Firoz Kabir, Aaryaman Kartha, Md Tah- mid Rahman Laskar, Mizanur Rahman, Shadikur Rahman, Mehrad Shahmohammadi, et al. Chartqapro: A more di- verse and challenging benchmark for chart question answer- ing.arXiv preprint arXiv:2504.05506, 2025. 2
-
[40]
Fanqing Meng, Wenqi Shao, Quanfeng Lu, Peng Gao, Kaipeng Zhang, Yu Qiao, and Ping Luo. Chartassisstant: A universal chart multimodal language model via chart-to- table pre-training and multitask instruction tuning, 2024. 2
work page 2024
-
[41]
The llama 4 herd: The beginning of a new era of natively multimodal ai innovation.https://ai
AI Meta. The llama 4 herd: The beginning of a new era of natively multimodal ai innovation.https://ai. meta. com/blog/llama-4-multimodal-intelligence/, 2025. 2
work page 2025
-
[42]
Plotqa: Reasoning over scientific plots,
Nitesh Methani et al. Plotqa: Reasoning over scientific plots,
-
[43]
Scientific chart qa: A per- spective from scientific literature, 2024
Authors omitted here for brevity. Scientific chart qa: A per- spective from scientific literature, 2024. 2
work page 2024
-
[44]
Chartgalaxy: A dataset for infographic chart understanding and generation, 2025
Authors omitted here for brevity. Chartgalaxy: A dataset for infographic chart understanding and generation, 2025. 2
work page 2025
-
[45]
Chartreasoner: Code- driven modality bridging for long-context chart reasoning,
Authors omitted here for brevity. Chartreasoner: Code- driven modality bridging for long-context chart reasoning,
-
[46]
Our world in data.https : / / ourworldindata.org/, 2025
OWID. Our world in data.https : / / ourworldindata.org/, 2025. 5
work page 2025
-
[47]
Pew research center.https : / / www
Pew. Pew research center.https : / / www . pewresearch.org/, 2025. 5
work page 2025
-
[48]
La- tent chain-of-thought for visual reasoning.arXiv preprint arXiv:2510.23925, 2025
Guohao Sun, Hang Hua, Jian Wang, Jiebo Luo, Sohail Di- anat, Majid Rabbani, Raghuveer Rao, and Zhiqiang Tao. La- tent chain-of-thought for visual reasoning.arXiv preprint arXiv:2510.23925, 2025. 2
-
[49]
Tang, Angie Boggust, and Arvind Satyanarayan
Benny J. Tang, Angie Boggust, and Arvind Satyanarayan. Vistext: A benchmark for semantically rich chart captioning,
-
[50]
Yunlong Tang, Junjia Guo, Hang Hua, Susan Liang, Mingqian Feng, Xinyang Li, Rui Mao, Chao Huang, Jing Bi, Zeliang Zhang, et al. Vidcomposition: Can mllms ana- lyze compositions in compiled videos? InProceedings of the Computer Vision and Pattern Recognition Conference, 2025. 3
work page 2025
-
[51]
Granite Vision Team, Leonid Karlinsky, Assaf Arbelle, Abraham Daniels, Ahmed Nassar, Amit Alfassi, Bo Wu, Eli Schwartz, Dhiraj Joshi, Jovana Kondic, et al. Granite vision: a lightweight, open-source multimodal model for enterprise intelligence.arXiv preprint arXiv:2502.09927, 2025. 3, 6
-
[52]
Kimi Team, Angang Du, Bohong Yin, Bowei Xing, Bowen Qu, Bowen Wang, Cheng Chen, Chenlin Zhang, Chen- zhuang Du, Chu Wei, et al. Kimi-vl technical report.arXiv preprint arXiv:2504.07491, 2025. 2
work page internal anchor Pith review Pith/arXiv arXiv 2025
- [53]
-
[54]
Trl: Trans- former reinforcement learning.https://github.com/ huggingface/trl, 2020
Leandro von Werra, Younes Belkada, Lewis Tunstall, Ed- ward Beeching, Tristan Thrush, Nathan Lambert, Shengyi 10 Huang, Kashif Rasul, and Quentin Gallou ´edec. Trl: Trans- former reinforcement learning.https://github.com/ huggingface/trl, 2020. 6
work page 2020
-
[55]
Charxiv: Charting gaps in realistic chart understand- ing in multimodal llms, 2024
Zirui Wang, Mengzhou Xia, Luxi He, Howard Chen, Yitao Liu, Richard Zhu, Kaiqu Liang, Xindi Wu, Haotian Liu, Sad- hika Malladi, Alexis Chevalier, Sanjeev Arora, and Danqi Chen. Charxiv: Charting gaps in realistic chart understand- ing in multimodal llms, 2024. 2
work page 2024
-
[56]
World bank open data.https://www
World Bank. World bank open data.https://www. worldbank.org/, 2025. 5
work page 2025
-
[57]
Chengyue Wu, Yixiao Ge, Qiushan Guo, Jiahao Wang, Zhix- uan Liang, Zeyu Lu, Ying Shan, and Ping Luo. Plot2code: A comprehensive benchmark for evaluating multi-modal large language models in code generation from scientific plots,
-
[58]
Structchart: On the schema, metric, and aug- mentation for visual chart understanding, 2024
Renqiu Xia, Haoyang Peng, Hancheng Ye, Mingsheng Li, Xiangchao Yan, Peng Ye, Botian Shi, Yu Qiao, Junchi Yan, and Bo Zhang. Structchart: On the schema, metric, and aug- mentation for visual chart understanding, 2024. 2
work page 2024
-
[59]
Renqiu Xia, Bo Zhang, Hancheng Ye, Xiangchao Yan, Qi Liu, Hongbin Zhou, Zijun Chen, Min Dou, Botian Shi, Junchi Yan, and Yu Qiao. Chartx & chartvlm: A versatile benchmark and foundation model for complicated chart rea- soning, 2025. 2
work page 2025
-
[60]
Llava-cot: Let vision language models reason step-by-step
Guowei Xu, Peng Jin, Ziang Wu, Hao Li, Yibing Song, Lichao Sun, and Li Yuan. Llava-cot: Let vision language models reason step-by-step. InProceedings of the IEEE/CVF International Conference on Computer Vision, 2025. 4, I
work page 2025
-
[61]
Chartbench: A benchmark for complex visual reasoning in charts, 2024
Zhengzhuo Xu, Sinan Du, Yiyan Qi, Chengjin Xu, Chun Yuan, and Jian Guo. Chartbench: A benchmark for complex visual reasoning in charts, 2024. 2
work page 2024
-
[62]
Chartmimic: Evaluating lmm’s cross-modal reason- ing capability via chart-to-code generation, 2025
Cheng Yang, Chufan Shi, Yaxin Liu, Bo Shui, Junjie Wang, Mohan Jing, Linran Xu, Xinyu Zhu, Siheng Li, Yuxiang Zhang, Gongye Liu, Xiaomei Nie, Deng Cai, and Yujiu Yang. Chartmimic: Evaluating lmm’s cross-modal reason- ing capability via chart-to-code generation, 2025. 2, 7, XI
work page 2025
-
[63]
Scaling text-rich image understanding via code- guided synthetic multimodal data generation, 2025
Yue Yang, Ajay Patel, Matt Deitke, Tanmay Gupta, Luca Weihs, Andrew Head, Mark Yatskar, Chris Callison-Burch, Ranjay Krishna, Aniruddha Kembhavi, and Christopher Clark. Scaling text-rich image understanding via code- guided synthetic multimodal data generation, 2025. 2, 3
work page 2025
-
[64]
Liang Zhang, Anwen Hu, Haiyang Xu, Ming Yan, Yichen Xu, Qin Jin, Ji Zhang, and Fei Huang. Tinychart: Efficient chart understanding with visual token merging and program- of-thoughts learning, 2024. 2, 3
work page 2024
-
[65]
Gpt-4v(ision) as a generalist evalu- ator for vision-language tasks, 2023
Xinlu Zhang, Yujie Lu, Weizhi Wang, An Yan, Jun Yan, Lianke Qin, Heng Wang, Xifeng Yan, William Yang Wang, and Linda Ruth Petzold. Gpt-4v(ision) as a generalist evalu- ator for vision-language tasks, 2023. XI
work page 2023
-
[66]
Chartcoder: Advancing multimodal large language model for chart-to- code generation, 2025
Xuanle Zhao, Xianzhen Luo, Qi Shi, Chi Chen, Shuo Wang, Wanxiang Che, Zhiyuan Liu, and Maosong Sun. Chartcoder: Advancing multimodal large language model for chart-to- code generation, 2025. 2
work page 2025
-
[67]
InternVL3: Exploring Advanced Training and Test-Time Recipes for Open-Source Multimodal Models
Jinguo Zhu, Weiyun Wang, Zhe Chen, Zhaoyang Liu, Shen- glong Ye, Lixin Gu, Hao Tian, Yuchen Duan, Weijie Su, Jie Shao, et al. Internvl3: Exploring advanced training and test-time recipes for open-source multimodal models.arXiv preprint arXiv:2504.10479, 2025. 2
work page internal anchor Pith review Pith/arXiv arXiv 2025
-
[68]
Multimodal C4: An open, billion-scale corpus of images interleaved with text
Wanrong Zhu, Jack Hessel, Anas Awadalla, Samir Yitzhak Gadre, Jesse Dodge, Alex Fang, Youngjae Yu, Ludwig Schmidt, William Yang Wang, and Yejin Choi. Multimodal C4: An open, billion-scale corpus of images interleaved with text.arXiv preprint arXiv:2304.06939, 2023. 3 11 ChartNet: A Million-Scale, High-Quality Multimodal Dataset for Robust Chart Understand...
-
[69]
Identify which item has the highest metric value **and** the highest value range
-
[70]
Compare the position of that item to the item wi th the lowest metric value **and** the lowest value range, specifical ly in terms of how far each is from the plot’s center. From the image description we have a list of six ite ms with their (x, y) coordinates, where x = Metric Values and y = Value R ange. - item1: (60, 40) - item2: (20, 15) - item3: (20, ...
work page 2017
-
[71]
Missing or Incomplete Data: Is the chart blank or missing content? Are expected elements like bars, lines, or segments missing?
-
[72]
Labeling Issues: Are axis labels clear, complete, and readable? Are category or tick labels truncated or overlapping?
-
[73]
Legend Issues: Are legends accurate and consistent with the chart? Are legends readable? Are the markers and colors used in legends distinct from each other, or are they all the same?
-
[74]
Data Representation Problems: Are the elements (bars, bubbles, lines) overlapping in such a way that makes it difficult to read or interpret? Are the colors or sizes misleading or unexplained?
-
[75]
Semantic Issues: Does the title accurately describe what is visualized? Does the chart type match the data (e.g., don’t use violin plot visuals for scatter plots)? Do the segments (e.g., in pie charts) sum to 100% if they should?
-
[76]
Visual Accessibility and Clarity Issues: Are background grids too faint or too heavy? Is the font size legible?
-
[77]
Inconsistent or Unclear Scale Issues: Is the scale uniform and logical across the axis?
-
[78]
Other Issues: List any other issues that you found that could impact the readability of the image. **ANSWER FORMAT: ** Respond in the following JSON format, where you first give a brief explanation for your evaluation and then either "Yes" or "No": ‘‘‘json { "1. Missing or Incomplete Data": [<Evaluation explanation>, <"Yes" | "No">], "2. Labeling Issues":...
-
[79]
Where is the <element>?
-
[80]
What is the <element>?
-
[81]
Where are the <elements>?
discussion (0)
Sign in with ORCID, Apple, or X to comment. Anyone can read and Pith papers without signing in.