Recognition: no theorem link
A Large-Scale Empirical Comparison of Meta-Learners and Causal Forests for Heterogeneous Treatment Effect Estimation in Marketing Uplift Modeling
Pith reviewed 2026-05-10 18:05 UTC · model grok-4.3
The pith
The S-learner outperforms T-learner, X-learner, and causal forest on a 14-million-record marketing dataset.
A machine-rendered reading of the paper's core claim, the machinery that carries it, and where it could break.
Core claim
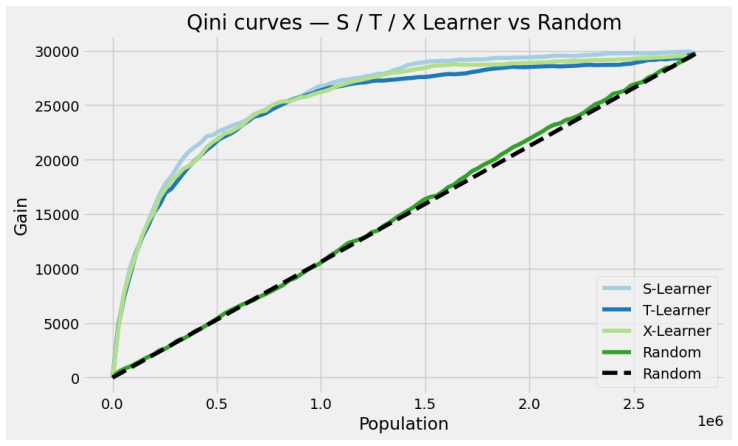
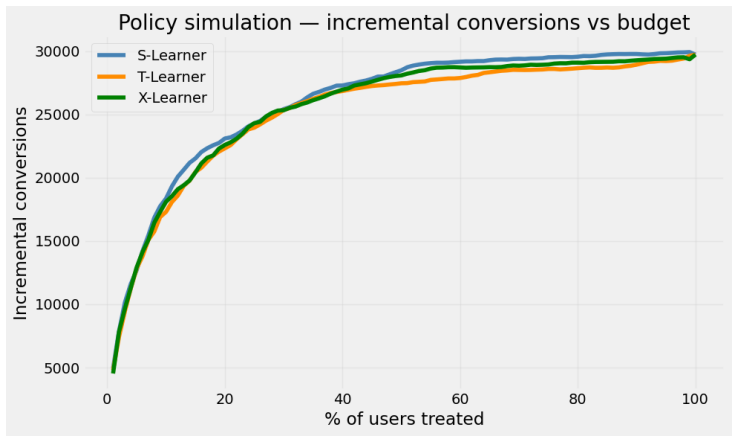
On the Criteo Uplift v2.1 dataset the S-learner achieves a Qini score of 0.376; the top 20 percent of customers ranked by its predicted conditional average treatment effects account for 77.7 percent of incremental conversions, a 3.9-fold improvement over random targeting. Among the four methods compared, the S-learner ranks first by both Qini coefficient and cumulative gain curves. The causal forest supplies 95 percent confidence intervals that identify 1.9 percent of customers as confident persuadables and 0.1 percent as confident sleeping dogs. SHAP analysis across the twelve covariates shows that feature f8 is the dominant driver of heterogeneous treatment effects.
What carries the argument
The S-learner meta-estimator, which fits a single supervised model on treated and control observations together while including the treatment indicator as an input feature to recover individual conditional average treatment effects.
If this is right
- Targeting the top 20 percent of customers identified by the S-learner yields nearly four times the incremental conversions of random selection.
- Causal forests can be run alongside the S-learner to flag the small subset of customers whose treatment effects are statistically distinguishable from zero.
- Feature f8 emerges as the primary source of variation in treatment response and can be prioritized in future model building.
- Uplift pipelines at industrial scale can start with the simpler S-learner before adding more complex estimators.
Where Pith is reading between the lines
- When sample size reaches the tens of millions and treatment is nearly randomized, the added complexity of separate models or forest-based methods may not improve ranking performance over a single combined model.
- The low fraction of customers with confident non-zero effects suggests that most marketing interventions produce effects too small or variable to detect reliably at the individual level.
- Results from this near-randomized experiment can serve as a benchmark for testing whether other estimators retain their ranking when assignment becomes more selective.
Load-bearing premise
The near-random treatment assignment together with the Qini and cumulative-gain metrics are sufficient to identify the best estimator for real-world marketing decisions.
What would settle it
A replication study on another large marketing dataset that uses the same near-random assignment but finds a different estimator achieving a higher Qini score.
Figures


read the original abstract
Estimating Conditional Average Treatment Effects (CATE) at the individual level is central to precision marketing, yet systematic benchmarking of uplift modeling methods at industrial scale remains limited. We present UpliftBench, an empirical evaluation of four CATE estimators: S-Learner, T-Learner, X-Learner (all with LightGBM base learners), and Causal Forest (EconML), applied to the Criteo Uplift v2.1 dataset comprising 13.98 million customer records. The near-random treatment assignment (propensity AUC = 0.509) provides strong internal validity for causal estimation. Evaluated via Qini coefficient and cumulative gain curves, the S-Learner achieves the highest Qini score of 0.376, with the top 20% of customers ranked by predicted CATE capturing 77.7% of all incremental conversions, a 3.9x improvement over random targeting. SHAP analysis identifies f8 as the dominant heterogeneous treatment effect (HTE) driver among the 12 anonymized covariates. Causal Forest uncertainty quantification reveals that 1.9% of customers are confident persuadables (lower 95% CI > 0) and 0.1% are confident sleeping dogs (upper 95% CI < 0). Our results provide practitioners with evidence-based guidance on method selection for large-scale uplift modeling pipelines.
Editorial analysis
A structured set of objections, weighed in public.
Referee Report
Summary. The paper presents UpliftBench, a large-scale empirical benchmark of four CATE estimators (S-Learner, T-Learner, X-Learner with LightGBM base learners, and Causal Forest via EconML) on the Criteo Uplift v2.1 dataset of 13.98 million records. It reports that the S-Learner attains the highest Qini coefficient of 0.376, with the top 20% of customers by predicted CATE capturing 77.7% of incremental conversions (3.9x lift over random), identifies f8 as the leading HTE driver via SHAP, and uses Causal Forest to flag 1.9% confident persuadables and 0.1% confident sleeping dogs. The near-random assignment (propensity AUC 0.509) is cited to support internal validity.
Significance. If the reported ranking proves stable, the work supplies actionable, evidence-based guidance for method selection in industrial-scale uplift modeling pipelines. The scale of the public dataset, the near-random treatment assignment, and the inclusion of Causal Forest uncertainty quantification are concrete strengths that enhance reproducibility and practical relevance for marketing applications.
major comments (2)
- [Abstract and Results] Abstract and Results: The central performance claims (S-Learner Qini = 0.376, top-20% capture rate 77.7%) are reported as single point estimates on one train/test split with no bootstrap standard errors, repeated cross-validation folds, or paired statistical tests comparing Qini coefficients or cumulative gains across methods. This directly weakens the ability to assert superiority of the S-Learner.
- [Methods] Methods: No information is provided on hyperparameter search ranges, tuning algorithm, number of cross-validation folds, or early-stopping criteria for the LightGBM implementations or the Causal Forest. These details are load-bearing for interpreting whether the observed ranking reflects estimator properties or implementation-specific choices.
minor comments (2)
- [Abstract] The propensity AUC of 0.509 is stated without a confidence interval or the exact procedure used to compute it, which would help readers gauge how close to random the assignment truly is.
- [Figures] Figure captions for the cumulative gain curves and SHAP plots should explicitly state the number of bootstrap replicates or resampling scheme used, if any.
Simulated Author's Rebuttal
We thank the referee for the constructive feedback on our manuscript. We address each major comment below and outline the revisions we will make to strengthen the paper.
read point-by-point responses
-
Referee: [Abstract and Results] Abstract and Results: The central performance claims (S-Learner Qini = 0.376, top-20% capture rate 77.7%) are reported as single point estimates on one train/test split with no bootstrap standard errors, repeated cross-validation folds, or paired statistical tests comparing Qini coefficients or cumulative gains across methods. This directly weakens the ability to assert superiority of the S-Learner.
Authors: We agree that uncertainty quantification would strengthen the claims. The single split was chosen due to the computational demands of the 13.98M-record dataset, but we will add bootstrap standard errors (1,000 resamples of the test set) and 95% confidence intervals for all Qini coefficients and cumulative gains in the revised Results section. We will also include a brief comparison of the gain curves with variability bands. This addresses the concern without altering the core ranking. revision: yes
-
Referee: [Methods] Methods: No information is provided on hyperparameter search ranges, tuning algorithm, number of cross-validation folds, or early-stopping criteria for the LightGBM implementations or the Causal Forest. These details are load-bearing for interpreting whether the observed ranking reflects estimator properties or implementation-specific choices.
Authors: We acknowledge the omission and will add a new subsection to the Methods section detailing the hyperparameter grids (e.g., LightGBM learning_rate [0.01, 0.1], num_leaves [31, 127], min_data_in_leaf [20, 100]), the tuning procedure (random search over 50 configurations with 5-fold CV on a 10% validation holdout), early-stopping (patience of 50 rounds on validation AUC), and Causal Forest settings (EconML defaults with n_estimators=1000 and min_samples_leaf=10). The code repository will be updated with the exact configurations used. revision: yes
Circularity Check
No circularity: purely empirical evaluation on external public dataset
full rationale
The paper performs a direct empirical benchmarking of four standard CATE estimators (S-Learner, T-Learner, X-Learner with LightGBM, and Causal Forest) on the public Criteo Uplift v2.1 dataset of 13.98M records. No derivation chain, first-principles result, or prediction is claimed; all reported quantities (Qini scores, cumulative gains, SHAP values, uncertainty intervals) are computed outputs from applying off-the-shelf methods to fixed external data. Propensity AUC=0.509 is measured directly from the data, not fitted as part of any self-referential loop. No self-citations, ansatzes, or uniqueness theorems are invoked to justify the core results. The evaluation is therefore self-contained against external benchmarks and exhibits none of the enumerated circularity patterns.
Axiom & Free-Parameter Ledger
axioms (2)
- domain assumption Near-random treatment assignment (propensity AUC = 0.509) implies strong internal validity for CATE estimation
- domain assumption Qini coefficient and cumulative gain curves are appropriate and sufficient metrics for comparing uplift models
Reference graph
Works this paper leans on
-
[1]
Athey, S., Tibshirani, J., & Wager, S. (2019). Generalized random forests.Annals of Statistics, 47(2), 1148–1178
2019
-
[2]
Battocchi, K., et al. (2019). EconML: A Python pack- age for ML-based heterogeneous treatment effects estima- tion.GitHub. https://github.com/microsoft/ EconML
2019
-
[3]
Curth, A., & van der Schaar, M. (2021). Nonparamet- ric estimation of heterogeneous treatment effects: From theory to learning algorithms.Proceedings of AISTATS
2021
-
[4]
Devriendt, F., et al. (2020). A literature survey and experi- mental evaluation of the state-of-the-art in uplift modeling. Journal of Machine Learning Research
2020
-
[5]
Diemert, E., Betlei, A., Renaudin, C., & Amini, M.R. (2018). A large scale benchmark for uplift modeling.Pro- ceedings of KDD
2018
-
[6]
Gubela, R., et al. (2019). Conversion uplift in e-commerce. International Journal of Information Technology & Deci- sion Making
2019
-
[7]
Holland, P. W. (1986). Statistics and causal inference. Journal of the American Statistical Association, 81(396), 945–960
1986
-
[8]
R., Sekhon, J
K¨unzel, S. R., Sekhon, J. S., Bickel, P. J., & Yu, B. (2019). Metalearners for estimating heterogeneous treatment ef- fects using machine learning.Proceedings of the National Academy of Sciences, 116(10), 4156–4165
2019
-
[9]
Radcliffe, N. J. (2007). Using control groups to target on predicted lift.Direct Marketing Analytics Journal
2007
-
[10]
Rubin, D. B. (1974). Estimating causal effects of treat- ments in randomized and nonrandomized studies.Journal of Educational Psychology, 66(5), 688–701
1974
-
[11]
Wager, S., & Athey, S. (2018). Estimation and inference of heterogeneous treatment effects using random forests. Journal of the American Statistical Association, 113(523), 1228–1242. 5
2018
discussion (0)
Sign in with ORCID, Apple, or X to comment. Anyone can read and Pith papers without signing in.