Recognition: unknown
ALESS--JWST: Dust-driven Morphologies and Hidden Stellar Mass in zsim3 Sub-millimeter Galaxies
Pith reviewed 2026-05-10 13:22 UTC · model grok-4.3
The pith
Spatially varying dust attenuation in z~3 submillimeter galaxies creates a dust-obscuration bias that misses stellar mass in integrated fits.
A machine-rendered reading of the paper's core claim, the machinery that carries it, and where it could break.
Core claim
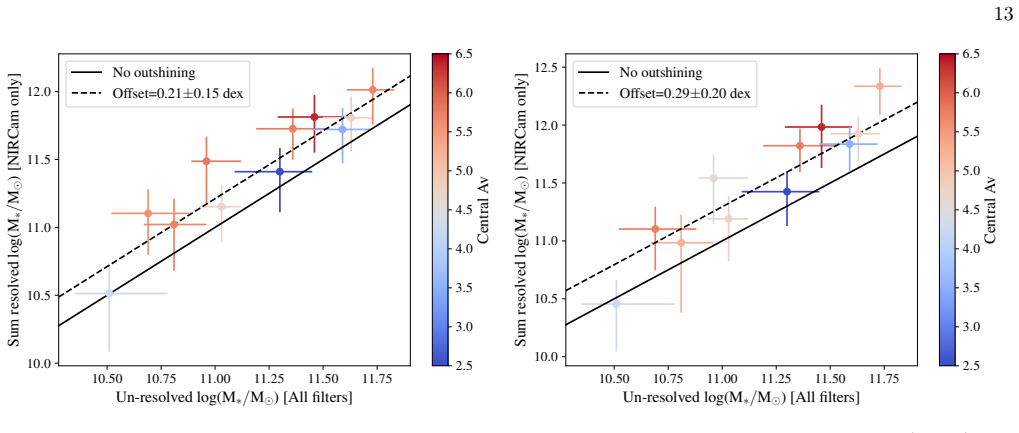
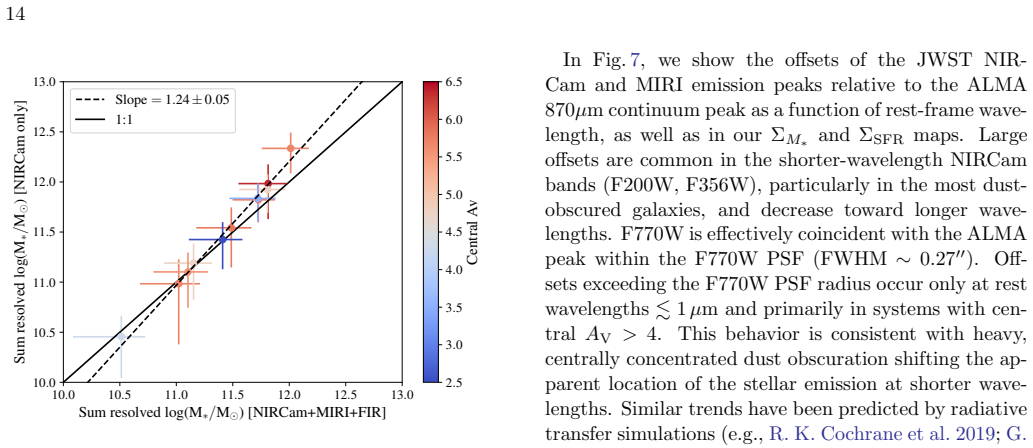
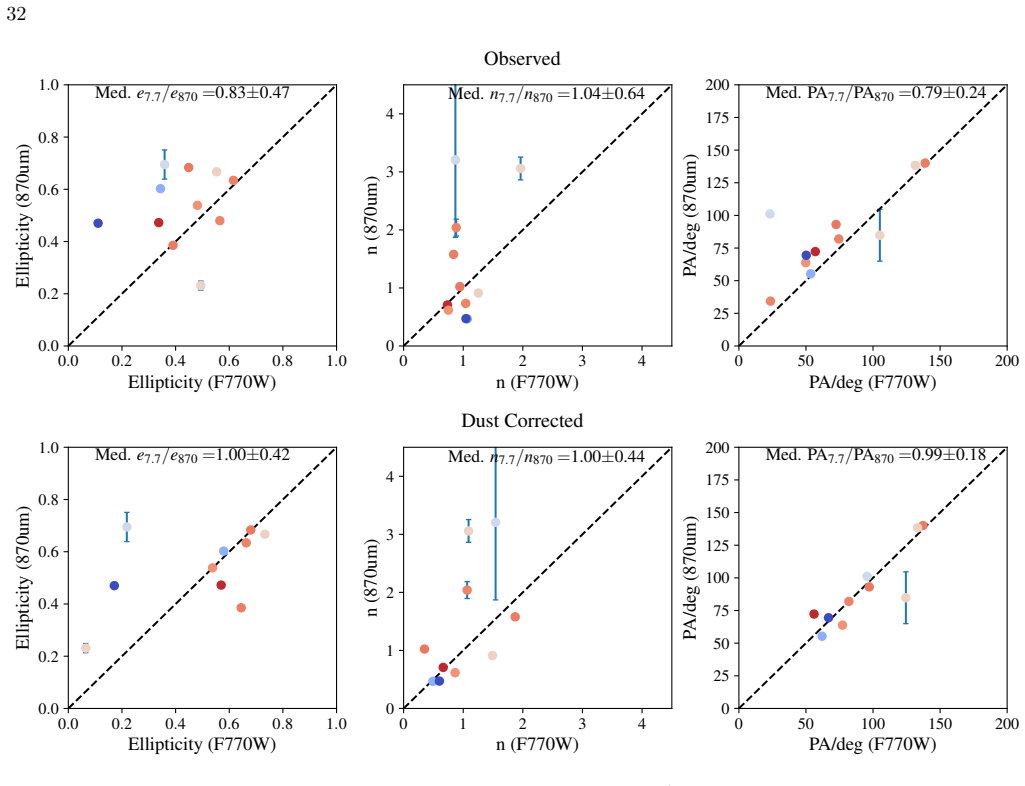
Resolved SED fitting reveals a systematic stellar mass bias in integrated fits even with rest-frame ~2um MIRI imaging. Rather than classical outshining, this bias is driven by spatially varying dust attenuation, creating a dust-obscuration bias that misses obscured stellar mass. Morphologies are wavelength-dependent: central obscuration at rest-frame optical wavelengths produces stellar-dust offsets and inflated sizes, while these effects diminish at longer wavelengths. Rest-frame ~1.5-3um MIRI imaging reveals compact stellar structures matching the 870um dust continuum. Centrally concentrated dust attenuation drives both offsets and size variations, and intrinsic stellar mass and dust sizes
What carries the argument
Spatially resolved SED fitting on ~kpc scales using JWST NIRCam/MIRI combined with high-resolution ALMA 870um imaging to isolate effects of spatially varying dust attenuation.
If this is right
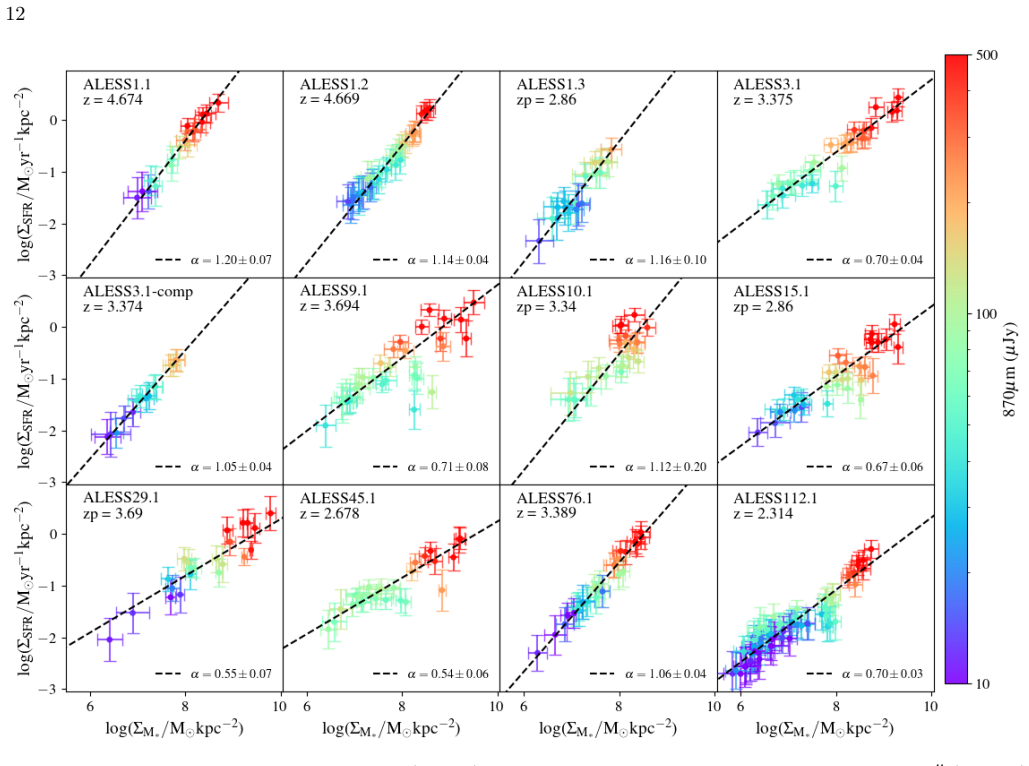
- Star formation remains tightly coupled to local stellar mass distribution, forming a resolved star-forming main sequence even in these obscured systems.
- Galaxy morphologies measured at rest-frame wavelengths less than or equal to 1.6um can be significantly biased without longer-wavelength constraints.
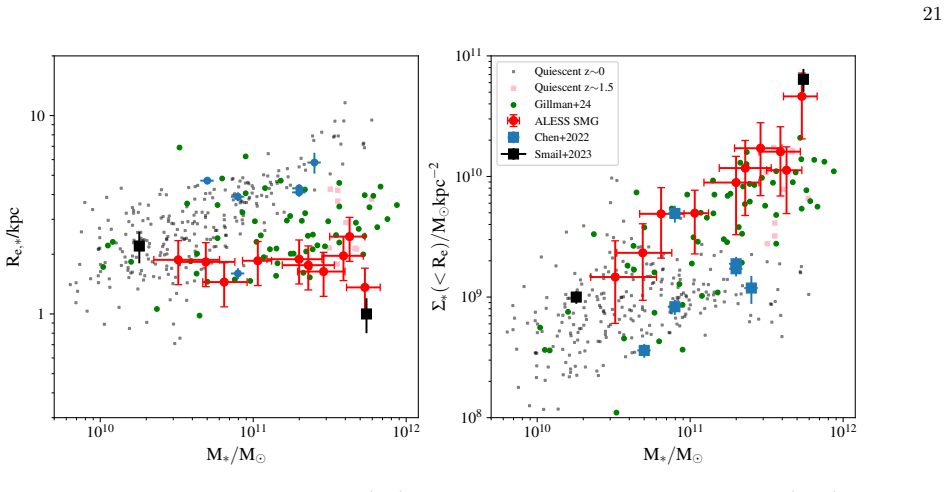
- The consistent sizes between stellar mass and dust continuum support a picture of compact obscured star formation building dense stellar cores that evolve into massive quiescent galaxies.
- Obscured structures and associated biases may be common among massive star-forming galaxies at redshifts greater than or equal to 1.
Where Pith is reading between the lines
- Similar dust-obscuration effects could systematically underestimate stellar masses in other high-redshift galaxy populations observed with limited mid-infrared coverage.
- Surveys aiming for accurate high-z mass functions should include mid-infrared data to reduce biases in both mass and size measurements.
- The tight stellar-dust size match points to a co-evolution process where dust both traces and conceals the sites of active mass assembly.
- Accounting for this bias may help reconcile observed stellar mass densities with predictions from galaxy formation models at early times.
Load-bearing premise
The spatially resolved SED fitting on kpc scales with the chosen models and wavelength coverage accurately isolates the effects of spatially varying dust attenuation from other variables such as star-formation history or resolution limits.
What would settle it
A direct comparison showing that the total stellar mass summed from resolved fits equals the integrated fit mass for the full sample even when using only shorter-wavelength data, or independent dust maps showing no spatial correlation with the mass discrepancies.
Figures


read the original abstract
We present JWST/NIRCam and MIRI observations of twelve $z\sim3$ sub-millimeter galaxies (SMGs) from the ALESS survey, combined with high-resolution ($0.08''-0.16''$) ALMA 870$\mu$m imaging, enabling spatially resolved SED fitting on $\sim$kpc scales. We find a resolved star-forming main sequence linking surface densities of star formation rate and stellar mass, suggesting star formation remains tightly coupled to local mass distribution even in obscured systems. Our resolved SED analysis reveals a systematic stellar mass bias in integrated fits, even including rest-frame $\sim2\mu$m MIRI imaging. Rather than classical `outshining', this is mainly driven by spatially varying dust attenuation, indicating a `dust-obscuration bias' that causes obscured stellar mass to be missed. We show SMG morphologies are wavelength-dependent. At rest-frame optical wavelengths, central obscuration produces stellar-dust offsets and inflated sizes, while at longer wavelengths these effects diminish. The rest-frame $\sim1.5-3\mu$m MIRI imaging is less affected by dust than NIRCam and reveals compact stellar structures matching the 870$\mu$m dust continuum. We find centrally concentrated dust attenuation drives both offsets and size variations, demonstrating dust geometry is the main driver of structural diversity. Consequently, morphologies from rest-frame wavelengths $\lesssim1.6\mu$m can be biased without longer-wavelength constraints. The intrinsic stellar mass and dust continuum sizes are consistent ($R_\mathrm{e,870\mu m}/R_\mathrm{e,\ast}=1.0\pm0.4$), supporting a picture in which SMGs host compact, obscured star formation that builds dense stellar cores, consistent with evolution into massive quiescent galaxies. We suggest such obscured structures and associated biases may also be common among massive star-forming galaxies at $z\gtrsim1$, implying these effects are likely of broad relevance.
Editorial analysis
A structured set of objections, weighed in public.
Referee Report
Summary. The paper reports JWST/NIRCam+MIRI observations of 12 z~3 ALESS SMGs combined with high-resolution ALMA 870μm imaging. Spatially resolved SED fitting on ~kpc scales is used to identify a resolved star-forming main sequence, demonstrate that integrated stellar-mass estimates suffer a systematic underestimate even with rest-frame ~2μm MIRI data, attribute this bias primarily to spatially varying dust attenuation ('dust-obscuration bias') rather than classical outshining, and show that dust geometry drives wavelength-dependent morphologies and size offsets. The intrinsic stellar and dust-continuum sizes are found to be consistent, supporting compact obscured star formation that builds dense cores en route to massive quiescent galaxies.
Significance. If the separation of dust-attenuation effects from SFH/metallicity degeneracies holds, the work provides direct evidence for a previously under-appreciated bias in stellar-mass recovery for dusty high-z galaxies and links observed morphological diversity to dust geometry. The resolved main-sequence result and the R_e,870μm / R_e,* ~1 consistency are concrete, testable findings that bear on SMG evolutionary pathways. The inclusion of MIRI photometry to reach rest-frame near-IR is a clear technical strength that improves constraints relative to NIRCam-only studies.
major comments (2)
- [Abstract and resolved-SED analysis] Abstract and resolved-SED section: the central claim that the integrated stellar-mass underestimate is driven by spatially varying dust attenuation (rather than outshining) rests on the assumption that kpc-scale SED fits with the adopted SPS models, attenuation curves, and SFH parametrizations correctly isolate attenuation from age and metallicity effects. With only broadband NIRCam+MIRI photometry at z~3, age-dust-metallicity degeneracies remain; no quantitative robustness tests (e.g., varying SFH priors, attenuation-law families, or mock recovery experiments) are described to show that extra mass recovered in high-A_V pixels is not an artifact of model choice.
- [Methods and results] Methods and results sections: the manuscript provides no quantitative details on the SED-fitting procedure, including the specific code or templates employed, the treatment of error propagation, the handling of spatially correlated noise, or sample-completeness corrections. These omissions directly limit verification that the reported stellar-mass bias and the dust-obscuration interpretation are robust to reasonable variations in modeling assumptions.
minor comments (2)
- [Figures and text] Figure captions and text should explicitly state the rest-frame wavelengths sampled by each NIRCam and MIRI filter at the median redshift of the sample to aid reader interpretation of the wavelength-dependent morphology claims.
- [Discussion] The statement that morphologies from rest-frame wavelengths ≲1.6 μm 'can be biased' would benefit from a quantitative comparison (e.g., size or offset statistics) between NIRCam-only and NIRCam+MIRI fits for the same objects.
Simulated Author's Rebuttal
We are grateful to the referee for their careful reading of our manuscript and for the constructive major comments. We agree that enhancing the description of our methods and providing robustness tests will improve the paper. Below we respond to each comment in turn, indicating the revisions we will make.
read point-by-point responses
-
Referee: [Abstract and resolved-SED analysis] Abstract and resolved-SED section: the central claim that the integrated stellar-mass underestimate is driven by spatially varying dust attenuation (rather than outshining) rests on the assumption that kpc-scale SED fits with the adopted SPS models, attenuation curves, and SFH parametrizations correctly isolate attenuation from age and metallicity effects. With only broadband NIRCam+MIRI photometry at z~3, age-dust-metallicity degeneracies remain; no quantitative robustness tests (e.g., varying SFH priors, attenuation-law families, or mock recovery experiments) are described to show that extra mass recovered in high-A_V pixels is not an artifact of model choice.
Authors: We acknowledge that the submitted manuscript does not present quantitative robustness tests such as mock recovery experiments or systematic variations in SFH priors and attenuation laws. Our analysis relies on standard SPS models and attenuation curves, and the physical consistency with the ALMA 870μm sizes and the resolved main sequence provides supporting evidence for the dust-obscuration interpretation. Nevertheless, to strengthen the claim, we will add a dedicated subsection in the revised manuscript describing mock SED fitting experiments. These will include simulated galaxies with known stellar mass distributions, varying dust geometries, SFHs, and metallicities to demonstrate that the recovered extra mass in high-A_V regions is not driven by model degeneracies. revision: yes
-
Referee: [Methods and results] Methods and results sections: the manuscript provides no quantitative details on the SED-fitting procedure, including the specific code or templates employed, the treatment of error propagation, the handling of spatially correlated noise, or sample-completeness corrections. These omissions directly limit verification that the reported stellar-mass bias and the dust-obscuration interpretation are robust to reasonable variations in modeling assumptions.
Authors: We agree that the Methods section in the submitted version lacks sufficient quantitative detail for full reproducibility and verification. We will substantially expand this section in the revision to include: the specific SED-fitting code and version used, the stellar population synthesis templates and libraries, the exact parametrization of SFHs and attenuation curves, details on photometric error propagation (accounting for spatially correlated noise in the JWST and ALMA images), and any sample completeness or selection corrections applied. This will allow readers to assess the robustness to modeling assumptions. revision: yes
Circularity Check
No significant circularity; analysis relies on new data and standard methods
full rationale
The paper presents new JWST/NIRCam+MIRI and ALMA observations of z~3 SMGs and applies standard spatially resolved SED fitting on kpc scales to compare integrated versus resolved stellar masses and morphologies. The claimed dust-obscuration bias follows directly from these data-driven comparisons without any self-definitional equations, fitted inputs renamed as predictions, or load-bearing self-citations that reduce the result to its own inputs by construction. The derivation chain is self-contained and externally falsifiable via the provided photometry and imaging.
Axiom & Free-Parameter Ledger
axioms (1)
- domain assumption Standard assumptions in stellar population synthesis and dust attenuation models for high-redshift galaxies
Reference graph
Works this paper leans on
-
[1]
2017, MNRAS, 469, 2806, doi: 10.1093/mnras/stx936 Astropy Collaboration, Price-Whelan, A
Abdurro’uf, & Akiyama, M. 2017, MNRAS, 469, 2806, doi: 10.1093/mnras/stx936 Astropy Collaboration, Price-Whelan, A. M., Lim, P. L., et al. 2022, apj, 935, 167, doi: 10.3847/1538-4357/ac7c74
-
[2]
2024, A&A, 683, A182, doi: 10.1051/0004-6361/202348419
Baes, M., Mosenkov, A., Kelly, R., et al. 2024, A&A, 683, A182, doi: 10.1051/0004-6361/202348419
-
[3]
Bagley, M. B., Finkelstein, S. L., Koekemoer, A. M., et al. 2023, ApJL, 946, L12, doi: 10.3847/2041-8213/acbb08
-
[4]
Baker, W. M., Maiolino, R., Bluck, A. F. L., et al. 2022, MNRAS, 510, 3622, doi: 10.1093/mnras/stab3672
-
[5]
The Journal of Open Source Software , year = 2016, month = oct, volume =
Barbary, K. 2016, Journal of Open Source Software, 1, 58, doi: 10.21105/joss.00058
-
[6]
Barger, A. J., Cowie, L. L., Sanders, D. B., et al. 1998, Nature, 394, 248, doi: 10.1038/28338
-
[7]
Barro, G., Faber, S. M., Koo, D. C., et al. 2017, ApJ, 840, 47, doi: 10.3847/1538-4357/aa6b05
-
[8]
Battisti, A. J., Cunha, E. d., Shivaei, I., & Calzetti, D. 2020, ApJ, 888, 108, doi: 10.3847/1538-4357/ab5fdd
-
[9]
J., da Cunha, E., Grasha, K., et al
Battisti, A. J., da Cunha, E., Grasha, K., et al. 2019, ApJ, 882, 61, doi: 10.3847/1538-4357/ab345d
-
[10]
A., et al., 2000, @doi [ ] 10.1086/301386 , 119, 2645
Bershady, M. A., Jangren, A., & Conselice, C. J. 2000, AJ, 119, 2645, doi: 10.1086/301386
-
[11]
1996, A&AS, 117, 393, doi: 10.1051/aas:1996164
Bertin, E., & Arnouts, S. 1996, A&AS, 117, 393, doi: 10.1051/aas:1996164
-
[12]
Birkin, J. E., Weiss, A., Wardlow, J. L., et al. 2021, MNRAS, 501, 3926, doi: 10.1093/mnras/staa3862
-
[13]
Frayer, D. T. 2002, PhR, 369, 111, doi: 10.1016/S0370-1573(02)00134-5
-
[14]
Bodansky, S., Whitaker, K. E., Abdullah, A., et al. 2025, arXiv e-prints, arXiv:2507.19472, doi: 10.48550/arXiv.2507.19472
-
[15]
A., Gillman, S., Melinder, J., et al
Boogaard, L. A., Gillman, S., Melinder, J., et al. 2024, ApJ, 969, 27, doi: 10.3847/1538-4357/ad43e5
-
[16]
A., Walter, F., Weiß, A., et al
Boogaard, L. A., Walter, F., Weiß, A., et al. 2026, ApJ, 996, 19, doi: 10.3847/1538-4357/ae14eb
-
[17]
Bradley, L., Sip˝ ocz, B., Robitaille, T., et al. 2022, astropy/photutils: 1.5.0, 1.5.0 Zenodo, doi: 10.5281/zenodo.6825092
-
[18]
2019, A&A, 632, A79, doi: 10.1051/0004-6361/201936643
Buat, V., Ciesla, L., Boquien, M., Ma lek, K., & Burgarella, D. 2019, A&A, 632, A79, doi: 10.1051/0004-6361/201936643
-
[19]
2023, JWST Calibration Pipeline, 1.11.3 Zenodo, doi: 10.5281/zenodo.8157276
Bushouse, H., Eisenhamer, J., Dencheva, N., et al. 2023, JWST Calibration Pipeline, 1.11.3 Zenodo, doi: 10.5281/zenodo.8157276
-
[20]
2024, JWST Calibration Pipeline, 1.13.4, Zenodo, doi: 10.5281/zenodo.10569856
Bushouse, H., Eisenhamer, J., Dencheva, N., et al. 2024, JWST Calibration Pipeline, 1.13.4 Zenodo, doi: 10.5281/zenodo.10569856 Calistro Rivera, G., Hodge, J. A., Smail, I., et al. 2018, ApJ, 863, 56, doi: 10.3847/1538-4357/aacffa Cano-D´ ıaz, M., S´ anchez, S. F., Zibetti, S., et al. 2016, ApJL, 821, L26, doi: 10.3847/2041-8205/821/2/L26
-
[21]
Cappellari, M., Emsellem, E., Krajnovi´ c, D., et al. 2011, MNRAS, 413, 813, doi: 10.1111/j.1365-2966.2010.18174.x 25
-
[22]
Cappellari, M., McDermid, R. M., Alatalo, K., et al. 2013, MNRAS, 432, 1862, doi: 10.1093/mnras/stt644
-
[23]
Cardamone, C. N., van Dokkum, P. G., Urry, C. M., et al. 2010, ApJS, 189, 270, doi: 10.1088/0067-0049/189/2/270
-
[24]
Dusty Star-Forming Galaxies at High Redshift
Casey, C. M., Narayanan, D., & Cooray, A. 2014, PhR, 541, 45, doi: 10.1016/j.physrep.2014.02.009
work page Pith review doi:10.1016/j.physrep.2014.02.009 2014
-
[25]
2003, PASP, 115, 763, doi: 10.1086/376392
Chabrier, G. 2003, PASP, 115, 763, doi: 10.1086/376392
work page internal anchor Pith review doi:10.1086/376392 2003
-
[26]
2025, arXiv e-prints, arXiv:2509.07913, doi: 10.48550/arXiv.2509.07913
Chan, S.-W., Ao, Y., & Tan, Q. 2025, arXiv e-prints, arXiv:2509.07913, doi: 10.48550/arXiv.2509.07913
-
[27]
Chen, C.-C., Smail, I., Swinbank, A. M., et al. 2015, The Astrophysical Journal, 799, 194, doi: 10.1088/0004-637X/799/2/194
-
[28]
Chen, C.-C., Hodge, J. A., Smail, I., et al. 2017, ApJ, 846, 108, doi: 10.3847/1538-4357/aa863a
-
[29]
2022, ApJL, 939, L7, doi: 10.3847/2041-8213/ac98c6
Chen, C.-C., Gao, Z.-K., Hsu, Q.-N., et al. 2022, ApJL, 939, L7, doi: 10.3847/2041-8213/ac98c6
-
[30]
2022, The Astrophysical Journal Letters, 936, L19, doi: 10.3847/2041-8213/ac8d08
Cheng, C., Yan, H., Huang, J.-S., et al. 2022, The Astrophysical Journal Letters, 936, L19, doi: 10.3847/2041-8213/ac8d08
-
[31]
2020, MNRAS, 499, 5241, doi: 10.1093/mnras/staa3036
Cheng, C., Ibar, E., Smail, I., et al. 2020, MNRAS, 499, 5241, doi: 10.1093/mnras/staa3036
-
[32]
2023, The Astrophysical Journal Letters, 942, L19, doi: 10.3847/2041-8213/aca9d0
Cheng, C., Huang, J.-S., Smail, I., et al. 2023, The Astrophysical Journal Letters, 942, L19, doi: 10.3847/2041-8213/aca9d0
-
[33]
Cochrane, R. K., Hayward, C. C., Angl´ es-Alc´ azar, D., et al. 2019, Monthly Notices of the Royal Astronomical Society, 488, 1779, doi: 10.1093/mnras/stz1736
-
[34]
Cochrane, R. K., Best, P. N., Smail, I., et al. 2021, MNRAS, 503, 2622, doi: 10.1093/mnras/stab467
-
[35]
Conselice, C. J. 2014, ARA&A, 52, 291, doi: 10.1146/annurev-astro-081913-040037
-
[36]
Conselice, C. J., Chapman, S. C., & Windhorst, R. A. 2003, ApJL, 596, L5, doi: 10.1086/379109 Crespo G´ omez, A., Colina, L.,´Alvarez-M´ arquez, J., et al. 2024, A&A, 691, A325, doi: 10.1051/0004-6361/202449750 da Cunha, E., Charlot, S., & Elbaz, D. 2008, MNRAS, 388, 1595, doi: 10.1111/j.1365-2966.2008.13535.x da Cunha, E., Walter, F., Smail, I. R., et al...
-
[37]
Danielson, A. L. R., Swinbank, A. M., Smail, I., et al. 2017, The Astrophysical Journal, 840, 78, doi: 10.3847/1538-4357/aa6caf Dudzeviˇ ci¯ ut˙ e, U., Smail, I., Swinbank, A. M., et al. 2020, MNRAS, 494, 3828, doi: 10.1093/mnras/staa769
-
[38]
1999, ApJ, 515, 518, doi: 10.1086/307069
Eales, S., Lilly, S., Gear, W., et al. 1999, ApJ, 515, 518, doi: 10.1086/307069
-
[39]
Erwin, P. 2015, ApJ, 799, 226, doi: 10.1088/0004-637X/799/2/226 Gaia Collaboration, Vallenari, A., Brown, A. G. A., et al. 2023, A&A, 674, A1, doi: 10.1051/0004-6361/202243940
-
[40]
2023, Astronomy & Astrophysics, 676, A26, doi: 10.1051/0004-6361/202346531
Gillman, S., Gullberg, B., Brammer, G., et al. 2023, Astronomy & Astrophysics, 676, A26, doi: 10.1051/0004-6361/202346531
-
[41]
Gillman, S., Smail, I., Gullberg, B., et al. 2024, A&A, 691, A299, doi: 10.1051/0004-6361/202451006 Gim´ enez-Arteaga, C., Fujimoto, S., Valentino, F., et al. 2024, A&A, 686, A63, doi: 10.1051/0004-6361/202349135 G´ omez-Guijarro, C., Toft, S., Karim, A., et al. 2018, ApJ, 856, 121, doi: 10.3847/1538-4357/aab206
-
[42]
Gullberg, B., Swinbank, A. M., Smail, I., et al. 2018, The Astrophysical Journal, 859, 12, doi: 10.3847/1538-4357/aabe8c
-
[43]
Gullberg, B., Smail, I., Swinbank, A. M., et al. 2019, Monthly Notices of the Royal Astronomical Society, 490, 4956, doi: 10.1093/mnras/stz2835
-
[44]
Harvey, T., Conselice, C. J., Adams, N. J., et al. 2025, Monthly Notices of the Royal Astronomical Society, 542, 2998, doi: 10.1093/mnras/staf1396
-
[45]
Hodge, J. A., Carilli, C. L., Walter, F., et al. 2012, The Astrophysical Journal, 760, 11, doi: 10.1088/0004-637X/760/1/11
-
[46]
Royal Society Open Science , keywords =
Hodge, J. A., & da Cunha, E. 2020, Royal Society Open Science, 7, 200556, doi: 10.1098/rsos.200556
-
[47]
A., Riechers, D., Decarli, R., et al
Hodge, J. A., Riechers, D., Decarli, R., et al. 2015, ApJL, 798, L18, doi: 10.1088/2041-8205/798/1/L18
-
[48]
A., Karim, A., Smail, I., et al
Hodge, J. A., Karim, A., Smail, I., et al. 2013, ApJ, 768, 91, doi: 10.1088/0004-637X/768/1/91
-
[49]
Hodge, J. A., Swinbank, A. M., Simpson, J. M., et al. 2016, The Astrophysical Journal, 833, 103, doi: 10.3847/1538-4357/833/1/103
-
[50]
A., Smail, I., Walter, F., et al
Hodge, J. A., Smail, I., Walter, F., et al. 2019, The Astrophysical Journal, 876, 130, doi: 10.3847/1538-4357/ab1846
-
[51]
A., da Cunha, E., Kendrew, S., et al
Hodge, J. A., da Cunha, E., Kendrew, S., et al. 2025, ApJ, 978, 165, doi: 10.3847/1538-4357/ad9a52
-
[52]
2009, MNRAS, 395, 1391, doi: 10.1111/j.1365-2966.2009.14471.x
Hopkins, P. F., Bundy, K., Murray, N., et al. 2009, MNRAS, 398, 898, doi: 10.1111/j.1365-2966.2009.15062.x
-
[53]
H., Serjeant, S., Dunlop, J., et al
Hughes, D. H., Serjeant, S., Dunlop, J., et al. 1998, Nature, 394, 241, doi: 10.1038/28328
-
[54]
2026, ApJ, 996, 121, doi: 10.3847/1538-4357/ae157e
Ikeda, R., Iono, D., Tadaki, K.-i., et al. 2026, ApJ, 996, 121, doi: 10.3847/1538-4357/ae157e
-
[55]
Inami, H., Algera, H. S. B., Schouws, S., et al. 2022, MNRAS, 515, 3126, doi: 10.1093/mnras/stac1779
-
[56]
2024, ApJ, 964, 192, doi: 10.3847/1538-4357/ad2512 26
Ito, K., Valentino, F., Brammer, G., et al. 2024, ApJ, 964, 192, doi: 10.3847/1538-4357/ad2512 26
-
[57]
Jarvis, M. J., Bonfield, D. G., Bruce, V. A., et al. 2013, MNRAS, 428, 1281, doi: 10.1093/mnras/sts118
-
[58]
Karim, A., Swinbank, A. M., Hodge, J. A., et al. 2013, MNRAS, 432, 2, doi: 10.1093/mnras/stt196
-
[59]
2024, arXiv e-prints, arXiv:2402.07982, doi: 10.48550/arXiv.2402.07982
Killi, M., Ginolfi, M., Popping, G., et al. 2024, arXiv e-prints, arXiv:2402.07982, doi: 10.48550/arXiv.2402.07982
-
[60]
Koekemoer, A. M., Faber, S. M., Ferguson, H. C., et al. 2011, ApJS, 197, 36, doi: 10.1088/0067-0049/197/2/36
-
[61]
Kokorev, V., Jin, S., Magdis, G. E., et al. 2023, The Astrophysical Journal Letters, 945, L25, doi: 10.3847/2041-8213/acbd9d
-
[62]
Koller, M., Ziegler, B., Ciocan, B. I., et al. 2024, arXiv e-prints, arXiv:2406.20017, doi: 10.48550/arXiv.2406.20017
-
[63]
Lang, P., Schinnerer, E., Smail, I., et al. 2019, The Astrophysical Journal, 879, 54, doi: 10.3847/1538-4357/ab1f77 Le Bail, A., Daddi, E., Elbaz, D., et al. 2024, Astronomy & Astrophysics, 688, A53, doi: 10.1051/0004-6361/202347465
-
[64]
2024, The Astrophysical Journal, 976, 70, doi: 10.3847/1538-4357/ad7fee
Li, J., Da Cunha, E., Gonz´ alez-L´ opez, J., et al. 2024, The Astrophysical Journal, 976, 70, doi: 10.3847/1538-4357/ad7fee
-
[65]
Lines, N. E. P., Bowler, R. A. A., Adams, N. J., et al. 2025, MNRAS, 539, 2685, doi: 10.1093/mnras/staf627
-
[66]
Longhetti, M., Saracco, P., Severgnini, P., et al. 2007, MNRAS, 374, 614, doi: 10.1111/j.1365-2966.2006.11171.x
-
[67]
Lotz, J. M., Primack, J., & Madau, P. 2004, AJ, 128, 163, doi: 10.1086/421849
-
[68]
Lotz, J. M., Davis, M., Faber, S. M., et al. 2008, ApJ, 672, 177, doi: 10.1086/523659
-
[69]
2021, MNRAS, 501, 2659, doi: 10.1093/mnras/staa3766
Lustig, P., Strazzullo, V., D’Eugenio, C., et al. 2021, MNRAS, 501, 2659, doi: 10.1093/mnras/staa3766
-
[70]
2024, ApJ, 972, 134, doi: 10.3847/1538-4357/ad5c6a
Martorano, M., van der Wel, A., Baes, M., et al. 2024, ApJ, 972, 134, doi: 10.3847/1538-4357/ad5c6a
-
[71]
McKinney, J., Manning, S. M., Cooper, O. R., et al. 2023, The Astrophysical Journal, 956, 72, doi: 10.3847/1538-4357/acf614
-
[72]
McKinney, J., Casey, C. M., Long, A. S., et al. 2025, ApJ, 979, 229, doi: 10.3847/1538-4357/ada357
-
[73]
Miller, N. A., Bonzini, M., Fomalont, E. B., et al. 2013, The Astrophysical Journal Supplement Series, 205, 13, doi: 10.1088/0067-0049/205/2/13
-
[74]
Mun, M., Wisnioski, E., Battisti, A. J., et al. 2024, MNRAS, 530, 5072, doi: 10.1093/mnras/stae1132
-
[75]
Naab, T., Johansson, P. H., & Ostriker, J. P. 2009, ApJL, 699, L178, doi: 10.1088/0004-637X/699/2/L178
-
[76]
Newman, A. B., Ellis, R. S., Bundy, K., & Treu, T. 2012, ApJ, 746, 162, doi: 10.1088/0004-637X/746/2/162
-
[77]
Oke, J. B., & Gunn, J. E. 1983, ApJ, 266, 713, doi: 10.1086/160817
-
[78]
Updated point spread function simulations for JWST with WebbPSF
Perrin, M. D., Sivaramakrishnan, A., Lajoie, C.-P., et al. 2014, in Society of Photo-Optical Instrumentation Engineers (SPIE) Conference Series, Vol. 9143, Space Telescopes and Instrumentation 2014: Optical, Infrared, and Millimeter Wave, ed. J. Oschmann, Jacobus M., M. Clampin, G. G. Fazio, & H. A. MacEwen, 91433X, doi: 10.1117/12.2056689
-
[79]
2021, A&A, 650, A134, doi: 10.1051/0004-6361/202140733
Pessa, I., Schinnerer, E., Belfiore, F., et al. 2021, A&A, 650, A134, doi: 10.1051/0004-6361/202140733
-
[80]
2023, MNRAS, 519, 1526, doi: 10.1093/mnras/stac3214
Popesso, P., Concas, A., Cresci, G., et al. 2023, MNRAS, 519, 1526, doi: 10.1093/mnras/stac3214
discussion (0)
Sign in with ORCID, Apple, or X to comment. Anyone can read and Pith papers without signing in.