Recognition: unknown
Spatial Extremes at Scale: A Case Study of Surface Skin Temperature and Heat Risk in the United States
Pith reviewed 2026-05-10 02:46 UTC · model grok-4.3
The pith
A random scale mixture process enables scalable Bayesian inference for spatial extremes in US surface temperatures.
A machine-rendered reading of the paper's core claim, the machinery that carries it, and where it could break.
Core claim
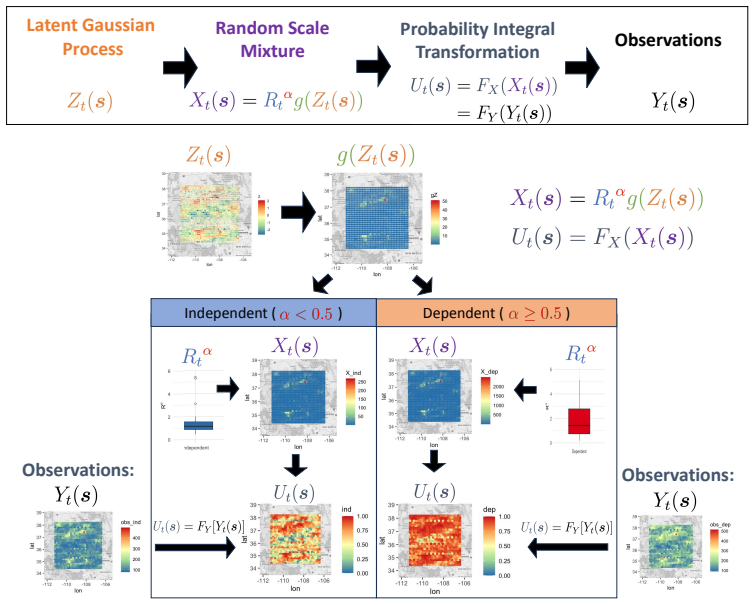
The authors claim that the random scale mixture process, together with scalable inference strategies that leverage spatial modeling and amortized learning, makes Bayesian inference feasible for spatial extremes, as shown by extensive simulation studies and an application to high-resolution surface skin temperature data in the Four Corners region of the United States.
What carries the argument
The random scale mixture process, a model that represents complex joint tail dependencies among extreme values observed at many spatial locations.
If this is right
- Bayesian modeling of spatial extremes becomes feasible for datasets containing thousands of locations.
- Spatially varying and seasonally changing heat extremes can be characterized in regions with complex terrain.
- Surface skin temperature can be used to derive location-specific heat indices that inform public health risk.
- Practitioners in climate science and environmental risk assessment gain practical guidelines for large-scale extreme value analysis.
Where Pith is reading between the lines
- The same mixture structure could be applied to other spatial extremes such as heavy rainfall or strong winds.
- Amortized components might allow the model to update quickly when new temperature observations arrive.
- Extending the method across the full United States could identify national patterns in heat risk that local studies miss.
- Direct comparison of the inferred extremes against output from physical climate models would test consistency between statistical and process-based views.
Load-bearing premise
The random scale mixture process and the amortized learning approximations together capture the actual joint tail dependencies in the temperature data without introducing bias or artifacts that change the heat risk conclusions.
What would settle it
On a smaller data subset where exact but slow Bayesian inference is still possible, the scalable method produces noticeably different estimates of extreme quantiles or risk measures than the exact version.
Figures


read the original abstract
Understanding and mapping extreme heat is critical for risk management and public health planning, particularly in regions with complex terrain and heterogeneous climate. We present a case study of extreme heat in the Four Corners region of the United States, using high-resolution surface skin temperature data from the North American Land Data Assimilation System to characterize spatially heterogeneous and seasonally varying extremes across complex terrain, and to assess their implications for heat-related public health risks. Spatial extremes exhibit complex dependencies across geographic regions, which require sophisticated statistical models to capture. While recent advances in spatial extreme value modeling provide flexible representations of joint tail dependencies, statistical inference remains computationally demanding, especially for datasets with a large number of locations. To address this, we propose a random scale mixture process that facilitates Bayesian inference of spatial extremes, and develop scalable inference strategies that leverage advances in spatial modeling and amortized learning. We evaluate the proposed inference methods through large-scale simulation studies, representing the first such extensive study in spatial extremes, and a high-resolution surface skin temperature application in the Four Corners region. Surface skin temperature is particularly useful as a predictor for air temperature, for studying heatwaves and related environmental phenomena, and to calculate heat indices reflecting downstream health risks at any location. Our findings provide insights into efficient, data-driven approaches for modeling spatial extremes, and serve as guidelines for practitioners in the fields of climate science, environmental risk assessment, and beyond.
Editorial analysis
A structured set of objections, weighed in public.
Referee Report
Summary. The manuscript proposes a random scale mixture process to enable Bayesian inference for spatial extreme value models, develops scalable inference strategies that combine advances in spatial modeling with amortized learning, evaluates the methods via large-scale simulation studies (described as the first extensive study of its kind), and applies the framework to high-resolution North American Land Data Assimilation System surface skin temperature data over the Four Corners region to characterize spatially heterogeneous extremes and assess implications for heat-related public health risks.
Significance. If the proposed process and inference strategies prove accurate and scalable, the work would address a recognized computational barrier in spatial extremes modeling, enabling Bayesian analyses at scales relevant to climate and environmental applications. The emphasis on extensive simulations and a concrete public-health case study strengthens practical utility and could provide useful guidelines for practitioners in climate science and risk assessment.
minor comments (2)
- The abstract would be strengthened by including one or two quantitative highlights from the simulation studies (e.g., runtime reductions or coverage probabilities) to substantiate the scalability claims.
- Clarify in the methods or results whether the random scale mixture process introduces any additional assumptions on tail dependence that are not directly validated against the surface skin temperature data.
Simulated Author's Rebuttal
We thank the referee for their positive assessment of our manuscript, accurate summary of the proposed random scale mixture process and amortized inference strategy, and recommendation for minor revision. We are pleased that the significance for addressing computational barriers in spatial extremes modeling, the extensive simulation studies, and the public-health application to heat risk are recognized.
Circularity Check
No significant circularity; proposal is a new modeling framework evaluated externally
full rationale
The paper introduces a random scale mixture process and amortized inference strategies motivated by computational limitations of existing spatial extremes methods. It supports these via large-scale simulation studies (described as the first of their kind) and a real-data application to Four Corners surface skin temperature, without any equations or claims reducing predictions to fitted parameters by construction. No self-citation chains, uniqueness theorems, or ansatzes are invoked as load-bearing justifications for the core results. The derivation chain remains self-contained against external benchmarks.
Axiom & Free-Parameter Ledger
Reference graph
Works this paper leans on
-
[1]
and Williams, A
Abatzoglou, John T. and Williams, A. Park , title =. Proc. Natl. Acad. Sci. U.S.A. , year =
-
[2]
Methods to calculate the heat index as an exposure metric in environmental health research , author=. Environ. Health Persp. , volume=
-
[3]
Environmetrics , volume=
Hu, Chenglei and Baltazar Bispo, Regina and Rue, H. Environmetrics , volume=. 2026 , publisher=
2026
-
[4]
Integral representations for
Askey, Richard and Fitch, James , journal=. Integral representations for
-
[5]
Baddeley, Adrian and Rubak, Ege and Turner, Rolf , year=
-
[6]
Banerjee, Sudipto and Carlin, Bradley P and Gelfand, Alan E , year=
-
[7]
Flux parameterization over land surfaces for atmospheric models , author=. J. Appl. Meteorol. Clim. , volume=
-
[8]
Berg, Christian and Mateu, Jorge and Porcu, Emilio , journal=. The. 2008 , publisher=
2008
-
[9]
Julia: A fresh approach to numerical computing , author=. SIAM. 2017 , publisher=
2017
-
[10]
The Annals of Applied Statistics , pages=
Spatial modeling of extreme snow depth , author=. The Annals of Applied Statistics , pages=. 2011 , volume=
2011
-
[11]
Spatially adaptive covariance tapering , author=. Spat. Stat. , volume=. 2016 , publisher=
2016
-
[12]
High--order composite likelihood inference for max--stable distributions and processes , author =. J. Comput. Graph. Stat. , volume =
-
[13]
Bayesian spatial modeling of extreme precipitation return levels , author=. J. Am. Stat. Assoc. , volume=. 2007 , publisher=
2007
-
[14]
and Johannesson, G
Cressie, N. and Johannesson, G. , date-added =. J. R. Stat. Soc. B. , number =
-
[15]
Basis-function models in spatial statistics , author=. Annu. Rev. Stat. Appl. , volume=. 2022 , publisher=
2022
-
[16]
Cressie, Noel and Wikle, Christopher K , year=
-
[17]
Geostatistics of dependent and asymptotically independent extremes , author=. Math. Geosci. , volume=. 2013 , publisher=
2013
-
[18]
A spectral representation for max-stable processes , author=. Ann. Probab. , pages=. 1984 , volume=
1984
-
[19]
Flexible space--time models for extreme data , author=. Spat. Stat. , volume=. 2025 , publisher=
2025
-
[20]
Climate change and changes in global precipitation patterns:
Dore, Mohammed H I , journal=. Climate change and changes in global precipitation patterns:. 2005 , publisher=
2005
-
[21]
Weather Clim
Detection and attribution of climate extremes in the observed record , author=. Weather Clim. Extrem. , volume=. 2016 , publisher=
2016
-
[22]
and Capon, Anthony and Berry, Peter and Broderick, Carolyn and de Dear, Richard and Havenith, George and Honda, Yasushi and Kovats, R
Ebi, Kristie L. and Capon, Anthony and Berry, Peter and Broderick, Carolyn and de Dear, Richard and Havenith, George and Honda, Yasushi and Kovats, R. Sari and Ma, Wei and Malik, Arunima and Morris, Nathan B. and Nybo, Lars and Seneviratne, Sonia I. and Vanos, Jennifer and Jay, Ollie , title=. The Lancet , year=
-
[23]
Evaluating station, satellite, & combined data for
Sch. Evaluating station, satellite, & combined data for. Atmos. Res. , pages=. 2025 , publisher=
2025
-
[24]
Extremes , volume=
Gradient boosting with extreme-value theory for wildfire prediction , author=. Extremes , volume=. 2023 , publisher=
2023
-
[25]
Extremes , volume=
Gradient boosting for extreme quantile regression , author=. Extremes , volume=. 2023 , publisher=
2023
-
[26]
Extremes , volume=
Extremal dependence of random scale constructions , author=. Extremes , volume=. 2019 , publisher=
2019
-
[27]
Covariance tapering for interpolation of large spatial datasets , author=. J. Comput. Graph. Stat. , volume=. 2006 , publisher=
2006
-
[28]
Journal of Multivariate Analysis , volume=
Compactly supported correlation functions , author=. Journal of Multivariate Analysis , volume=. 2002 , publisher=
2002
-
[29]
Stochastic models that separate fractal dimension and the
Gneiting, Tilmann , journal=. Stochastic models that separate fractal dimension and the. 2004 , publisher=
2004
-
[30]
Strictly Proper Scoring Rules, Prediction, and Estimation , author=. J. Am. Stat. Assoc. , volume=
-
[31]
Technometrics , volume =
Joseph Guinness , title =. Technometrics , volume =
-
[32]
and Schramm, Paul J
Hayden, Mary H. and Schramm, Paul J. and Beard, Charles B. and Bell, Jesse E. and Bernstein, Aaron S. and Bieniek-Tobasco, Ashley and Cooley, Nikki and Diuk-Wasser, Maria and Michael K. Dorsey and Ebi, Kristie L. and Ernst, Kacey C. and Gorris, Morgan E. and Howe, Peter D. and Khan, Ali S. and Lefthand-Begay, Clarita and Maldonado, Julie and Saha, Shubhay...
-
[33]
A case study competition among methods for analyzing large spatial data , author=. J. Agr. Biol. Envir. St. , volume=. 2019 , publisher=
2019
-
[34]
Space--time modelling of extreme events , author =. J. R. Stat. Soc. B. , volume =
-
[35]
Stat , volume =
Full likelihood inference for max--stable data , author =. Stat , volume =
-
[36]
Bridging asymptotic independence and dependence in spatial extremes using
Huser, Rapha. Bridging asymptotic independence and dependence in spatial extremes using. Spat. Stat. , volume=. 2017 , publisher=
2017
-
[37]
Modeling of spatial extremes in environmental data science: Time to move away from max--stable processes , author=. Environ. Data Sci. , volume=. 2025 , publisher=
2025
-
[38]
Stein and Peng Zhong , title =
Raphaël Huser and Michael L. Stein and Peng Zhong , title =. J. Comput. Graph. Stat. , volume =
-
[39]
Modeling spatial processes with unknown extremal dependence class , author=. J. Am. Stat. Assoc. , volume=. 2019 , publisher=
2019
-
[40]
WIREs Comput
Advances in statistical modeling of spatial extremes , author=. WIREs Comput. Stat. , volume=. 2022 , publisher=
2022
-
[41]
Land surface skin temperature climatology: Benefitting from the strengths of satellite observations , author=. Environ. Res. Lett. , volume=. 2010 , publisher=
2010
-
[42]
Fixed--width output analysis for
Jones, Galin L and Haran, Murali and Caffo, Brian S and Neath, Ronald , journal=. Fixed--width output analysis for. 2006 , publisher=
2006
-
[43]
Stationary max--stable fields associated to negative definite functions , author =. Ann. Probab. , volume =
-
[44]
Stat , volume=
Spatial extremal modelling: A case study on the interplay between margins and dependence , author=. Stat , volume=. 2024 , publisher=
2024
-
[45]
Vecchia approximations of
Katzfuss, Matthias and Guinness, Joseph and Gong, Wenlong and Zilber, Daniel , journal=. Vecchia approximations of. 2020 , publisher=
2020
-
[46]
Keetch, John James and Byram, George Marsden , year=
-
[47]
Space--time extremes of severe
Koh, Jonathan and Koch, Erwan and Davison, Anthony C , journal=. Space--time extremes of severe. 2024 , volume=
2024
-
[48]
Factor copula models for replicated spatial data , author=. J. Am. Stat. Assoc. , volume=. 2018 , publisher=
2018
-
[49]
Hydrolog
The implications of projected climate change for freshwater resources and their management , author=. Hydrolog. Sci. J. , volume=. 2008 , publisher=
2008
-
[50]
Biometrika , volume =
Statistics for near independence in multivariate extreme values , author =. Biometrika , volume =
-
[51]
Leeper and Tyler Harrington and Michael A
Ronald D. Leeper and Tyler Harrington and Michael A. Palecki and Kelley DePolt and Emma Scott and Jennifer Runkle and Howard J. Diamond. The Influence of Drought on Heat Wave Intensity, Duration, and Exposure. J. Appl. Meteorol. Clim. 2025. doi:10.1175/JAMC-D-24-0072.1
-
[52]
Lehmann, Erich L and Casella, George , year=
-
[53]
Neural networks for parameter estimation in intractable models , author=. Comp. Stat. Data An. , volume=. 2023 , publisher=
2023
-
[54]
and Rowhani, P
Lesk, C. and Rowhani, P. and Ramankutty, N. , title =. Nature , year =
-
[55]
Chapter 13: Transportation
Liban, Cris B and Kafalenos, Robert and Alessa, Lilian and Anenberg, Susan and Chester, Mikhail and DeFlorio, Joshua and D \'o \ n ez, Francisco J and Flannery, Aimee and Sanio, Michael R and Scott, Beverly A and Stoner, Anne Marie K. Chapter 13: Transportation
-
[56]
An explicit link between
Lindgren, Finn and Rue, H. An explicit link between. J. R. Stat. Soc. B. , year =
-
[57]
A deep learning synthetic likelihood approximation of a non--stationary spatial model for extreme streamflow forecasting , journal =. 2023 , comment =. doi:https://doi.org/10.1016/j.spasta.2023.100755 , author =
-
[58]
Modeling extremal streamflow using deep learning approximations and a flexible spatial process , volume =
Majumder, Reetam and Reich, Brian J and Shaby, Benjamin A , journal =. Modeling extremal streamflow using deep learning approximations and a flexible spatial process , volume =
-
[59]
Chapter 2: Climate Trends
Marvel, Kate and Su, Wenying and Delgado, Roberto and Aarons, Sarah and Chatterjee, Abhishek and Garcia, Margaret E and Hausfather, Zeke and Hayhoe, Katharine and Hence, Deanna A and Jewett, Elizabeth B and Robel, Alexander and Singh, Deepti and Tripati, Aradhna and Vose, Russell S. Chapter 2: Climate Trends
-
[60]
Management Science , volume=
Scoring rules for continuous probability distributions , author=. Management Science , volume=. 1976 , publisher=
1976
-
[61]
The Annals of Statistics , volume=
What is a statistical model?\ (with discussion) , author=. The Annals of Statistics , volume=. 2002 , publisher=
2002
-
[62]
Bernoulli , volume=
Polynomial covariance functions on intervals , author=. Bernoulli , volume=. 2003 , publisher=
2003
-
[63]
Weather-Related Fatality and Injury Statistics , year =
-
[64]
A low-to-no snow future and its impacts on water resources in the western
Siirila-Woodburn, Erica R and Rhoades, Alan M and Hatchett, Benjamin J and Huning, Laurie S and Szinai, Julia and Tague, Christina and Nico, Peter S and Feldman, Daniel R and Jones, Andrew D and Collins, William D and others , journal=. A low-to-no snow future and its impacts on water resources in the western. 2021 , publisher=
2021
-
[65]
Nolan, John P , publisher=
-
[66]
Terminology in thermal infrared remote sensing of natural surfaces , author=. Agr. Forest Meteorol. , volume=. 1995 , publisher=
1995
-
[67]
Statistical post--processing of forecasts for extremes using bivariate
Oesting, Marco and Schlather, Martin and Friederichs, Petra , journal=. Statistical post--processing of forecasts for extremes using bivariate. 2017 , publisher=
2017
-
[68]
Remotely sensed land skin temperature as a spatial predictor of air temperature across the conterminous
Oyler, Jared W and Dobrowski, Solomon Z and Holden, Zachary A and Running, Steven W , journal=. Remotely sensed land skin temperature as a spatial predictor of air temperature across the conterminous
-
[69]
Likelihood--based inference for max-stable processes , author=. J. Am. Stat. Assoc. , volume=. 2010 , publisher=
2010
-
[70]
and Lewis, Sophie C
Perkins-Kirkpatrick, Sarah E. and Lewis, Sophie C. , title =. Nature Communications , year =
-
[71]
Asymptotic properties of the maximum in a stationary
Pickands, James , journal=. Asymptotic properties of the maximum in a stationary
-
[72]
Environmetrics , volume=
Fast parameter estimation of generalized extreme value distribution using neural networks , author=. Environmetrics , volume=. 2024 , publisher=
2024
-
[73]
The Annals of Applied Statistics , volume=
A hierarchical max--stable spatial model for extreme precipitation , author=. The Annals of Applied Statistics , volume=. 2012 , publisher=
2012
-
[74]
, year =
Resnick, Sidney I. , year =
-
[75]
Journal de la Soci
Spatial extremes: Max-stable processes at work , author=. Journal de la Soci
-
[76]
Statistica Sinica , volume=
Bayesian inference from composite likelihoods, with an application to spatial extremes , author=. Statistica Sinica , volume=. 2012 , publisher=
2012
-
[77]
evgam: An
Youngman, Benjamin D , journal=. evgam: An
-
[78]
and Huser, R
Richards, J. and Huser, R. , editor =. Extreme Quantile Regression with Deep Learning , booktitle =
-
[79]
Flexible modeling of nonstationary extremal dependence using spatially fused
Shao, Xuanjie and Hazra, Arnab and Richards, Jordan and Huser, Rapha. Flexible modeling of nonstationary extremal dependence using spatially fused. Technometrics , volume=. 2025 , publisher=
2025
-
[80]
Biometrika , pages=
Dependence modelling for spatial extremes , author=. Biometrika , pages=. 2012 , publisher=
2012
discussion (0)
Sign in with ORCID, Apple, or X to comment. Anyone can read and Pith papers without signing in.