Recognition: unknown
Global remote sensing reveals vegetation clustering as a physical footprint of shifting aridity trends in drylands
Pith reviewed 2026-05-08 12:50 UTC · model grok-4.3
The pith
Vegetation patches in drylands record whether aridity has been rising or falling.
A machine-rendered reading of the paper's core claim, the machinery that carries it, and where it could break.
Core claim
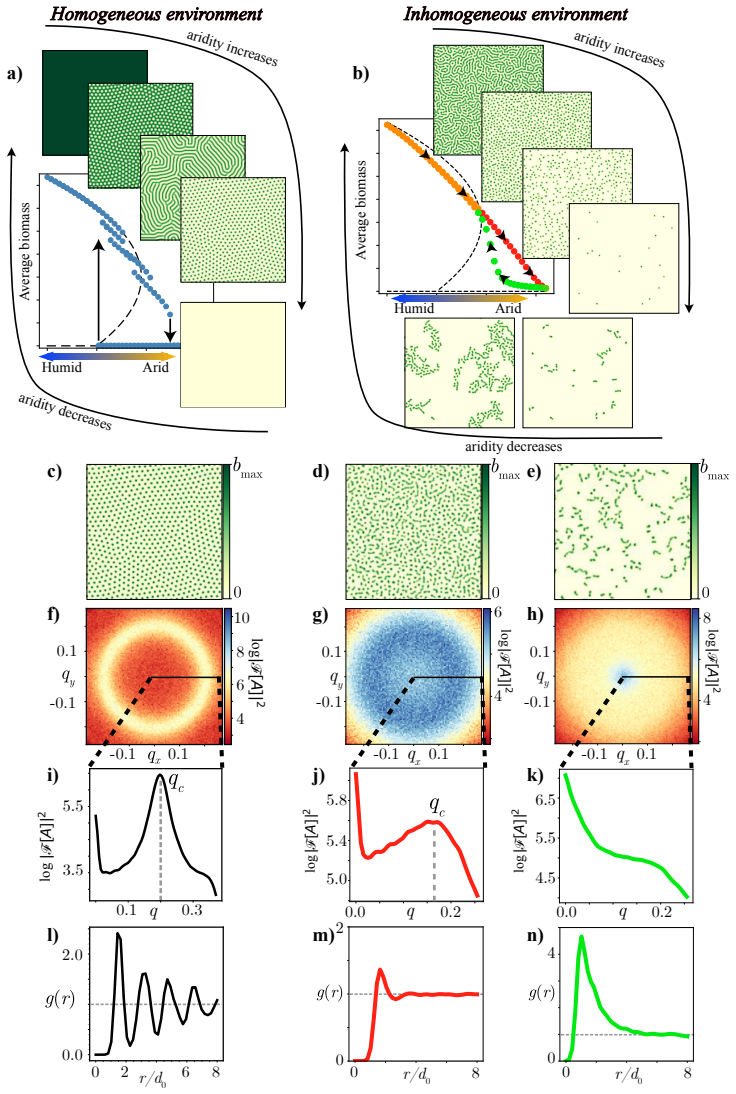
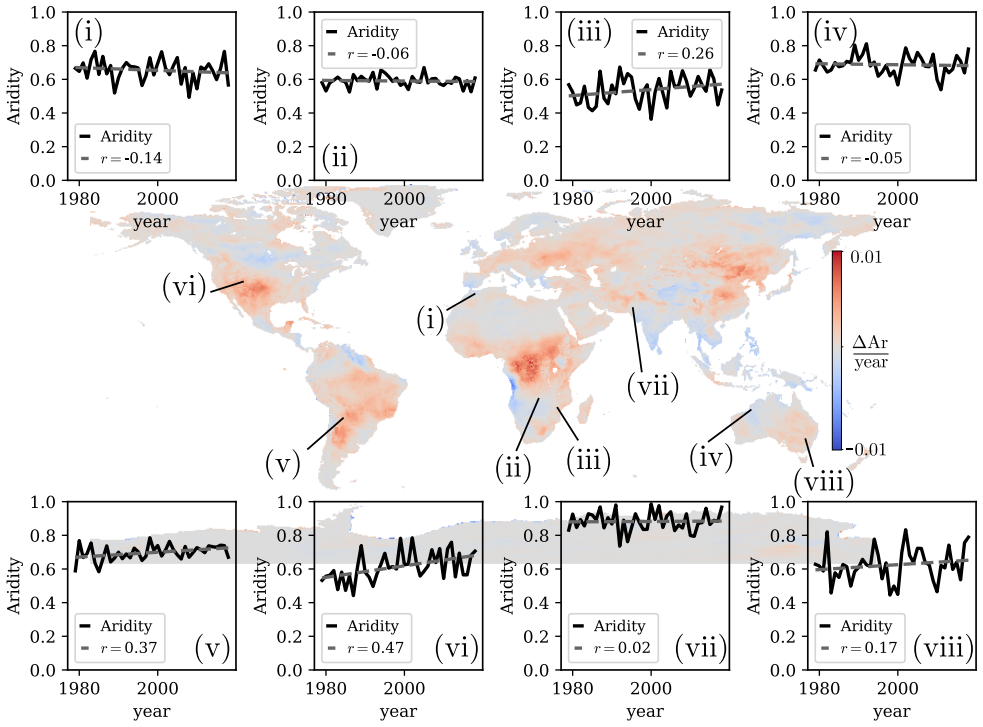
The spatial morphology of vegetation patches acts as a direct physical footprint of the ecosystem's historical aridity trend. Ecosystems experiencing increasing aridity display periodic arrays with a defined wavelength, whereas those recovering under decreasing aridity exhibit scale-free clustering. This empirical result, obtained from remote sensing across eight distinct global ecosystems paired with historical bio-climatic data, validates theoretical predictions that spatially heterogeneous environments produce either periodic or disordered patterns depending on the direction of environmental change.
What carries the argument
The spatial morphology of vegetation patches (periodic arrays versus scale-free clusters) as a direct indicator of the direction of historical aridity change.
If this is right
- Remote sensing supplies a non-destructive, global-scale indicator that distinguishes degradation from recovery pathways in drylands.
- Theoretical models of pattern formation in changing environments receive direct empirical support at the ecosystem level.
- Monitoring programs can track dryland trajectories by classifying patch morphology without requiring long-term on-ground aridity measurements.
- The same approach could be applied to other self-organized ecological systems where environmental trends leave spatial imprints.
Where Pith is reading between the lines
- If the pattern-aridity link holds, repeated satellite surveys could provide early warnings of desertification risk years before vegetation cover drops sharply.
- The method might extend to other pattern-forming systems such as permafrost or coral reefs where directional environmental change is expected to produce analogous morphological signatures.
- Field validation campaigns could test the indicator by comparing pattern classifications against independent, high-resolution records of grazing pressure and soil properties at selected sites.
Load-bearing premise
The direction of aridity change taken from bio-climatic databases accurately captures the conditions that shaped the observed vegetation patterns, and factors such as grazing, soil type, or topography do not override those signatures.
What would settle it
Locating a dryland site whose bio-climatic record shows steadily increasing aridity yet whose vegetation from satellite imagery forms scale-free clusters instead of periodic arrays (or the opposite mismatch) would disprove the claimed correspondence.
Figures

read the original abstract
Due to climatic changes, excessive grazing, and deforestation, semi-arid and arid ecosystems are vulnerable to desertification and land degradation. As aridity increases, vegetation cover often self-organizes into spatial patterns before collapsing to bare soil. While recent theoretical work has established that spatially heterogeneous yet isotropic environments induce a smooth hysteresis loop -- yielding either periodic (hexagonal) patterns during degradation or disordered (clustered) patterns during recovery -- empirical validation of this physical footprint at a global scale has been lacking. Here, we present an extensive empirical validation using remote sensing across eight distinct global ecosystems, coupled with historical bio-climatic databases. We demonstrate that the spatial morphology of vegetation patches acts as a direct physical footprint of the ecosystem's historical aridity trend. Our results show that ecosystems experiencing increasing aridity display periodic arrays with a defined wavelength, whereas those recovering under decreasing aridity exhibit scale-free clustering. This framework provides a non-destructive, robust satellite-based indicator for diagnosing whether a dryland ecosystem is on a degradation or recovery pathway.
Editorial analysis
A structured set of objections, weighed in public.
Referee Report
Summary. The manuscript claims that remote sensing data across eight global dryland ecosystems demonstrates vegetation spatial morphology as a direct physical footprint of historical aridity trends extracted from bio-climatic databases: periodic arrays with defined wavelength under increasing aridity versus scale-free clustering under decreasing aridity. This is positioned as empirical validation of theoretical predictions on pattern formation during degradation versus recovery, offering a satellite-based diagnostic for ecosystem pathways.
Significance. If the central mapping between pattern type and aridity trend sign holds after appropriate controls, the work would supply a practical, non-destructive global monitoring tool for dryland degradation and recovery. The multi-ecosystem scope strengthens potential applicability to land management and desertification assessment.
major comments (2)
- [Results] Results (comparison of morphology to aridity trends): The central claim equates observed pattern type directly to the sign of historical aridity change, but the manuscript provides no sensitivity tests that swap trend labels from the bio-climatic databases and recompute the morphology statistics. Given known interpolation challenges in arid regions, this leaves the reported separation vulnerable.
- [Methods] Methods (data sources and controls): No explicit controls or robustness checks are described for potential confounders such as grazing intensity, soil type, or topography that could mimic or override the predicted periodic versus scale-free signatures.
minor comments (2)
- [Abstract] Abstract: The claim of 'extensive remote-sensing validation across eight ecosystems' would be strengthened by specifying the number of sites or patches analyzed per ecosystem and the imagery resolution used.
- [Figures and Methods] Figure captions and methods: Clarify the exact metrics employed to distinguish 'periodic arrays with a defined wavelength' from 'scale-free clustering' (e.g., Fourier analysis or pair-correlation functions).
Simulated Author's Rebuttal
We thank the referee for their constructive review and for recognizing the potential significance of our work as a satellite-based diagnostic for dryland pathways. We address each major comment below and have revised the manuscript to incorporate the suggested robustness checks.
read point-by-point responses
-
Referee: [Results] Results (comparison of morphology to aridity trends): The central claim equates observed pattern type directly to the sign of historical aridity change, but the manuscript provides no sensitivity tests that swap trend labels from the bio-climatic databases and recompute the morphology statistics. Given known interpolation challenges in arid regions, this leaves the reported separation vulnerable.
Authors: We agree that explicit sensitivity tests are needed to address potential label uncertainty. In the revised manuscript we have added a dedicated sensitivity analysis in which aridity trend labels are randomly permuted across the eight ecosystems while preserving the overall distribution; the morphology statistics are then recomputed and the separation between periodic and scale-free classes is re-evaluated. The original association remains statistically significant under permutation, indicating that the reported mapping is not driven by label assignment alone. We also expand the Methods to discuss interpolation uncertainties in arid-zone bio-climatic products and describe our use of multiple independent databases plus cross-validation against ground stations to reduce bias. revision: yes
-
Referee: [Methods] Methods (data sources and controls): No explicit controls or robustness checks are described for potential confounders such as grazing intensity, soil type, or topography that could mimic or override the predicted periodic versus scale-free signatures.
Authors: We acknowledge the need for explicit controls. The revised Methods section now incorporates global grazing-intensity layers, soil-type classifications, and topographic metrics derived from digital elevation models. We apply partial-correlation and multivariate regression analyses showing that the link between aridity-trend sign and vegetation morphology persists after these covariates are accounted for. We further add a theoretical discussion, grounded in the underlying pattern-formation models, explaining why these confounders are unlikely to generate the specific periodic-versus-scale-free dichotomy observed across the eight ecosystems. revision: yes
Circularity Check
No significant circularity: empirical comparison uses independent external databases
full rationale
The paper's core claim rests on direct observational mapping of vegetation pattern morphology (periodic vs. scale-free) from remote-sensing imagery against aridity trend direction extracted from separate bio-climatic databases. No equations, fitted parameters, or self-referential definitions are invoked to generate the reported separation; the result is a statistical association between two independently sourced datasets. Theoretical background is cited but does not substitute for the empirical test. This structure is self-contained against external benchmarks and does not reduce any prediction to its inputs by construction.
Axiom & Free-Parameter Ledger
axioms (1)
- domain assumption Spatially heterogeneous yet isotropic environments induce a smooth hysteresis loop yielding periodic (hexagonal) patterns during degradation or disordered (clustered) patterns during recovery
Reference graph
Works this paper leans on
-
[1]
Adler, P., Raff, D., & Lauenroth, W. (2001). The effect of grazing on the spatial heterogeneity of vegetation. Oecologia,128(4), 465–479. Basson, U., Argaman, E., Yizhaq, H., Xu, C., Xu, Z., & Stavi, I. (2023). Subsurface geodiversity de- termines shrub resilience vs. mortality under long- term droughts in the israeli negev drylands.Fron- tiers in Environ...
2001
-
[2]
Klausmeier, C. A. (1999). Regular and irregular patterns in semiarid vegetation.Science,284(5421), 1826–
1999
-
[3]
Lefever, R., & Lejeune, O. (1997). On the origin of tiger bush.Bulletin of Mathematical Biology,59(2), 263–294. Lejeune, O., & Tlidi, M. (1999). A model for the expla- nation of vegetation stripes (tiger bush).Journal of Vegetation science,10(2), 201–208. Lejeune, O., Tlidi, M., & Couteron, P. (2002). Localized vegetation patches: a self-organized respons...
1997
-
[4]
G., Escaff, D., Couteron, P., Mes- saoudi, M., Khaffou, M., & Makhoute, A
Tlidi, M., Clerc, M. G., Escaff, D., Couteron, P., Mes- saoudi, M., Khaffou, M., & Makhoute, A. (2018). Observation and modelling of vegetation spirals and arcs in isotropic environmental conditions: dis- sipative structures in arid landscapes.Philosophical Transactions of the Royal Society A: Mathemati- cal, Physical and Engineering Sciences,376(2135), 2...
2018
-
[5]
von Hardenberg, J., Meron, E., Shachak, M., & Zarmi, Y. (2001). Diversity of vegetation patterns and desertification.Physical Review Letters,87(19), 198101. Wang, Y., Xue, K., Hu, R., Ding, B., Zeng, H., Li, R., . . . others (2023). Vegetation structural shift tells environmental changes on the tibetan plateau over 40 years.Science Bulletin,68(17), 1928–1...
discussion (0)
Sign in with ORCID, Apple, or X to comment. Anyone can read and Pith papers without signing in.