Recognition: no theorem link
On cross-validation for small area estimators
Pith reviewed 2026-05-12 02:16 UTC · model grok-4.3
The pith
A decomposition of cross-validated squared error separates identifiable bias from bounded unidentifiable parts, enabling reliable comparisons of small area estimators under complex survey designs.
A machine-rendered reading of the paper's core claim, the machinery that carries it, and where it could break.
Core claim
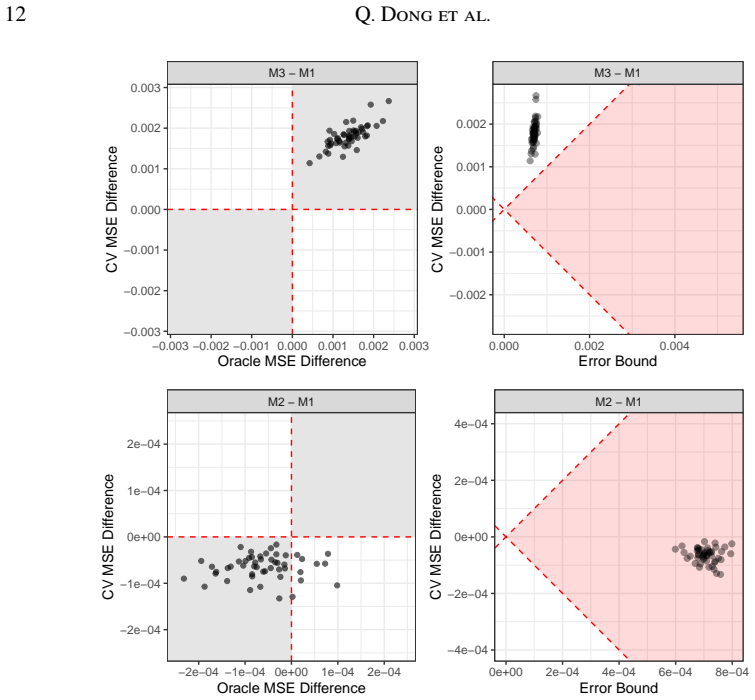
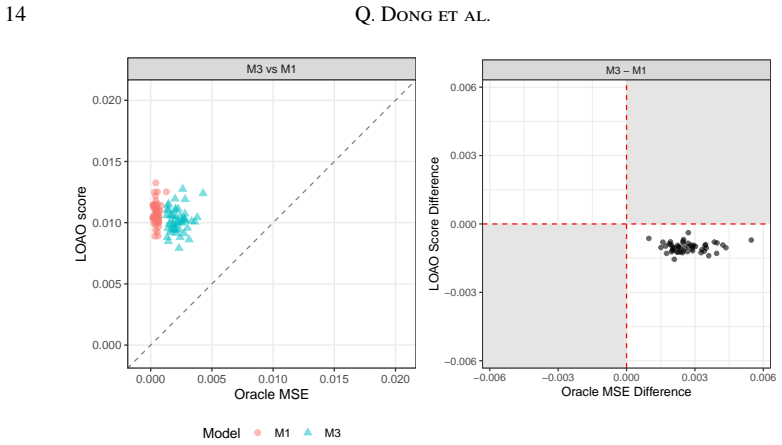
By decomposing the cross-validated squared error into identifiable bias and unidentifiable components that can be bounded, the framework enables more robust and interpretable model comparisons for small area estimators that account for complex survey designs, outperforming conventional cross-validation in simulations and allowing uncertainty measures.
What carries the argument
The decomposition of the cross-validated squared error into identifiable bias and bounded unidentifiable components, which carries the argument by revealing what can be directly estimated versus bounded under the survey design.
If this is right
- Conventional leave-one-area-out cross-validation can produce misleading rankings of small area estimators.
- The framework permits direct comparisons between area-level and unit-level small area estimation models.
- Uncertainty quantification accompanies the model selection process for small area estimators.
- More trustworthy model choices improve subnational estimates such as female literacy rates from survey data.
Where Pith is reading between the lines
- Adoption could lower errors in policy decisions that rely on subnational health or literacy indicators.
- The bounding approach may apply to validation tasks in other domains where ground truth is unavailable.
- Testing under different sample sizes or survey complexities would clarify the method's robustness limits.
- The work points toward greater emphasis on design-aware validation throughout survey-based statistics.
Load-bearing premise
That the proposed decomposition can effectively bound the unidentifiable components in a way that supports reliable model comparisons under complex survey designs.
What would settle it
A simulation where the true best model is known in advance, checking whether the proposed cross-validation selects it more often than leave-one-area-out cross-validation, or external validation data on literacy rates that contradicts one set of rankings but not the other.
Figures


read the original abstract
Subnational monitoring of public health often relies on household surveys where data are sparse at the desired spatial resolution. Small area estimation (SAE) methods address this challenge by borrowing strength across areas and incorporating auxiliary information. However, comparing these estimators remains difficult in the absence of ground truth. We propose a cross-validation framework for evaluating small area estimators that accommodates complex survey designs. Our approach enables model-agnostic comparisons between area-level and unit-level SAE models. Central to our framework is a decomposition of the cross-validated squared error, which reveals both identifiable bias and unidentifiable components that can be bounded. Our theoretical results and simulation studies show that conventional approaches, such as leave-one-area-out cross-validation, can yield misleading model rankings, whereas the proposed approach offers more robust and interpretable model comparison with uncertainty quantification. We demonstrate the framework through a case study comparing SAE models estimating the subnational female literacy rate using Demographic and Health Surveys from Zambia.
Editorial analysis
A structured set of objections, weighed in public.
Referee Report
Summary. The manuscript proposes a cross-validation framework for small area estimation (SAE) under complex survey designs. It decomposes the cross-validated squared error into an identifiable bias term and unidentifiable components (from sampling design, area-level effects, and residuals) that are bounded to yield uncertainty intervals for comparing area-level versus unit-level SAE models. Theoretical results and simulations are used to argue that leave-one-area-out CV produces misleading rankings, while the proposed approach is more robust and interpretable. The framework is demonstrated on a case study estimating subnational female literacy rates from Zambian DHS data.
Significance. If the bounds on unidentifiable components prove sufficiently tight, the work would meaningfully advance model selection for SAE in sparse survey settings, a frequent challenge in public health applications. Credit is due for the model-agnostic decomposition, explicit uncertainty quantification, accommodation of complex designs, and the combination of theory, simulations, and real-data illustration. These elements address a genuine gap, though the practical utility hinges on the tightness of the derived bounds relative to model differences.
major comments (2)
- [Theoretical decomposition] Theoretical decomposition section: The claim that the decomposition enables reliable model comparisons rests on the bounds for unidentifiable components (sampling weights, cluster effects, residuals) being tight enough to produce non-overlapping intervals. In multi-stage designs such as DHS, these components are entangled with inclusion probabilities; if the bounds remain wide (as is common with small effective sample sizes per area), the intervals will overlap and the method will not overturn misleading LOAO rankings. A concrete demonstration that the bounds are decisive under the paper's assumptions is needed.
- [Simulation studies] Simulation studies: The simulations must report the proportion of cases in which the proposed intervals produce decisive (non-overlapping) rankings when conventional CV fails, and the coverage properties of the bounds under varying effective sample sizes and design effects. Without these diagnostics, the evidence that the approach is 'more robust' is incomplete.
minor comments (2)
- [Methods] The notation for the cross-validated squared error decomposition and the bounding procedure should be presented with explicit definitions of all terms (e.g., how the unidentifiable variance is bounded) to improve readability.
- [Case study] In the case study, provide more detail on the specific complex survey features (stratification, clustering, weights) and how they enter the bounds.
Simulated Author's Rebuttal
We thank the referee for their constructive comments and for recognizing the contributions of our cross-validation framework for small area estimation. We will revise the manuscript to provide the requested concrete demonstrations and additional simulation diagnostics, which will strengthen the evidence for the practical utility of the proposed bounds and comparisons.
read point-by-point responses
-
Referee: Theoretical decomposition section: The claim that the decomposition enables reliable model comparisons rests on the bounds for unidentifiable components (sampling weights, cluster effects, residuals) being tight enough to produce non-overlapping intervals. In multi-stage designs such as DHS, these components are entangled with inclusion probabilities; if the bounds remain wide (as is common with small effective sample sizes per area), the intervals will overlap and the method will not overturn misleading LOAO rankings. A concrete demonstration that the bounds are decisive under the paper's assumptions is needed.
Authors: We agree that the usefulness of the framework for overturning LOAO rankings depends on the bounds being sufficiently tight in relevant settings. Our theoretical decomposition derives explicit, design-based bounds on the unidentifiable components that remain valid under the multi-stage sampling assumptions used in the paper, including entanglement with inclusion probabilities. The existing simulations already include designs that approximate DHS-style multi-stage sampling and show instances of non-overlapping intervals that produce correct rankings where LOAO does not. In the revision we will add a dedicated table and accompanying text that directly quantifies bound widths relative to observed CV-error differences across the simulated scenarios, thereby providing the concrete demonstration requested under the paper's assumptions. revision: yes
-
Referee: Simulation studies: The simulations must report the proportion of cases in which the proposed intervals produce decisive (non-overlapping) rankings when conventional CV fails, and the coverage properties of the bounds under varying effective sample sizes and design effects. Without these diagnostics, the evidence that the approach is 'more robust' is incomplete.
Authors: We acknowledge that explicit summary statistics on decisiveness and coverage would make the simulation evidence more complete and easier to interpret. The current simulations already vary effective sample sizes and design effects while illustrating the superiority of the proposed intervals over LOAO, but we will expand the results section to include (i) the proportion of replicates in which the uncertainty intervals yield non-overlapping rankings when LOAO rankings are misleading, and (ii) empirical coverage rates of the derived bounds across the range of effective sample sizes and design effects examined. These additions will be presented in new tables or figures in the revised manuscript. revision: yes
Circularity Check
No circularity: new decomposition of CV squared error is derived independently and validated externally
full rationale
The paper's central contribution is a novel decomposition of cross-validated squared error into an identifiable bias term plus bounded unidentifiable components arising from survey design, area effects, and residuals. This decomposition is presented as a first-principles theoretical result for complex sampling, supported by simulation studies and a real-data case study on Zambian DHS literacy rates. No equation reduces by construction to a fitted parameter renamed as a prediction, no load-bearing premise rests on self-citation, and no uniqueness theorem or ansatz is smuggled in from prior author work. Conventional leave-one-area-out CV is critiqued on external grounds rather than tautologically. The framework therefore remains self-contained against external benchmarks.
Axiom & Free-Parameter Ledger
axioms (1)
- domain assumption The cross-validated squared error decomposes into identifiable bias and unidentifiable components that can be bounded.
Reference graph
Works this paper leans on
-
[1]
, " * write output.state after.block = add.period write newline
ENTRY address author booktitle chapter edition editor howpublished institution journal key month note number organization pages publisher school series title type volume year label extra.label sort.label short.list INTEGERS output.state before.all mid.sentence after.sentence after.block FUNCTION init.state.consts #0 'before.all := #1 'mid.sentence := #2 '...
-
[2]
" write newline "" before.all 'output.state := FUNCTION n.dashify 't := "" t empty not t #1 #1 substring "-" = t #1 #2 substring "--" = not "--" * t #2 global.max substring 't := t #1 #1 substring "-" = "-" * t #2 global.max substring 't := while if t #1 #1 substring * t #2 global.max substring 't := if while FUNCTION word.in bbl.in capitalize " " * FUNCT...
-
[3]
Alfons, A. , Kraft, S. , Templ, M. & Filzmoser, P. (2010). Simulation of synthetic population data for household surveys with application to EU-SILC . Research Report CS-2010-1, Department of Statistics and Probability Theory, Vienna University of Technology
work page 2010
- [4]
-
[5]
Bradley, J. R. , Holan, S. H. & Wikle, C. K. (2015). Multivariate spatio-temporal models for high-dimensional areal data with application to longitudinal employer-household dynamics. The Annals of Applied Statistics 9, 1761--1791
work page 2015
-
[6]
Brown, G. , Chambers, R. , Heady, P. & Heasman, D. (2001). Evaluation of small area estimation methods—an application to unemployment estimates from the uk lfs. In Proceedings of statistics Canada symposium, vol. 2001. Statistics Canada
work page 2001
- [7]
-
[8]
Corsi, D. J. , Neuman, M. , Graham, W. B. & Subramanian, S. (2012). The Demographic and Health Surveys program: an overview. International Journal of Epidemiology 41, 1602--1613
work page 2012
-
[9]
Datta, G. S. & Lahiri, P. (2000). A unified measure of uncertainty of estimated best linear unbiased predictors in small area estimation problems. Statistica Sinica , 613--627
work page 2000
-
[10]
Dharamshi, A. , Neufeld, A. , Motwani, K. , Gao, L. L. , Witten, D. & Bien, J. (2025). Generalized data thinning using sufficient statistics. Journal of the American Statistical Association 120, 511--523
work page 2025
-
[11]
Dong, Q. , Li, Z. R. , Wu, Y. , Boskovic, A. & Wakefield, J. (2024). surveyPrev : Mapping the Prevalence of Binary Indicators using Survey Data in Small Areas . R package version 1.0.0
work page 2024
-
[12]
Dong, Q. , Wu, Y. , Li, Z. R. & Wakefield, J. (2026). Toward a principled workflow for prevalence mapping using household survey data. Journal of Survey Statistics and Methodology , smaf048
work page 2026
-
[13]
Dong, T. & Wakefield, J. (2021). Modeling and presentation of health and demographic indicators in a low- and middle-income countries context. Vaccine 39, 2584--2594
work page 2021
-
[14]
Dorfman, A. H. (2018). Towards a routine external evaluation protocol for small area estimation. International Statistical Review 86, 259--274
work page 2018
-
[15]
Efron, B. (2004). The estimation of prediction error: covariance penalties and cross-validation. Journal of the American Statistical Association 99, 619--632
work page 2004
-
[16]
Fabrizi, E. & Lahiri, P. (2013). A design-based approximation to the bayes information criterion in finite population sampling. Statistica 73, 289--301
work page 2013
-
[17]
Fay, R. & Herriot, R. (1979). Estimates of income for small places: an application of James--Stein procedure to census data. Journal of the American Statistical Association 74, 269--277
work page 1979
-
[18]
Franco, C. & Maitra, P. (2023). Combining surveys in small area estimation using area-level models. Wiley Interdisciplinary Reviews: Computational Statistics 15, e1613
work page 2023
- [19]
-
[20]
H \'a jek, J. (1971). Discussion of, `` A n essay on the logical foundations of survey sampling, part I '', by D . B asu. In Foundations of Statistical Inference, V. Godambe & D. Sprott, eds. Toronto: Holt, Rinehart and Winston
work page 1971
-
[21]
Holbrook, A. , Lumley, T. & Gillen, D. (2020). Estimating prediction error for complex samples. Canadian Journal of Statistics 48, 204--221
work page 2020
-
[22]
Iparragirre, A. , Lumley, T. , Barrio, I. & Arostegui, I. (2023). Variable selection with lasso regression for complex survey data. Stat 12, e578
work page 2023
- [23]
-
[24]
On Data Thinning for Model Validation in Small Area Estimation
Kawano, S. , Parker, P. A. & Li, Z. R. (2026). On data thinning for model validation in small area estimation. arXiv preprint arXiv:2604.04141
work page internal anchor Pith review Pith/arXiv arXiv 2026
-
[25]
Khan, S. & Hancioglu, A. (2019). Multiple indicator cluster surveys: Delivering robust data on children and women across the globe. Studies in Family Planning 50, 279--286
work page 2019
-
[26]
Kuh, S. , Kennedy, L. , Chen, Q. & Gelman, A. (2024). Using leave-one-out cross validation (loo) in a multilevel regression and poststratification (mrp) workflow: A cautionary tale. Statistics in Medicine 43, 953--982
work page 2024
-
[27]
Lahiri, P. & Pramanik, S. (2019). Evaluation of synthetic small-area estimators using design-based methods. Austrian Journal of Statistics 48, 43--57
work page 2019
-
[28]
Li, Z. R. , Hsiao, Y. , Godwin, J. , Martin, B. D. , Wakefield, J. & Clark, S. J. (2019). Changes in the spatial distribution of the under five mortality rate: small-area analysis of 122 DHS surveys in 262 subregions of 35 countries in A frica. PLoS One 14, e0210645
work page 2019
- [29]
-
[30]
Lohr, S. L. & Rao, J. (2009). Jackknife estimation of mean squared error of small area predictors in nonlinear mixed models. Biometrika 96, 457--468
work page 2009
-
[31]
Lumley, T. & Scott, A. (2014). Tests for regression models fitted to survey data. Australian & New Zealand Journal of Statistics 56, 1--14
work page 2014
-
[32]
Lumley, T. & Scott, A. (2015). Aic and bic for modeling with complex survey data. Journal of Survey Statistics and Methodology 3, 1--18
work page 2015
-
[33]
Lumley, T. & Scott, A. (2017). Fitting regression models to survey data. Statistical Science , 265--278
work page 2017
-
[34]
Mercer, L. , Wakefield, J. , Pantazis, A. , Lutambi, A. , Mosanja, H. & Clark, S. (2015). Small area estimation of childhood mortality in the absence of vital registration. Annals of Applied Statistics 9, 1889--1905
work page 2015
-
[35]
Merfeld, J. D. , Chen, H. , Lahiri, P. & Newhouse, D. (2024). Small area estimation with geospatial data: A primer. Background Document ESA/STAT/AC.394/BG-3p, United Nations Statistical Commission. Prepared for the 56th Session of the United Nations Statistical Commission (March 2025) by the Inter-Secretariat Working Group on Household Surveys
work page 2024
-
[36]
Merfeld, J. D. , Newhouse, D. L. , Weber, M. & Lahiri, P. (2022). Combining survey and geospatial data can significantly improve gender-disaggregated estimates of labor market outcomes
work page 2022
-
[37]
Neufeld, A. , Dharamshi, A. , Gao, L. L. & Witten, D. (2024). Data thinning for convolution-closed distributions. Journal of Machine Learning Research 25, 1--35
work page 2024
- [38]
-
[39]
Rao, J. & Molina, I. (2015). Small Area Estimation, Second Edition. New York: John Wiley
work page 2015
-
[40]
Rao, J. N. & Scott, A. J. (1981). The analysis of categorical data from complex sample surveys: chi-squared tests for goodness of fit and independence in two-way tables. Journal of the American statistical association 76, 221--230
work page 1981
-
[41]
Rao, J. N. & Scott, A. J. (1984). On chi-squared tests for multiway contingency tables with cell proportions estimated from survey data. The Annals of statistics , 46--60
work page 1984
-
[42]
Riebler, A. , S rbye, S. , Simpson, D. & Rue, H. (2016). An intuitive B ayesian spatial model for disease mapping that accounts for scaling. Statistical Methods in Medical Research 25, 1145--1165
work page 2016
-
[43]
Rivest, L.-P. & Belmonte, E. (2000). A conditional mean squared error of small area estimators. Survey Methodology 26, 67--78
work page 2000
-
[44]
Rue, H. , Martino, S. & Chopin, N. (2009). Approximate B ayesian inference for latent G aussian models using integrated nested L aplace approximations (with discussion). Journal of the Royal Statistical Society, Series B 71, 319--392
work page 2009
-
[45]
Saha, U. R. , Das, S. , Baffour, B. & Chandra, H. (2023). Small area estimation of age-specific and total fertility rates in B angladesh. Spatial Demography 11, 2
work page 2023
- [46]
-
[47]
Steorts, R. C. , Schmid, T. & Tzavidis, N. (2020). Smoothing and benchmarking for small area estimation. International Statistical Review 88, 580--598
work page 2020
-
[48]
The Demographic and Health Surveys program
The DHS Program (2026). The Demographic and Health Surveys program. http://www.dhsprogram.com. Accessed: 2026-04-08
work page 2026
-
[49]
Thomas, D. R. & Rao, J. (1987). Small-sample comparisons of level and power for simple goodness-of-fit statistics under cluster sampling. Journal of the American Statistical Association 82, 630--636
work page 1987
-
[50]
Trevisani, M. , Torelli, N. et al. (2017). A comparison of hierarchical bayesian models for small area estimation of counts. Open Journal of Statistics 7, 521--550
work page 2017
-
[51]
Multiple indicator cluster surveys
UNICEF (2026). Multiple indicator cluster surveys. http://mics.unicef.org. Accessed: 2026-04-08
work page 2026
-
[52]
Vehtari, A. , Mononen, T. , Tolvanen, V. , Sivula, T. & Winther, O. (2016). Bayesian leave-one-out cross-validation approximations for gaussian latent variable models. Journal of Machine Learning Research 17, 1--38
work page 2016
-
[53]
Wakefield, J. , Fuglstad, G.-A. , Riebler, A. , Godwin, J. , Wilson, K. & Clark, S. (2019). Estimating under five mortality in space and time in a developing world context. Statistical Methods in Medical Research 28, 2614--2634
work page 2019
- [54]
-
[55]
Wakefield, J. , Jiang, J. & Wu, Y. (2026). Automatic variance adjustment for small area estimation. arXiv preprint arXiv:2602.14387
-
[56]
Wakefield, J. , Okonek, T. & Pedersen, J. (2020). Small area estimation for disease prevalence mapping. International Statistical Review 88, 398--418
work page 2020
-
[57]
Wieczorek, J. , Guerin, C. & McMahon, T. (2022). K-fold cross-validation for complex sample surveys. Stat 11, e454
work page 2022
-
[58]
Wieczorek, O. & Franco, C. (2013). Small area estimation evaluation strategies: An application to the American Community Survey . In Proceedings of the Joint Statistical Meetings, Section on Survey Research Methods. American Statistical Association Alexandria, VA
work page 2013
-
[59]
WorldPop (2018). Global high resolution population denominators project - funded by the bill and melinda gates foundation (opp1134076)
work page 2018
-
[60]
Wu, Y. , Li, Z. R. , Mayala, B. , Wang, H. , Gao, P. , Paige, J. , Fuglstad, G.-A. , Moe, C. , Godwin, J. , Donohue, R. , Janocha, B. , Croft, T. & Wakefield, J. (2021). Spatial Modeling for Subnational Administrative level 2 Small-Area Estimation. DHS Spatial Analysis Reports No. 21. Rockville, Maryland, USA. [ Zambia Statistics Agency et al.(2024) Zambi...
work page 2021
discussion (0)
Sign in with ORCID, Apple, or X to comment. Anyone can read and Pith papers without signing in.