Recognition: 2 theorem links
· Lean TheoremProbing the Hot Gaseous Halos of Milky Way-like Galaxies in the TNG50 simulation
Pith reviewed 2026-05-14 22:11 UTC · model grok-4.3
The pith
TNG50 simulations produce hot gaseous halos around Milky Way-mass galaxies that are too compact and lack sufficient gas at temperatures of 1.6 to 3.2 million Kelvin.
A machine-rendered reading of the paper's core claim, the machinery that carries it, and where it could break.
Core claim
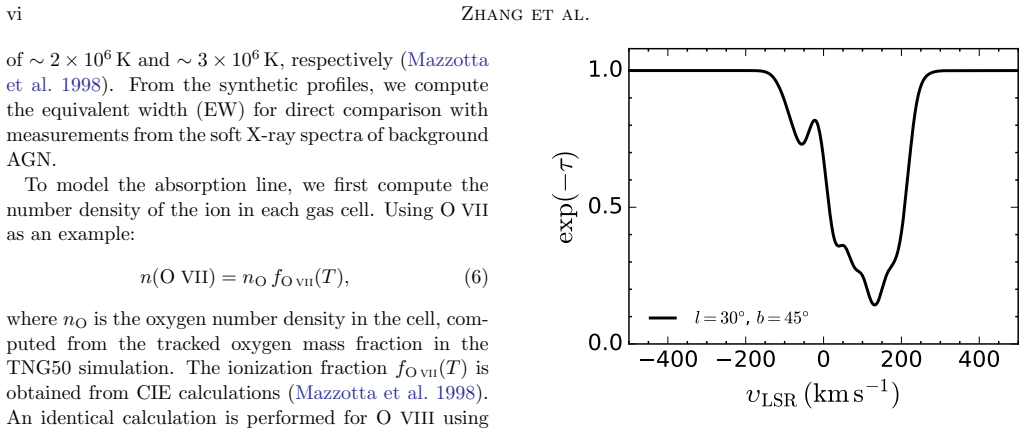
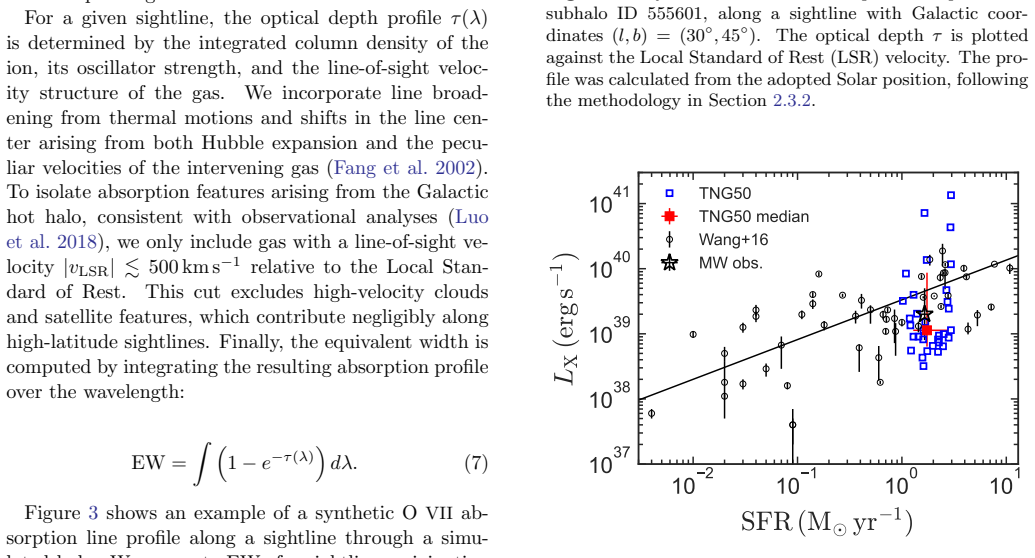
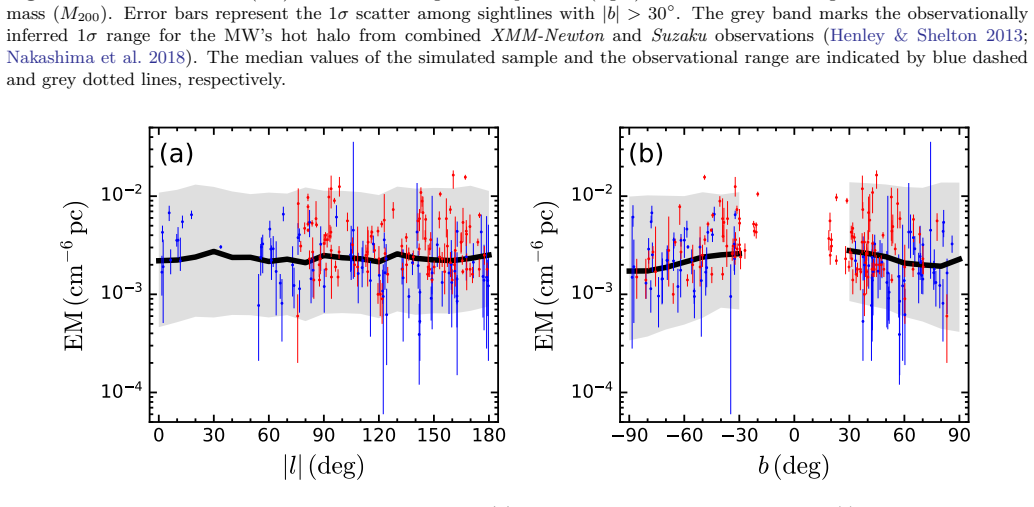
The simulated halos reproduce the observed global soft X-ray luminosity, inner-halo X-ray surface brightness, emission measure, and O VII absorption strength. The azimuthally averaged X-ray surface brightness profile declines too steeply with radius, falling below eROSITA stacking observations by up to 1 dex at R greater than or equal to 100 kpc, and the halos underproduce O VIII absorption with a median equivalent width 65 percent lower than observed in the Galactic halo, indicating a deficit of gas at T approximately 1.6 to 3.2 times 10^6 K. These results indicate that the TNG50 feedback model deposits energy too centrally and too vigorously to sustain a gently extended, multi-phase corona
What carries the argument
Synthetic soft X-ray emission and O VII/O VIII absorption line calculations applied to the simulated gas distributions from internal and external viewpoints.
If this is right
- The feedback prescription must spread energy deposition over larger radii to produce extended hot gas distributions.
- Models require a mechanism to maintain a hotter gas phase at temperatures around 2 million Kelvin in the outer halo.
- Predicted X-ray emission from external galaxies at large radii will remain too low under current TNG feedback.
- Absorption studies in similar simulations will continue to underestimate the hotter component of the circumgalactic medium.
Where Pith is reading between the lines
- Other cosmological simulations using comparable central feedback may exhibit the same compactness and temperature deficit.
- Deeper X-ray observations at large radii could distinguish feedback variants that produce extended coronae.
- Modifying feedback to extend the halo might change the overall gas retention and star formation histories in Milky Way analogs.
- The discrepancy connects to wider questions about how simulations reproduce the full structure of the circumgalactic medium.
Load-bearing premise
The chosen TNG50 Milky Way analogs represent real galaxies and the mock X-ray and absorption calculations capture all observational selection effects, background subtraction, and line-of-sight integration without bias.
What would settle it
A stacked X-ray surface brightness profile of real Milky Way-mass galaxies that stays above the simulated steep decline at radii beyond 100 kpc, or measured O VIII equivalent widths matching the higher observed values, would show the simulated halos are not too compact.
Figures


read the original abstract
The origin and structure of the hot ($T\gtrsim10^6$K) gaseous halo around Milky Way (MW)-mass galaxies provide a critical test for galaxy formation models. We perform a comprehensive comparison for a sample of MW analogues from the TNG50 cosmological simulation by generating synthetic soft X-ray emission and O VII/O VIII absorption lines, viewed from both internal (Solar) and external perspectives. The simulated halos successfully reproduce the observed global soft X-ray luminosity, inner-halo X-ray surface brightness, emission measure, and O VII absorption strength. However, two interconnected discrepancies are identified. First, the azimuthally averaged X-ray surface brightness profile from external viewpoints declines too steeply with radius compared to the extended emission detected in eROSITA stacking of SDSS galaxies, falling below the observations by up to $\sim 1$ dex at $R \gtrsim 100$ kpc. Second, the halos systematically underproduce O VIII absorption, with a median equivalent width $\sim 65\%$ lower than that observed in the Galactic halo, pointing to a deficit of hotter-phase gas at $T\sim(1.6-3.2)\times10^6$ K. These findings indicate that the simulated hot halos are too spatially compact and lack a hotter gas phase, suggesting that the TNG50 feedback model, while generating hot gas, deposits energy too centrally and too vigorously to sustain a gently extended, multi-phase corona.
Editorial analysis
A structured set of objections, weighed in public.
Referee Report
Summary. The manuscript compares hot gaseous halos around Milky Way analogues in the TNG50 simulation to observations by generating synthetic soft X-ray emission maps and O VII/O VIII absorption lines from internal and external viewpoints. It reports good agreement with observed global soft X-ray luminosity, inner-halo surface brightness, emission measure, and O VII absorption, but finds that azimuthally averaged X-ray profiles decline too steeply (by up to ~1 dex at R ≳ 100 kpc) relative to eROSITA/SDSS stacking and that O VIII absorption is underproduced by a median ~65%, indicating overly compact halos lacking a hotter gas phase at T ~ (1.6-3.2)×10^6 K due to overly central and vigorous energy deposition in the TNG50 feedback model.
Significance. If the discrepancies prove robust, the work provides a clear, quantitative test of feedback implementations in cosmological simulations against multi-wavelength halo observations. The direct generation of synthetic observables from both Solar and external perspectives is a strength that enables falsifiable comparisons without free parameters fitted to the target data. This highlights a potential limitation in sustaining extended, multi-phase coronae and could guide refinements in how feedback energy is distributed in galaxy formation models.
major comments (2)
- [§4] §4 (Synthetic Observables): The central claim that simulated X-ray profiles are too compact depends on the synthetic emission maps replicating eROSITA stacking selection effects, background subtraction, point-source masking, and line-of-sight integration. The manuscript does not provide a quantitative validation (e.g., via mock observations with identical processing pipelines) that these steps are matched, raising the possibility that the reported ~1 dex deficit at R ≳ 100 kpc arises partly from methodological mismatch rather than the gas distribution itself.
- [§5.2] §5.2 (Absorption Line Analysis): The reported ~65% deficit in O VIII equivalent width is used to infer a missing hotter gas phase, but the temperature binning (1.6-3.2×10^6 K) and ionization assumptions are not cross-checked against the simulation's full density-metallicity distribution or against alternative ionization models; this weakens the link between the absorption discrepancy and the feedback energy deposition interpretation.
minor comments (2)
- [§2] The sample size and selection criteria for the MW analogues (e.g., exact stellar mass and isolation cuts) are stated but could be tabulated with basic properties for reproducibility.
- [Figure 3] Figure captions for the X-ray surface brightness profiles should explicitly note the azimuthal averaging method and any masking applied to match observational procedures.
Simulated Author's Rebuttal
We thank the referee for their thorough and constructive review of our manuscript. The comments help clarify the robustness of our synthetic observable comparisons. We address each major comment point by point below and have incorporated revisions to strengthen the presentation of our methods and analysis.
read point-by-point responses
-
Referee: [§4] §4 (Synthetic Observables): The central claim that simulated X-ray profiles are too compact depends on the synthetic emission maps replicating eROSITA stacking selection effects, background subtraction, point-source masking, and line-of-sight integration. The manuscript does not provide a quantitative validation (e.g., via mock observations with identical processing pipelines) that these steps are matched, raising the possibility that the reported ~1 dex deficit at R ≳ 100 kpc arises partly from methodological mismatch rather than the gas distribution itself.
Authors: We appreciate the referee's emphasis on ensuring methodological consistency. Our synthetic X-ray maps were generated in the 0.5-2 keV band with line-of-sight integration matching the external viewpoint of the eROSITA/SDSS stacking analysis, and we applied azimuthal averaging consistent with the observational procedure. However, we acknowledge that a fully quantitative end-to-end validation (including explicit background subtraction and point-source masking pipelines) was not presented in the original text. In the revised manuscript, we have expanded §4 to include a step-by-step description of how our processing replicates the stacking selection effects and background handling. We additionally performed a sensitivity test applying a uniform background model scaled to eROSITA levels, which shows the simulated profile still declines by ~0.8 dex relative to observations at R ~ 100 kpc. This indicates the discrepancy is driven by the gas distribution rather than processing differences. We have updated the text and figure captions accordingly. revision: yes
-
Referee: [§5.2] §5.2 (Absorption Line Analysis): The reported ~65% deficit in O VIII equivalent width is used to infer a missing hotter gas phase, but the temperature binning (1.6-3.2×10^6 K) and ionization assumptions are not cross-checked against the simulation's full density-metallicity distribution or against alternative ionization models; this weakens the link between the absorption discrepancy and the feedback energy deposition interpretation.
Authors: We thank the referee for this suggestion to bolster the absorption analysis. Our original calculation applied standard CIE ionization fractions (from AtomDB) to the simulation gas particles, selecting the temperature bin where O VIII peaks under typical halo conditions. To directly address the concern, the revised §5.2 now includes an explicit cross-check: we bin the contributing gas particles by their native density and metallicity distributions from TNG50 and confirm that the adopted temperature range (1.6-3.2×10^6 K) aligns with the O VIII-producing gas. We further tested an alternative ionization model allowing for mild non-equilibrium effects and find the median O VIII equivalent width changes by <10%, preserving the ~65% deficit relative to observations. These additions strengthen the connection to overly central feedback limiting the extended hotter phase, and we have updated the discussion to reflect the new checks. revision: yes
Circularity Check
No significant circularity in simulation-observation comparison.
full rationale
The paper generates synthetic X-ray surface brightness profiles, emission measures, and O VII/O VIII absorption equivalent widths from TNG50 MW-analogue halos and compares them directly to independent external datasets (eROSITA/SDSS stacking and Galactic absorption measurements). No parameters are fitted to the target observations; the reported discrepancies (too-steep radial decline and O VIII deficit) are outputs of the simulation's existing feedback model. The derivation chain contains no self-definitional steps, fitted-input predictions, load-bearing self-citations, or imported uniqueness theorems that reduce the central claims to the paper's own inputs. The analysis is therefore self-contained against external benchmarks.
Axiom & Free-Parameter Ledger
axioms (1)
- domain assumption The TNG50 subgrid feedback model and hydrodynamics accurately capture the dominant processes that set the thermal and spatial distribution of hot halo gas.
Lean theorems connected to this paper
-
IndisputableMonolith/Foundation/RealityFromDistinction.leanreality_from_one_distinction unclear?
unclearRelation between the paper passage and the cited Recognition theorem.
synthetic soft X-ray emission and O VII/O VIII absorption lines... azimuthally averaged X-ray surface brightness profile... TNG50 feedback model
What do these tags mean?
- matches
- The paper's claim is directly supported by a theorem in the formal canon.
- supports
- The theorem supports part of the paper's argument, but the paper may add assumptions or extra steps.
- extends
- The paper goes beyond the formal theorem; the theorem is a base layer rather than the whole result.
- uses
- The paper appears to rely on the theorem as machinery.
- contradicts
- The paper's claim conflicts with a theorem or certificate in the canon.
- unclear
- Pith found a possible connection, but the passage is too broad, indirect, or ambiguous to say the theorem truly supports the claim.
Reference graph
Works this paper leans on
-
[1]
The Astronomical Journal , author =
Astropy Collaboration, Price-Whelan, A. M., Sip˝ ocz, B. M., et al. 2018, AJ, 156, 123, doi: 10.3847/1538-3881/aabc4f
-
[2]
2016, ARA&A, 54, 529, doi: 10.1146/annurev-astro-081915-023441 Bogd´ an,´A., Forman, W
Bland-Hawthorn, J., & Gerhard, O. 2016, ARA&A, 54, 529, doi: 10.1146/annurev-astro-081915-023441 Bogd´ an,´A., Forman, W. R., Vogelsberger, M., et al. 2013, ApJ, 772, 97, doi: 10.1088/0004-637X/772/2/97
-
[3]
2016, MNRAS, 457, 4236, doi: 10.1093/mnras/stw285 xiiZhang et al
Bonamente, M., Nevalainen, J., Tilton, E., et al. 2016, MNRAS, 457, 4236, doi: 10.1093/mnras/stw285 xiiZhang et al
-
[4]
Chadayammuri, U., Bogd´ an,´A., Oppenheimer, B. D., et al. 2022, ApJL, 936, L15, doi: 10.3847/2041-8213/ac8936
-
[5]
2022, A&A, 666, A156, doi: 10.1051/0004-6361/202243101
Comparat, J., Truong, N., Merloni, A., et al. 2022, A&A, 666, A156, doi: 10.1051/0004-6361/202243101
-
[6]
2019, ApJL, 882, L23, doi: 10.3847/2041-8213/ab3b09
Das, S., Mathur, S., Nicastro, F., & Krongold, Y. 2019, ApJL, 882, L23, doi: 10.3847/2041-8213/ab3b09
-
[7]
Fang, T., Bryan, G. L., & Canizares, C. R. 2002, ApJ, 564, 604, doi: 10.1086/324400
-
[8]
2015, ApJS, 217, 21, doi: 10.1088/0067-0049/217/2/21
Fang, T., Buote, D., Bullock, J., & Ma, R. 2015, ApJS, 217, 21, doi: 10.1088/0067-0049/217/2/21
-
[9]
2014, ApJL, 785, L24, doi: 10.1088/2041-8205/785/2/L24
Fang, T., & Jiang, X. 2014, ApJL, 785, L24, doi: 10.1088/2041-8205/785/2/L24
-
[10]
Fang, T., Mckee, C. F., Canizares, C. R., & Wolfire, M. 2006, ApJ, 644, 174, doi: 10.1086/500310
-
[11]
Fang, T., Sembach, K. R., & Canizares, C. R. 2003, ApJL, 586, L49, doi: 10.1086/374680
-
[12]
2012, ApJL, 756, L8, doi: 10.1088/2041-8205/756/1/L8
Galeazzi, M. 2012, ApJL, 756, L8, doi: 10.1088/2041-8205/756/1/L8
-
[13]
2026, arXiv e-prints, arXiv:2601.16499, doi: 10.48550/arXiv.2601.16499
He, L., & Li, Z. 2026, arXiv e-prints, arXiv:2601.16499, doi: 10.48550/arXiv.2601.16499
-
[14]
Henley, D. B., & Shelton, R. L. 2013, ApJ, 773, 92, doi: 10.1088/0004-637X/773/2/92
-
[15]
2015, ApJ, 800, 102, doi: 10.1088/0004-637X/800/2/102
Low, M.-M. 2015, ApJ, 800, 102, doi: 10.1088/0004-637X/800/2/102
-
[16]
Hopkins, P. F., Quataert, E., Ponnada, S. B., & Silich, E. 2025, The Open Journal of Astrophysics, 8, 78, doi: 10.33232/001c.141293
-
[17]
Hunter, J. D. 2007, Computing in Science and Engineering, 9, 90, doi: 10.1109/MCSE.2007.55
-
[18]
2020, MNRAS, 499, 5862, doi: 10.1093/mnras/staa3122
Torrey, P. 2020, MNRAS, 499, 5862, doi: 10.1093/mnras/staa3122
-
[19]
Li, J.-T., & Wang, Q. D. 2013, MNRAS, 428, 2085, doi: 10.1093/mnras/sts183
-
[20]
2020, ApJ, 898, 148, doi: 10.3847/1538-4357/ab9f9f
Li, M., & Tonnesen, S. 2020, ApJ, 898, 148, doi: 10.3847/1538-4357/ab9f9f
-
[21]
Licquia, T. C., & Newman, J. A. 2015, ApJ, 806, 96, doi: 10.1088/0004-637X/806/1/96
-
[22]
2018, ApJS, 235, 28, doi: 10.3847/1538-4365/aab270
Luo, Y., Fang, T., & Ma, R. 2018, ApJS, 235, 28, doi: 10.3847/1538-4365/aab270
-
[23]
2019, MNRAS, 489, 4233, doi: 10.1093/mnras/stz2391
Springel, V. 2019, MNRAS, 489, 4233, doi: 10.1093/mnras/stz2391
-
[24]
2018, MNRAS, 480, 5113, doi: 10.1093/mnras/sty2206
Marinacci, F., Vogelsberger, M., Pakmor, R., et al. 2018, MNRAS, 480, 5113, doi: 10.1093/mnras/sty2206
work page internal anchor Pith review doi:10.1093/mnras/sty2206 2018
-
[25]
1998, A&AS, 133, 403, doi: 10.1051/aas:1998330
Mazzotta, P., Mazzitelli, G., Colafrancesco, S., & Vittorio, N. 1998, A&AS, 133, 403, doi: 10.1051/aas:1998330
-
[26]
Merloni, A., Lamer, G., Liu, T., et al. 2024, A&A, 682, A34, doi: 10.1051/0004-6361/202347165
work page internal anchor Pith review doi:10.1051/0004-6361/202347165 2024
-
[27]
Miller, M. J., & Bregman, J. N. 2015, ApJ, 800, 14, doi: 10.1088/0004-637X/800/1/14
-
[28]
P., Pillepich, A., Springel, V., et al
Naiman, J. P., Pillepich, A., Springel, V., et al. 2018, MNRAS, 477, 1206, doi: 10.1093/mnras/sty618
work page internal anchor Pith review doi:10.1093/mnras/sty618 2018
-
[29]
2018, ApJ, 862, 34, doi: 10.3847/1538-4357/aacceb
Nakashima, S., Inoue, Y., Yamasaki, N., et al. 2018, ApJ, 862, 34, doi: 10.3847/1538-4357/aacceb
-
[30]
First results from the IllustrisTNG simulations: the galaxy color bimodality
Nelson, D., Pillepich, A., Springel, V., et al. 2018, MNRAS, 475, 624, doi: 10.1093/mnras/stx3040 —. 2019, MNRAS, 490, 3234, doi: 10.1093/mnras/stz2306
work page internal anchor Pith review doi:10.1093/mnras/stx3040 2018
-
[31]
Oppenheimer, B. D., Bogd´ an,´A., Crain, R. A., et al. 2020, ApJL, 893, L24, doi: 10.3847/2041-8213/ab846f
-
[32]
Pan, Z., Qu, Z., Bregman, J. N., & Liu, J. 2024, ApJS, 271, 62, doi: 10.3847/1538-4365/ad2ea0
-
[33]
2015, ApJL, 813, L27, doi: 10.1088/2041-8205/813/2/L27
Peters, T., Girichidis, P., Gatto, A., et al. 2015, ApJL, 813, L27, doi: 10.1088/2041-8205/813/2/L27
-
[34]
2021, MNRAS, 508, 4667, doi: 10.1093/mnras/stab2779
Pillepich, A., Nelson, D., Truong, N., et al. 2021, MNRAS, 508, 4667, doi: 10.1093/mnras/stab2779
-
[35]
2018a, MNRAS, 475, 648, doi: 10.1093/mnras/stx3112
Pillepich, A., Nelson, D., Hernquist, L., et al. 2018a, MNRAS, 475, 648, doi: 10.1093/mnras/stx3112
work page internal anchor Pith review doi:10.1093/mnras/stx3112
-
[36]
2018b, MNRAS, 473, 4077, doi: 10.1093/mnras/stx2656
Pillepich, A., Springel, V., Nelson, D., et al. 2018b, MNRAS, 473, 4077, doi: 10.1093/mnras/stx2656
work page internal anchor Pith review doi:10.1093/mnras/stx2656
-
[37]
2019, MNRAS, 490, 3196, doi: 10.1093/mnras/stz2338
Pillepich, A., Nelson, D., Springel, V., et al. 2019, MNRAS, 490, 3196, doi: 10.1093/mnras/stz2338
-
[38]
2024, MNRAS, 535, 1721, doi: 10.1093/mnras/stae2165
Pillepich, A., Sotillo-Ramos, D., Ramesh, R., et al. 2024, MNRAS, 535, 1721, doi: 10.1093/mnras/stae2165
-
[39]
2023, MNRAS, 518, 5754, doi: 10.1093/mnras/stac3524
Ramesh, R., Nelson, D., & Pillepich, A. 2023, MNRAS, 518, 5754, doi: 10.1093/mnras/stac3524
-
[40]
Schellenberger, G., Bogd´ an,´A., ZuHone, J. A., et al. 2024, ApJ, 969, 85, doi: 10.3847/1538-4357/ad4548
-
[41]
M., ZuHone, J., Bellomi, E., et al
Silich, E. M., ZuHone, J., Bellomi, E., et al. 2025, ApJ, 993, 125, doi: 10.3847/1538-4357/ae08a3
-
[42]
Raymond, J. C. 2001, ApJL, 556, L91, doi: 10.1086/322992
-
[43]
Snowden, S. L., Egger, R., Freyberg, M. J., et al. 1997, ApJ, 485, 125, doi: 10.1086/304399
-
[44]
1956, ApJ, 124, 20, doi: 10.1086/146200
Spitzer, Jr., L. 1956, ApJ, 124, 20, doi: 10.1086/146200
-
[45]
doi:10.1111/j.1365-2966.2009.15598.x , archivePrefix =
Springel, V. 2010, MNRAS, 401, 791, doi: 10.1111/j.1365-2966.2009.15715.x
-
[46]
2018, MNRAS, 475, 676, doi: 10.1093/mnras/stx3304
Springel, V., Pakmor, R., Pillepich, A., et al. 2018, MNRAS, 475, 676, doi: 10.1093/mnras/stx3304
-
[47]
Hoopes, C. G., & Weaver, K. A. 2004, ApJ, 606, 829, doi: 10.1086/383136
-
[48]
2020, MNRAS, 494, 549, doi: 10.1093/mnras/staa685
Truong, N., Pillepich, A., Werner, N., et al. 2020, MNRAS, 494, 549, doi: 10.1093/mnras/staa685
-
[49]
Truong, N., Pillepich, A., Nelson, D., et al. 2023, MNRAS, 525, 1976, doi: 10.1093/mnras/stad2216 Hot halo of MW-like galaxies in TNG50xiii T¨ ullmann, R., Pietsch, W., Rossa, J., Breitschwerdt, D., &
-
[50]
Dettmar, R. J. 2006, A&A, 448, 43, doi: 10.1051/0004-6361:20052936
-
[51]
Tumlinson, J., Peeples, M. S., & Werk, J. K. 2017, ARA&A, 55, 389, doi: 10.1146/annurev-astro-091916-055240
work page internal anchor Pith review doi:10.1146/annurev-astro-091916-055240 2017
-
[52]
Turk, M. J., Smith, B. D., Oishi, J. S., et al. 2011, ApJS, 192, 9, doi: 10.1088/0067-0049/192/1/9
-
[53]
Virtanen, P., Gommers, R., Oliphant, T. E., et al. 2020, Nature Methods, 17, 261, doi: 10.1038/s41592-019-0686-2
-
[54]
2013, MNRAS, 436, 3031, doi: 10.1093/mnras/stt1789
Vogelsberger, M., Genel, S., Sijacki, D., et al. 2013, MNRAS, 436, 3031, doi: 10.1093/mnras/stt1789
-
[55]
2020, Nature Reviews Physics, 2, 42, doi: 10.1038/s42254-019-0127-2
Vogelsberger, M., Marinacci, F., Torrey, P., & Puchwein, E. 2020, Nature Reviews Physics, 2, 42, doi: 10.1038/s42254-019-0127-2
-
[56]
2014a, Nature, 509, 177, doi: 10.1038/nature13316 —
Vogelsberger, M., Genel, S., Springel, V., et al. 2014a, Nature, 509, 177, doi: 10.1038/nature13316 —. 2014b, MNRAS, 444, 1518, doi: 10.1093/mnras/stu1536
-
[57]
D., Li, J., Jiang, X., & Fang, T
Wang, Q. D., Li, J., Jiang, X., & Fang, T. 2016, MNRAS, 457, 1385, doi: 10.1093/mnras/stv2886
-
[58]
2017, MNRAS, 465, 3291, doi: 10.1093/mnras/stw2944
Weinberger, R., Springel, V., Hernquist, L., et al. 2017, MNRAS, 465, 3291, doi: 10.1093/mnras/stw2944
work page internal anchor Pith review doi:10.1093/mnras/stw2944 2017
-
[59]
White, S. D. M., & Frenk, C. S. 1991, ApJ, 379, 52, doi: 10.1086/170483
-
[60]
White, S. D. M., & Rees, M. J. 1978, MNRAS, 183, 341, doi: 10.1093/mnras/183.3.341
-
[61]
Yoshino, T., Mitsuda, K., Yamasaki, N. Y., et al. 2009, PASJ, 61, 805, doi: 10.1093/pasj/61.4.805
-
[62]
2010, ApJ, 717, 74, doi: 10.1088/0004-637X/717/1/74
Zappacosta, L., Nicastro, F., Maiolino, R., et al. 2010, ApJ, 717, 74, doi: 10.1088/0004-637X/717/1/74
-
[63]
2024, A&A, 690, A267, doi: 10.1051/0004-6361/202449412
Zhang, Y., Comparat, J., Ponti, G., et al. 2024a, A&A, 690, A267, doi: 10.1051/0004-6361/202449412 —. 2025a, A&A, 693, A197, doi: 10.1051/0004-6361/202452273
-
[64]
2024b, ApJ, 962, 15, doi: 10.3847/1538-4357/ad10a4 —
Zhang, Z., Zhang, X., Li, H., et al. 2024b, ApJ, 962, 15, doi: 10.3847/1538-4357/ad10a4 —. 2025b, ApJ, 991, 170, doi: 10.3847/1538-4357/ae019f
-
[65]
Zheng, Y., Peeples, M. S., O’Shea, B. W., et al. 2020, ApJ, 896, 143, doi: 10.3847/1538-4357/ab960a
discussion (0)
Sign in with ORCID, Apple, or X to comment. Anyone can read and Pith papers without signing in.