Recognition: unknown
Generative diffusion models for spatiotemporal influenza forecasting
Pith reviewed 2026-05-08 04:03 UTC · model grok-4.3
The pith
Diffusion models can generate realistic and competitive influenza forecasts by treating epidemic seasons as spatiotemporal images.
A machine-rendered reading of the paper's core claim, the machinery that carries it, and where it could break.
Core claim
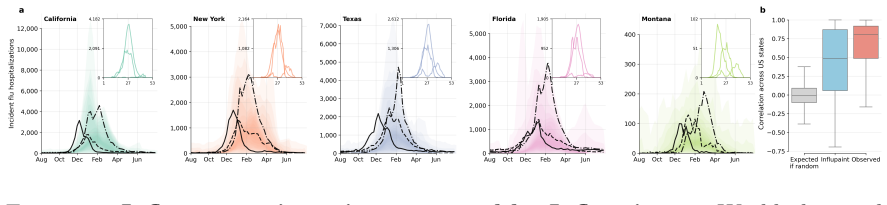
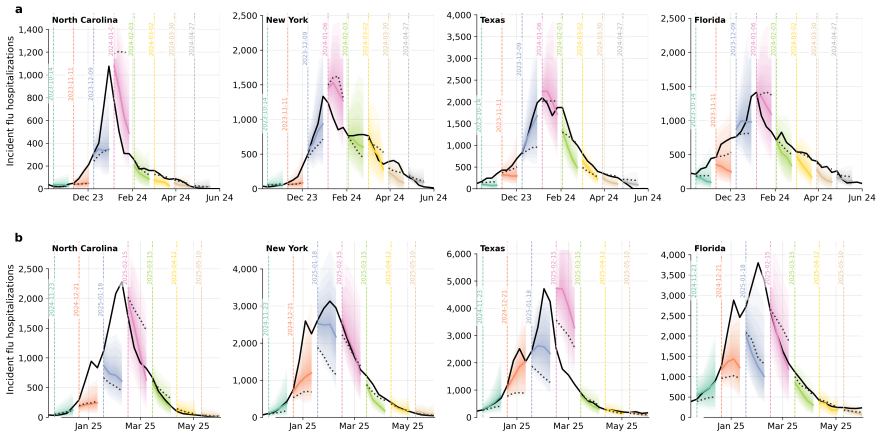
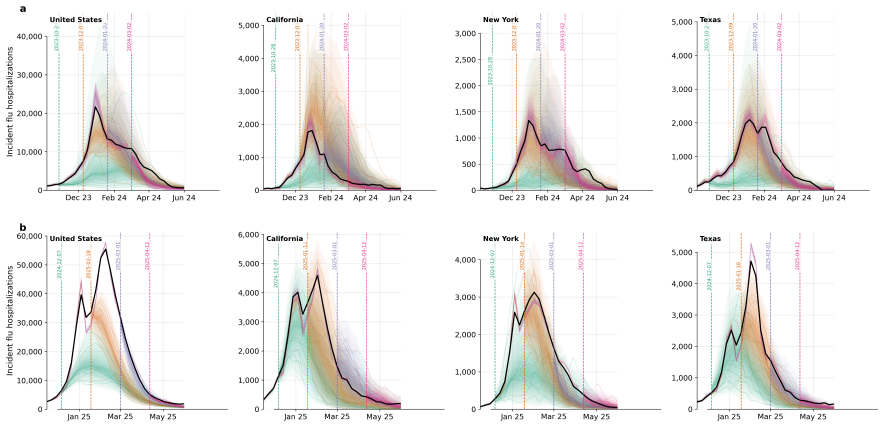
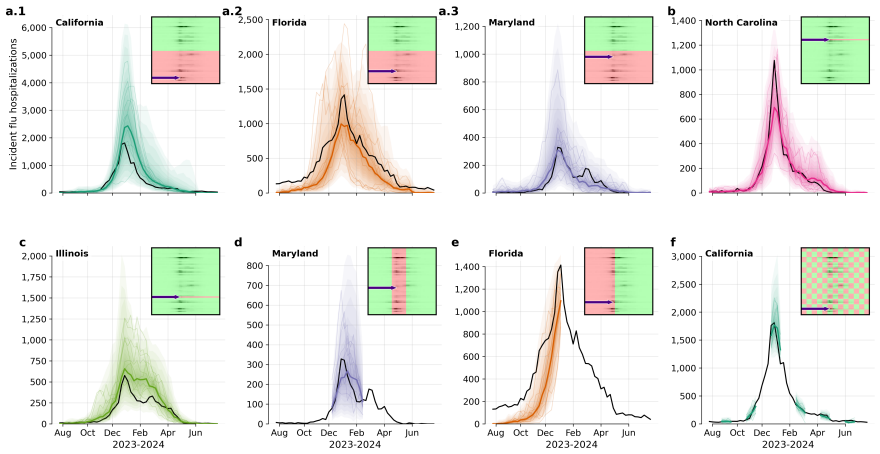
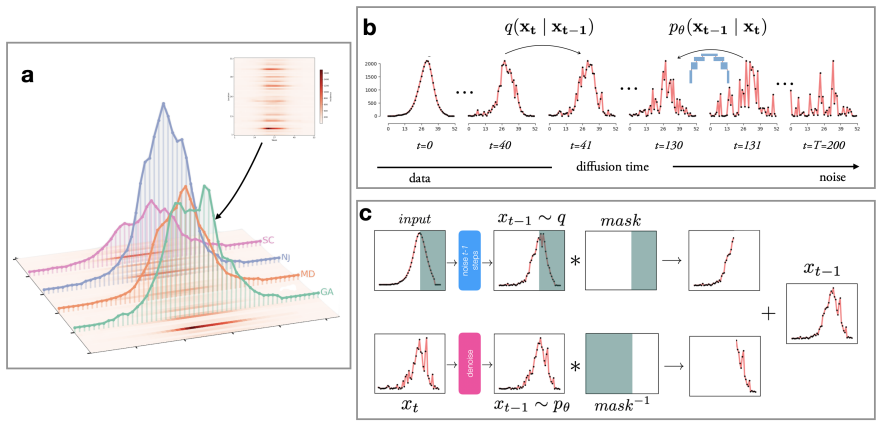
Influpaint adapts denoising diffusion probabilistic models to epidemic forecasting. By encoding influenza seasons as spatiotemporal images in which pixel intensity represents incidence, Influpaint learns a rich distribution of disease dynamics from a hybrid dataset of surveillance and simulated trajectories. Forecasting is formulated as a conditional generation (inpainting) task from partial observations. We show that Influpaint generates realistic, diverse epidemic trajectories and achieves forecast accuracy that is competitive with leading ensemble methods in retrospective evaluation. In real-time evaluation during the 2023--2025 U.S. CDC FluSight challenges, performance improved across 2-
What carries the argument
Influpaint, a conditional denoising diffusion model that encodes flu seasons as spatiotemporal incidence images and performs forecasting by inpainting from partial observations.
If this is right
- The model produces diverse realistic trajectories that capture the range of possible epidemic outcomes.
- Forecast accuracy reaches levels competitive with established ensemble methods in historical testing.
- Real-time performance during CDC challenges improved across multiple seasons with the hybrid data mix.
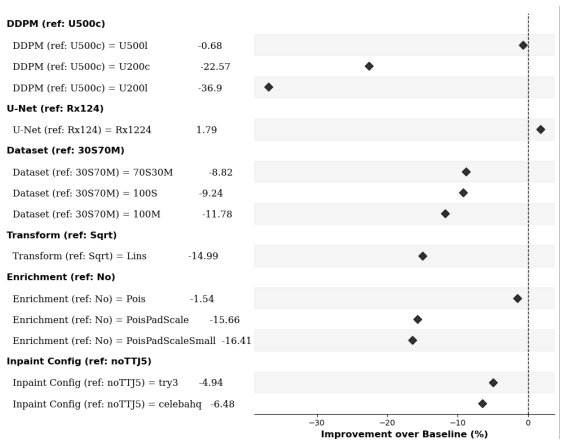
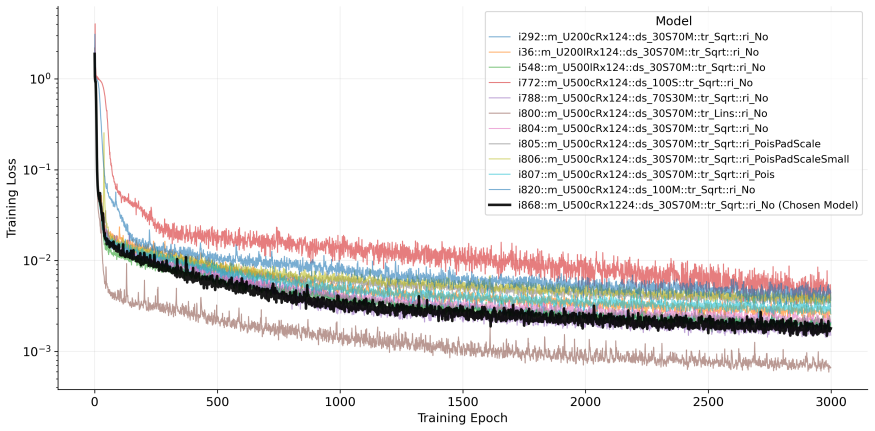
- Best results occur when training uses 30% real surveillance data combined with 70% simulated trajectories.
Where Pith is reading between the lines
- The image-based approach could be tested on other diseases that have spatiotemporal incidence records available.
- Generated trajectory sets might support scenario analysis for evaluating potential public health interventions.
- The method's flexibility with partial data could enable better handling of irregular reporting patterns in practice.
Load-bearing premise
The hybrid training dataset of 30% surveillance data and 70% simulated trajectories accurately represents the true distribution of real-world influenza spatiotemporal dynamics.
What would settle it
A future influenza season in which Influpaint's forecast accuracy falls substantially below leading ensemble methods in a blind retrospective or real-time evaluation would show the method fails to generalize.
Figures


read the original abstract
Forecasting infectious disease incidence can provide important information to guide public health planning, yet is difficult because epidemic dynamics are complex. Current mechanistic and statistical approaches often struggle to capture multimodal uncertainty or emergent trends. Influpaint adapts denoising diffusion probabilistic models to epidemic forecasting. By encoding influenza seasons as spatiotemporal images in which pixel intensity represents incidence, Influpaint learns a rich distribution of disease dynamics from a hybrid dataset of surveillance and simulated trajectories. Forecasting is formulated as a conditional generation (inpainting) task from partial observations. We show that Influpaint generates realistic, diverse epidemic trajectories and achieves forecast accuracy that is competitive with leading ensemble methods in retrospective evaluation. In real-time evaluation during the 2023--2025 U.S. CDC FluSight challenges, performance improved substantially across seasons, with highly accurate but somewhat overconfident projections in 2024--2025. The best performance was achieved with a training dataset containing 30% surveillance and 70% simulated trajectories. These results show that diffusion models can capture important spatiotemporal structure in influenza dynamics and provide a flexible framework for probabilistic infectious disease forecasting.
Editorial analysis
A structured set of objections, weighed in public.
Referee Report
Summary. The paper introduces Influpaint, a denoising diffusion probabilistic model adapted for spatiotemporal influenza forecasting. Epidemic seasons are encoded as images with pixel intensity representing incidence; the model is trained on a hybrid dataset (30% real surveillance data and 70% simulated trajectories) and forecasting is cast as a conditional inpainting task from partial observations. The central claims are that Influpaint generates realistic and diverse epidemic trajectories and achieves forecast accuracy competitive with leading ensemble methods in retrospective evaluation, with substantially improved real-time performance in the 2023–2025 CDC FluSight challenges (best results at the 30/70 hybrid ratio).
Significance. If the claims hold, the work demonstrates that diffusion-based generative models can capture complex spatiotemporal structure in epidemic dynamics and provide a flexible probabilistic forecasting framework that handles multimodal uncertainty better than many mechanistic or statistical baselines. The real-time FluSight evaluation adds practical relevance, and the hybrid training strategy is an interesting way to augment limited surveillance data. These elements could influence future generative approaches to infectious disease modeling.
major comments (2)
- [Abstract (training dataset description)] The central claim of competitive retrospective accuracy and realistic generation rests on the hybrid training set (30% surveillance + 70% simulated) being representative of real influenza dynamics. The abstract states this ratio yields the best performance but provides no validation that the simulator reproduces key real-world features (spatially heterogeneous interventions, reporting delays, behavioral multimodalities). If the simulator is misspecified, the learned conditional distribution will be biased, directly weakening both the “realistic, diverse” generation claim and the ensemble comparison.
- [Abstract (evaluation claims)] The abstract reports competitive accuracy and improved real-time performance but supplies no error bars, exact evaluation metrics (e.g., MAE, WIS, or log-score definitions), data exclusion rules, or statistical tests comparing Influpaint to ensembles. Without these, the support for the accuracy claim cannot be fully verified from the provided information.
minor comments (2)
- [Methods] Clarify the precise definition of the spatiotemporal image encoding (e.g., grid resolution, incidence normalization) and the inpainting mask construction for partial observations.
- [Results] Add a table or figure summarizing the exact retrospective and real-time metrics against named ensemble baselines for each season.
Simulated Author's Rebuttal
We thank the referee for their constructive feedback and positive assessment of the significance of Influpaint. We address each major comment below and have revised the manuscript to provide additional validation, clarification, and supporting details.
read point-by-point responses
-
Referee: [Abstract (training dataset description)] The central claim of competitive retrospective accuracy and realistic generation rests on the hybrid training set (30% surveillance + 70% simulated) being representative of real influenza dynamics. The abstract states this ratio yields the best performance but provides no validation that the simulator reproduces key real-world features (spatially heterogeneous interventions, reporting delays, behavioral multimodalities). If the simulator is misspecified, the learned conditional distribution will be biased, directly weakening both the “realistic, diverse” generation claim and the ensemble comparison.
Authors: We agree that explicit validation of the simulator is necessary to support the hybrid training strategy. In the revised manuscript we have added a dedicated subsection in Methods that compares simulator outputs to historical surveillance data on spatial heterogeneity, reporting delays, and multimodal incidence patterns. We also include sensitivity analyses varying simulator parameters and a limitations paragraph discussing potential misspecification. These additions directly address the concern while preserving the original 30/70 ratio as the empirically best-performing configuration. revision: yes
-
Referee: [Abstract (evaluation claims)] The abstract reports competitive accuracy and improved real-time performance but supplies no error bars, exact evaluation metrics (e.g., MAE, WIS, or log-score definitions), data exclusion rules, or statistical tests comparing Influpaint to ensembles. Without these, the support for the accuracy claim cannot be fully verified from the provided information.
Authors: We have revised both the abstract and the Results section to specify the primary metrics (Weighted Interval Score and mean absolute error), the exact data exclusion criteria (seasons with >20% missing weeks removed), and the inclusion of error bars on all retrospective and real-time performance plots. We further added paired statistical comparisons (Wilcoxon signed-rank tests) against the CDC ensemble baselines, with p-values reported in the main text and supplementary tables. These changes allow full verification of the accuracy claims without altering the abstract length substantially. revision: yes
Circularity Check
No significant circularity in derivation chain
full rationale
The paper adapts standard denoising diffusion probabilistic models (DDPMs) to influenza forecasting by treating epidemic seasons as spatiotemporal images and framing prediction as conditional inpainting. The hybrid training set (30% surveillance + 70% simulated trajectories) is presented as an input choice whose representativeness is an external modeling assumption, not a derived quantity. Retrospective accuracy is evaluated against independent ensemble methods on held-out seasons, and real-time CDC FluSight results are reported separately. No self-definitional reductions, fitted parameters renamed as predictions, load-bearing self-citations, or uniqueness theorems imported from the authors' prior work appear in the derivation. The central claims rest on the empirical performance of an off-the-shelf generative technique applied to a new domain rather than on any tautological re-expression of the inputs.
Axiom & Free-Parameter Ledger
free parameters (1)
- surveillance-to-simulated training ratio
axioms (1)
- domain assumption Denoising diffusion probabilistic models can learn a rich distribution over epidemic trajectories when data are encoded as images.
Reference graph
Works this paper leans on
-
[1]
Evaluating forecasts with scoringutils in r.arXiv preprint arXiv:2205.07090, 2022
Nikos I. Bosse et al.Evaluating Forecasts with scoringutils in R. arXiv:2205.07090 [stat]. Nov. 2024.doi: 10.48550/arXiv.2205.07090.url: http://arxiv.org/ abs/2205.07090(visited on 02/16/2026)
-
[2]
Evaluating epidemic forecasts in an interval format
Johannes Bracher et al. “Evaluating epidemic forecasts in an interval format”. en. In:PLOS Computational Biology17.2 (Feb. 2021). Ed. by Virginia E. Pitzer, e1008618.issn: 1553-7358.doi: 10.1371/journal.pcbi.1008618.url: https: //dx.plos.org/10.1371/journal.pcbi.1008618(visited on 04/22/2022)
-
[3]
Prafulla Dhariwal and Alex Nichol.Diffusion Models Beat GANs on Image Synthesis. arXiv:2105.05233 [cs, stat]. June 2021.doi:10.48550/arXiv.2105. 05233.url:http://arxiv.org/abs/2105.05233(visited on 09/08/2022)
-
[4]
Farrow et al.Delphi Epidata API
David C. Farrow et al.Delphi Epidata API. 2015.url:https://github.com/cmu- delphi/delphi-epidata
2015
-
[5]
Deep Residual Learning for Image Recognition
Kaiming He et al. “Deep Residual Learning for Image Recognition”. In:2016 IEEE Conference on Computer Vision and Pattern Recognition (CVPR). ISSN: 1063-6919. June 2016, pp. 770–778.doi:10.1109/CVPR.2016.90.url: https: //ieeexplore.ieee.org/document/7780459(visited on 02/16/2026)
-
[6]
Denoising Diffusion Probabilistic Models
Jonathan Ho, Ajay Jain, and Pieter Abbeel.Denoising Diffusion Probabilistic Models. arXiv:2006.11239 [cs, stat]. Dec. 2020.doi:10.48550/arXiv.2006.11239. url:http://arxiv.org/abs/2006.11239(visited on 09/08/2022)
work page internal anchor Pith review doi:10.48550/arxiv.2006.11239 2006
-
[7]
Consortium of Infectious Disease Modeling Hubs et al.Coordinating collaborative infectious disease modeling projects with the hubverse. en. ISSN: 3067-2007 Pages: 2025.10.03.25337284. Oct. 2025.doi: 10.1101/2025.10.03.25337284 .url: https : / / www . medrxiv . org / content / 10 . 1101 / 2025 . 10 . 03 . 25337284v1 (visited on 02/16/2026)
-
[9]
ImageNet Classification with Deep Convolutional Neural Networks
Alex Krizhevsky, Ilya Sutskever, and Geoffrey E Hinton. “ImageNet Classification with Deep Convolutional Neural Networks”. In:Advances in Neural Informa- tion Processing Systems. Vol. 25. Curran Associates, Inc., 2012.url:https:// proceedings.neurips.cc/paper/2012/hash/c399862d3b9d6b76c8436e924a68c45b- Abstract.html(visited on 10/31/2025)
2012
-
[10]
Learning skillful medium-range global weather forecasting,
Remi Lam et al. “Learning skillful medium-range global weather forecasting”. In: Science382.6677 (Dec. 2023), pp. 1416–1421.doi:10.1126/science.adi2336. url: https://www.science.org/doi/10.1126/science.adi2336 (visited on 12/22/2023). 23
-
[11]
Joseph C. Lemaitre et al. “flepiMoP: The evolution of a flexible infectious disease modeling pipeline during the COVID-19 pandemic”. In:Epidemics47 (June 2024), p. 100753.issn: 1755-4365.doi: 10.1016/j.epidem.2024.100753.url: https: //www.sciencedirect.com/science/article/pii/S1755436524000148 (vis- ited on 04/11/2024)
-
[12]
Zhuang Liu et al.A ConvNet for the 2020s. arXiv:2201.03545 [cs]. Mar. 2022. doi: 10.48550/arXiv.2201.03545.url: http://arxiv.org/abs/2201.03545 (visited on 10/28/2025)
-
[13]
Sara L. Loo et al. “The US COVID-19 and Influenza Scenario Modeling Hubs: Delivering long-term projections to guide policy”. In:Epidemics46 (Mar. 2024), p. 100738.issn: 1755-4365.doi: 10.1016/j.epidem.2023.100738.url: https: //www.sciencedirect.com/science/article/pii/S1755436523000749 (vis- ited on 01/12/2024)
-
[14]
Repaint: Inpainting using denoising diffusion probabilistic models, 2022
Andreas Lugmayr et al.RePaint: Inpainting using Denoising Diffusion Probabilis- tic Models. arXiv:2201.09865 [cs]. Aug. 2022.doi:10.48550/arXiv.2201.09865. url:http://arxiv.org/abs/2201.09865(visited on 10/16/2022)
-
[15]
Evaluation of FluSight influenza forecasting in the 2021–22 and 2022–23 seasons with a new target laboratory-confirmed influenza hospitalizations
Sarabeth M. Mathis et al. “Evaluation of FluSight influenza forecasting in the 2021–22 and 2022–23 seasons with a new target laboratory-confirmed influenza hospitalizations”. In:medRxiv(Dec. 2023), p. 2023.12.08.23299726.doi:10.1101/ 2023.12.08.23299726.url: https://www.ncbi.nlm.nih.gov/pmc/articles/ PMC10760285/(visited on 04/23/2024)
2021
-
[16]
Ilan Price et al. “Probabilistic weather forecasting with machine learning”. en. In: Nature637.8044 (Jan. 2025), pp. 84–90.issn: 1476-4687.doi:10.1038/s41586- 024-08252-9.url: https://www.nature.com/articles/s41586-024-08252- 9(visited on 02/25/2026)
-
[17]
Flusion: Integrating multiple data sources for accurate influenza predictions
Evan L. Ray et al. “Flusion: Integrating multiple data sources for accurate influenza predictions”. In:Epidemics50 (Mar. 2025), p. 100810.issn: 1755-4365. doi: 10.1016/j.epidem.2024.100810 .url: https://www.sciencedirect. com/science/article/pii/S1755436524000719(visited on 02/16/2026)
-
[18]
U-Net: Convolutional Networks for Biomedical Image Segmentation
Olaf Ronneberger, Philipp Fischer, and Thomas Brox.U-Net: Convolutional Networks for Biomedical Image Segmentation. arXiv:1505.04597 [cs]. May 2015. doi: 10.48550/arXiv.1505.04597.url: http://arxiv.org/abs/1505.04597 (visited on 09/23/2025)
work page internal anchor Pith review doi:10.48550/arxiv.1505.04597.url: 2015
-
[19]
arXiv:2302.01217 [cs, math, stat]
Litu Rout et al.A Theoretical Justification for Image Inpainting using Denoising Diffusion Probabilistic Models. arXiv:2302.01217 [cs, math, stat]. Feb. 2023.doi: 10 . 48550 / arXiv . 2302 . 01217.url: http : / / arxiv . org / abs / 2302 . 01217 (visited on 03/15/2023)
-
[20]
Denoising Diffusion Implicit Models
Jiaming Song, Chenlin Meng, and Stefano Ermon.Denoising Diffusion Implicit Models. arXiv:2010.02502 [cs]. Oct. 2022.doi: 10.48550/arXiv.2010.02502 . url:http://arxiv.org/abs/2010.02502(visited on 10/25/2025). 24
-
[21]
Ashish Vaswani et al.Attention Is All You Need. arXiv:1706.03762 [cs]. Aug. 2023. doi: 10.48550/arXiv.1706.03762.url: http://arxiv.org/abs/1706.03762 (visited on 09/23/2025)
work page internal anchor Pith review doi:10.48550/arxiv.1706.03762.url: 2023
-
[22]
Machine learning-based short-term forecasting of COVID-19 hospital admissions using routine hospital patient data
Martin S. Wohlfender et al. “Machine learning-based short-term forecasting of COVID-19 hospital admissions using routine hospital patient data”. In:Epidemics 54 (Mar. 2026), p. 100877.issn: 1755-4365.doi: 10 . 1016 / j . epidem . 2025 . 100877.url: https : / / www . sciencedirect . com / science / article / pii / S1755436525000659(visited on 02/16/2026)
2026
-
[23]
YuxinWuandKaimingHe.Group Normalization.arXiv:1803.08494[cs].June2018. doi: 10.48550/arXiv.1803.08494.url: http://arxiv.org/abs/1803.08494 (visited on 09/23/2025)
-
[24]
Guanhua Zhang et al.Towards Coherent Image Inpainting Using Denoising Diffusion Implicit Models. arXiv:2304.03322 [cs]. Apr. 2023.doi: 10 . 48550 / arXiv . 2304 . 03322.url: http : / / arxiv . org / abs / 2304 . 03322(visited on 11/08/2023). 25
discussion (0)
Sign in with ORCID, Apple, or X to comment. Anyone can read and Pith papers without signing in.