Recognition: unknown
DRAGON: A Benchmark for Evidence-Grounded Visual Reasoning over Diagrams
Pith reviewed 2026-05-07 17:03 UTC · model grok-4.3
The pith
DRAGON benchmark requires vision-language models to identify the diagram regions that support their answers.
A machine-rendered reading of the paper's core claim, the machinery that carries it, and where it could break.
Core claim
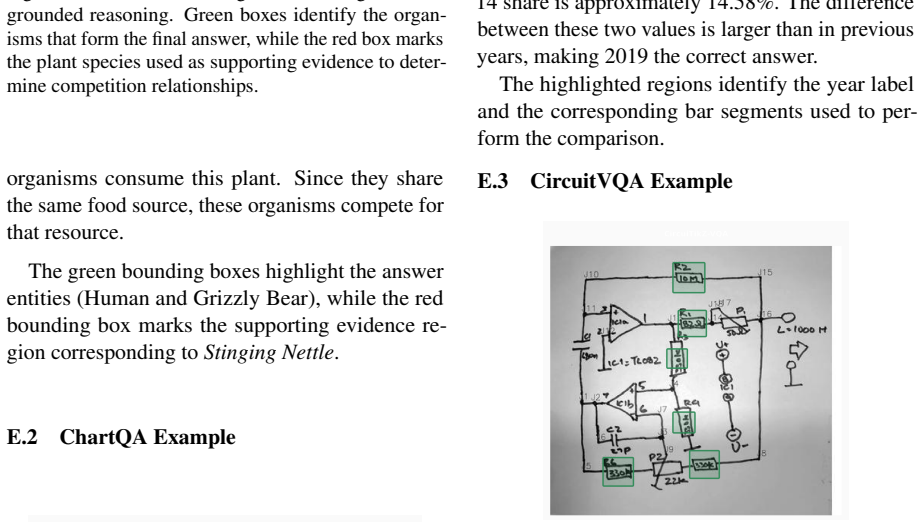
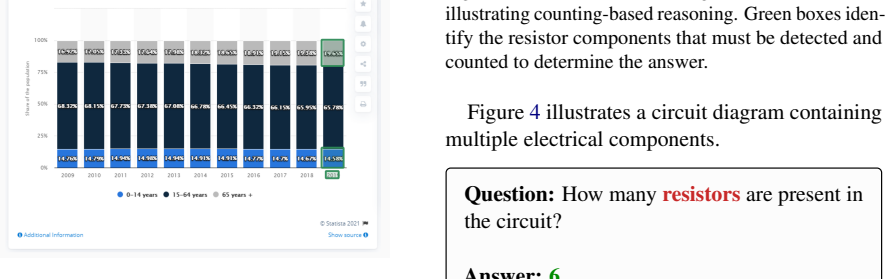
DRAGON is a benchmark where, given a diagram, a question, and the correct answer, a model must predict bounding boxes around the visual elements required to justify that answer. These evidence regions may include answer-bearing components, textual labels, legends, axes, connectors, and other supporting structures. The dataset aggregates 11,664 annotated question instances from ChartQA, Circuit-VQA, InfographicsVQA, MapIQ, MapWise, and AI2D, with a released 2,445-instance human-verified test set and a standardized evaluation framework used to assess eight recent vision-language models on their ability to localize reasoning evidence across diagram domains.
What carries the argument
The evidence bounding box prediction task, in which models output regions in the diagram containing the visual information needed to support a given answer, serving as an indicator of whether reasoning is grounded in the diagram content.
If this is right
- Models that perform well must demonstrate localization of supporting visual elements rather than relying solely on answer accuracy.
- The standardized test set enables direct comparison of evidence-grounding ability across vision-language models and diagram types.
- Poor evidence localization despite correct answers reveals reliance on non-visual cues in existing systems.
- The annotations and framework support development of models that jointly predict answers and their visual justifications.
Where Pith is reading between the lines
- Performance gains on DRAGON could improve reliability in practical applications such as analyzing technical drawings or data visualizations.
- The bounding-box annotation method could be adapted to diagnose shortcut learning in other vision-language question answering domains.
- Integrating evidence prediction during training might reduce ungrounded or hallucinated explanations in diagram-based systems.
Load-bearing premise
That the human-annotated bounding boxes accurately and completely capture the visual evidence required to justify the answer, and that a model's ability to predict these boxes reliably indicates genuine evidence-grounded reasoning rather than other learned correlations.
What would settle it
A model that correctly predicts the ground-truth evidence bounding boxes yet produces unchanged answers when the diagram content inside those boxes is edited in ways that should alter the correct response.
Figures


read the original abstract
Diagram question answering (DQA) requires models to interpret structured visual representations such as charts, maps, infographics, circuit schematics, and scientific diagrams. Recent vision-language models (VLMs) often achieve high answer accuracy on these tasks, yet correct answers do not guarantee that models ground their reasoning in the diagram regions that support the prediction. Models may instead rely on textual correlations or dataset artifacts without identifying the visual evidence required to verify the answer. This limitation prevents reliable evaluation of diagram reasoning and reduces interpretability. We introduce DRAGON, a benchmark for evaluating evidence-grounded visual reasoning in diagrams. Given a diagram, a question, and the correct answer, a model must predict bounding boxes that correspond to the visual elements required to justify the answer. These evidence regions may include answer-bearing components, textual labels, legends, axes, connectors, and other supporting structures involved in the reasoning process. The DRAGON dataset contains 11,664 annotated question instances collected from six diagram QA datasets: ChartQA, Circuit-VQA, InfographicsVQA, MapIQ, MapWise, and AI2D. We release a 2,445-instance benchmark test set with human-verified reasoning evidence annotations and a standardized evaluation framework. We evaluate eight recent VLMs and analyze their ability to localize reasoning evidence across diverse diagram domains. DRAGON enables systematic evaluation of diagram reasoning and supports future research on models that ground their predictions in visual evidence.
Editorial analysis
A structured set of objections, weighed in public.
Referee Report
Summary. The paper introduces DRAGON, a benchmark for evidence-grounded visual reasoning over diagrams. It aggregates 11,664 question instances from six existing DQA datasets (ChartQA, Circuit-VQA, InfographicsVQA, MapIQ, MapWise, AI2D), augments them with human-annotated bounding boxes for the visual evidence required to justify answers, and releases a 2,445-instance test set with verified annotations plus a standardized evaluation framework. Eight recent VLMs are evaluated on localizing these evidence regions given the diagram, question, and correct answer.
Significance. If the evidence annotations prove reliable and complete, DRAGON would meaningfully advance DQA evaluation by distinguishing models that ground predictions in diagram structure from those relying on textual correlations or artifacts. The multi-domain coverage and public release of data and metrics support reproducibility and future work on interpretable visual reasoning.
major comments (3)
- [3] Section 3 (Dataset Construction): The process for collecting and verifying bounding-box annotations for reasoning evidence is described at a high level, but no inter-annotator agreement statistics (e.g., mean IoU or percentage overlap) or annotation guidelines are provided. This is load-bearing for the central claim, as the benchmark's validity rests on these boxes constituting the necessary and sufficient visual evidence.
- [5] Section 5 (Experiments and Analysis): Performance is reported for evidence-box prediction across VLMs and diagram types, yet no ablation, error analysis, or correlation study is included to test whether higher box-localization scores correspond to more grounded inference (e.g., by masking predicted regions and measuring answer degradation). Without this, the results do not rule out models exploiting annotation biases or dataset correlations rather than performing evidence-grounded reasoning.
- [4.1] Section 4.1 (Evaluation Framework): The protocol assumes a single set of ground-truth boxes per instance and uses standard localization metrics, but does not discuss or provide a mechanism for handling multiple valid evidence paths or incomplete annotations. This risks underestimating models that use alternative but correct visual evidence.
minor comments (3)
- The abstract states the test set contains 'human-verified' annotations; the main text should explicitly describe the verification procedure and any filtering criteria applied.
- Figure captions and example visualizations would benefit from clearer labeling of which boxes correspond to specific reasoning steps (e.g., answer-bearing elements vs. supporting structures).
- Ensure consistent citation of the six source datasets with their original publication details in the related-work or dataset section.
Simulated Author's Rebuttal
We thank the referee for the constructive and detailed feedback. We address each major comment point by point below, indicating planned revisions where appropriate. Our responses aim to clarify the manuscript's contributions while strengthening the presentation of the DRAGON benchmark.
read point-by-point responses
-
Referee: Section 3 (Dataset Construction): The process for collecting and verifying bounding-box annotations for reasoning evidence is described at a high level, but no inter-annotator agreement statistics (e.g., mean IoU or percentage overlap) or annotation guidelines are provided. This is load-bearing for the central claim, as the benchmark's validity rests on these boxes constituting the necessary and sufficient visual evidence.
Authors: We agree that the reliability of the evidence annotations is central to the benchmark's validity. The manuscript describes the aggregation from six source datasets and human verification for the test set at a high level in Section 3. To address this, we will revise Section 3 to include the detailed annotation guidelines used by annotators. We will also expand the description of the verification process applied to the 2,445-instance test set. Quantitative inter-annotator agreement statistics such as mean IoU were not computed during annotation; instead, annotations underwent cross-verification by multiple annotators. We will clarify this process and acknowledge the lack of formal IAA metrics as a limitation in the revised version. revision: partial
-
Referee: Section 5 (Experiments and Analysis): Performance is reported for evidence-box prediction across VLMs and diagram types, yet no ablation, error analysis, or correlation study is included to test whether higher box-localization scores correspond to more grounded inference (e.g., by masking predicted regions and measuring answer degradation). Without this, the results do not rule out models exploiting annotation biases or dataset correlations rather than performing evidence-grounded reasoning.
Authors: We acknowledge that the current results in Section 5 report localization performance but lack explicit ablations connecting these scores to grounded inference. The multi-domain evaluation already reveals substantial variation across VLMs, providing initial evidence of differing grounding abilities. In the revised manuscript, we will add an error analysis subsection with case studies of predictions and a correlation analysis between localization metrics and answer accuracy. A full masking ablation to measure answer degradation would require new experiments; we will discuss this approach and present preliminary insights from existing data while noting it as an avenue for future work. revision: partial
-
Referee: Section 4.1 (Evaluation Framework): The protocol assumes a single set of ground-truth boxes per instance and uses standard localization metrics, but does not discuss or provide a mechanism for handling multiple valid evidence paths or incomplete annotations. This risks underestimating models that use alternative but correct visual evidence.
Authors: We thank the referee for identifying this limitation in the evaluation protocol. The ground-truth boxes represent the necessary visual evidence regions identified by annotators for each instance, and standard metrics are applied for localization. We agree that alternative valid evidence paths may exist for some questions. In the revised Section 4.1, we will explicitly discuss this issue, note that the current annotations capture one valid set of evidence, and outline potential extensions such as multi-reference evaluation or relaxed matching for future benchmark iterations. revision: yes
- Quantitative inter-annotator agreement statistics (e.g., mean IoU or percentage overlap), as these were not collected during the original annotation process.
Circularity Check
No circularity in benchmark construction or evaluation
full rationale
The paper introduces DRAGON by aggregating 11,664 question instances from six pre-existing DQA datasets (ChartQA, Circuit-VQA, InfographicsVQA, MapIQ, MapWise, AI2D) and adding new human-verified bounding-box annotations for reasoning evidence. No mathematical derivations, parameter fitting, or first-principles claims appear; the central contribution is the independent annotation protocol and test-set release. No self-citations are invoked as load-bearing justifications for uniqueness or ansatzes, and no predictions reduce to fitted inputs by construction. The evaluation of eight VLMs is performed externally on the new annotations.
Axiom & Free-Parameter Ledger
axioms (1)
- domain assumption Human annotations of bounding boxes accurately identify the visual elements required to justify the correct answer
Reference graph
Works this paper leans on
-
[1]
InEuro- pean conference on computer vision, pages 235–251
A diagram is worth a dozen images. InEuro- pean conference on computer vision, pages 235–251. Springer. Junnan Li, Dongxu Li, Silvio Savarese, and Steven Hoi
-
[2]
InInternational conference on ma- chine learning, pages 19730–19742
Blip-2: Bootstrapping language-image pre- training with frozen image encoders and large lan- guage models. InInternational conference on ma- chine learning, pages 19730–19742. PMLR. Tsung-Yi Lin, Michael Maire, Serge Belongie, James Hays, Pietro Perona, Deva Ramanan, Piotr Dollár, and C Lawrence Zitnick. 2014. Microsoft coco: Common objects in context. In...
-
[3]
RISE: Randomized Input Sampling for Explanation of Black-box Models
Springer. Srija Mukhopadhyay, Abhishek Rajgaria, Prerana Khati- wada, Manish Shrivastava, Dan Roth, and Vivek Gupta. 2025. Mapwise: Evaluating vision-language models for advanced map queries. InProceedings of the 2025 Conference of the Nations of the Amer- icas Chapter of the Association for Computational Linguistics: Human Language Technologies (V olume ...
work page Pith review arXiv 2025
-
[4]
List each region sepa- rately
Answer Region(s)- visual areas that directly depict the answer (bars, slices, states, nodes, lines, components, map regions, etc.). List each region sepa- rately
-
[5]
Labels and Text- textual annotations, axis ticks, titles, or legend entries that name or quantify an answer region
-
[6]
Err on the side of includingmore elements rather than fewer
Context and Supporting Evidence- legends, color keys, axes, scale bars, arrows, connectors, or neighboring re- gions used for comparison or interpre- tation. Err on the side of includingmore elements rather than fewer. Input Question ID: {Question_ID} Ques- tion: {Question} Choices: {Choices} Answer: {Answer} Image metadata: {height}×{width} Output Format...
2048
-
[7]
They read the question carefully and identified all referenced visual elements in the diagram
-
[8]
They used the verified answer, and answer choices when available, to determine which regions were necessary to justify the answer
-
[9]
C.3 Annotation Policy We used a multi-annotator verification procedure to ensure reliability
They flagged ambiguous, inconsistent, or visu- ally unanswerable items for arbitration rather than guessing. C.3 Annotation Policy We used a multi-annotator verification procedure to ensure reliability
-
[10]
Two annotators independently reviewed each instance (six annotators participated overall)
-
[11]
A senior annotator resolved disagreements us- ing predefined arbitration guidelines
-
[12]
Chickadee - Maine State Bird
We retained only consensus or majority- agreed evidence annotations in the final dataset. C.4 Instructional Support We provided dataset-specific examples covering scientific diagrams, charts, maps, circuits, and in- fographics to illustrate reasoning-level evidence selection. We include representative qualitative examples in Appendix E. D Inter-Annotator ...
2019
discussion (0)
Sign in with ORCID, Apple, or X to comment. Anyone can read and Pith papers without signing in.