Recognition: unknown
Homogeneous Stellar Parameters from Heterogeneous Spectra with Deep Learning
Pith reviewed 2026-05-07 15:40 UTC · model grok-4.3
The pith
A Transformer model trained jointly on spectra from multiple surveys produces consistent stellar parameters, 20 chemical abundances, distances, and ages on one scale.
A machine-rendered reading of the paper's core claim, the machinery that carries it, and where it could break.
Core claim
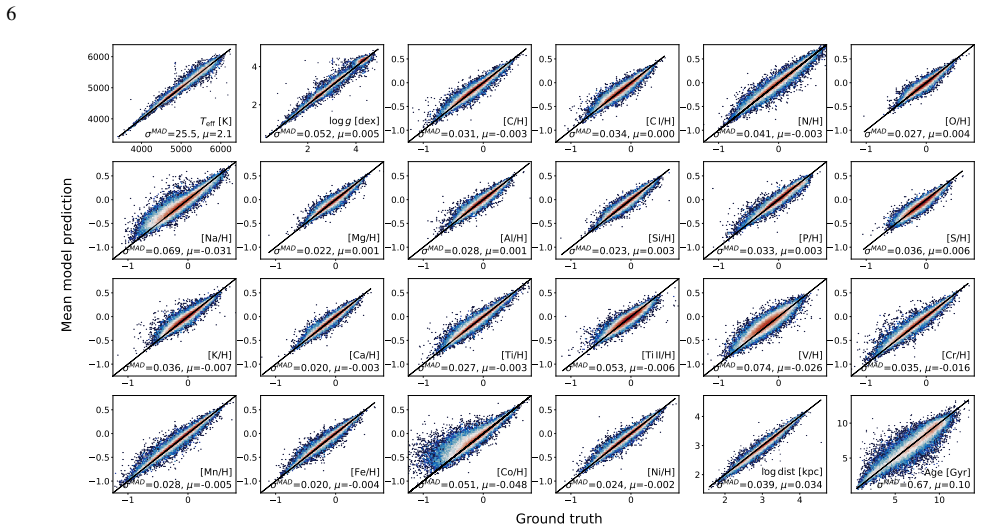
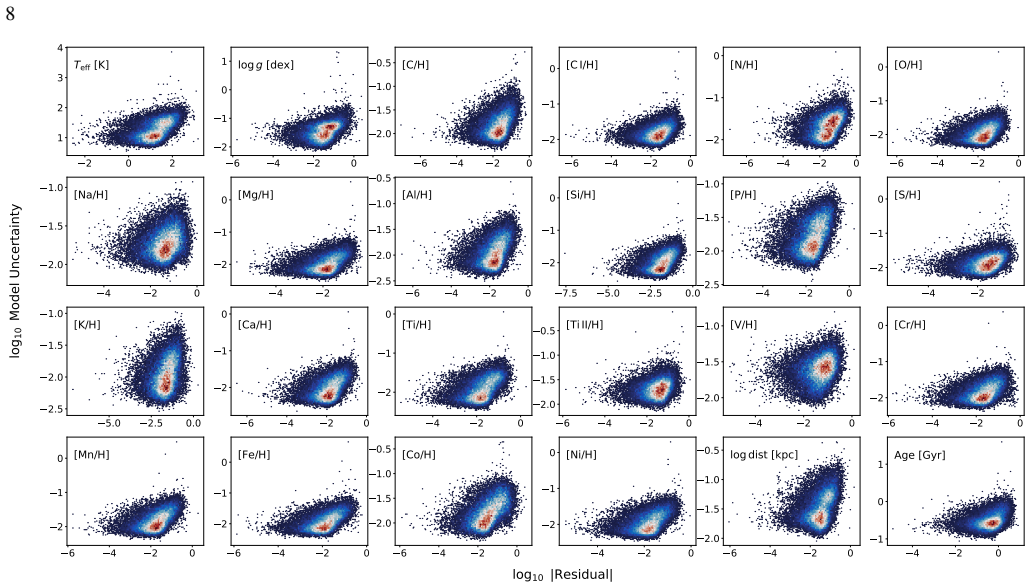
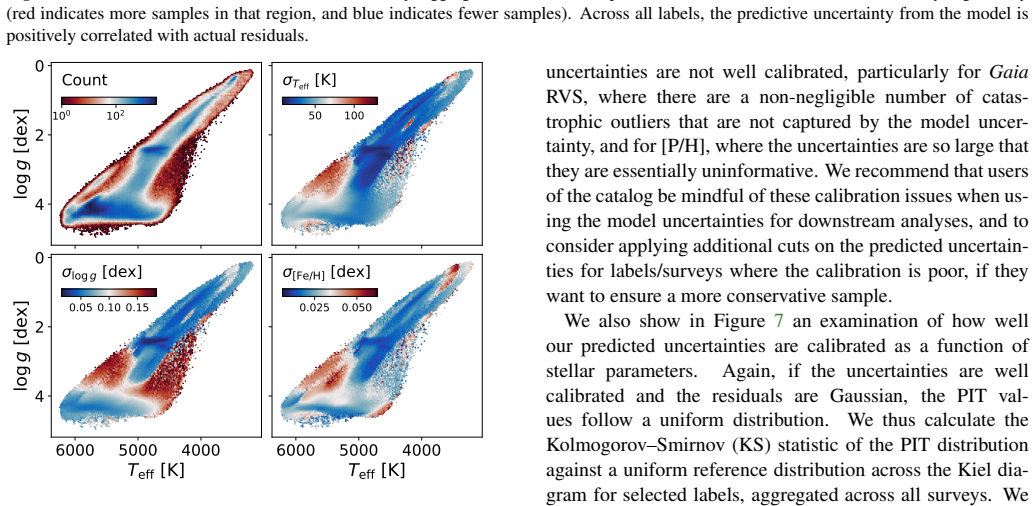
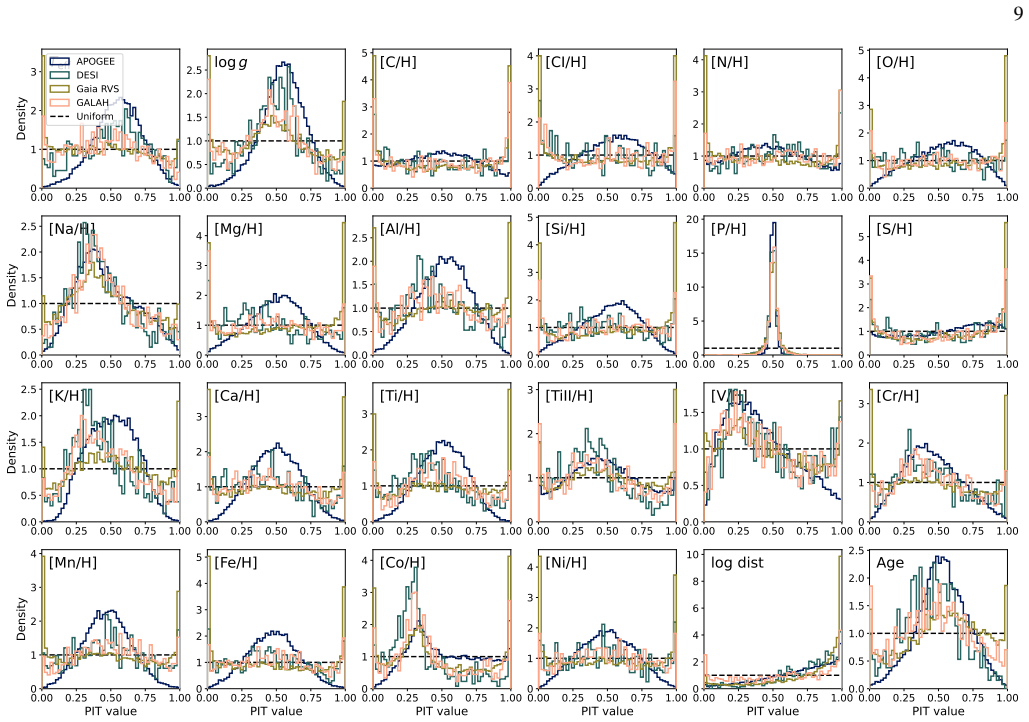
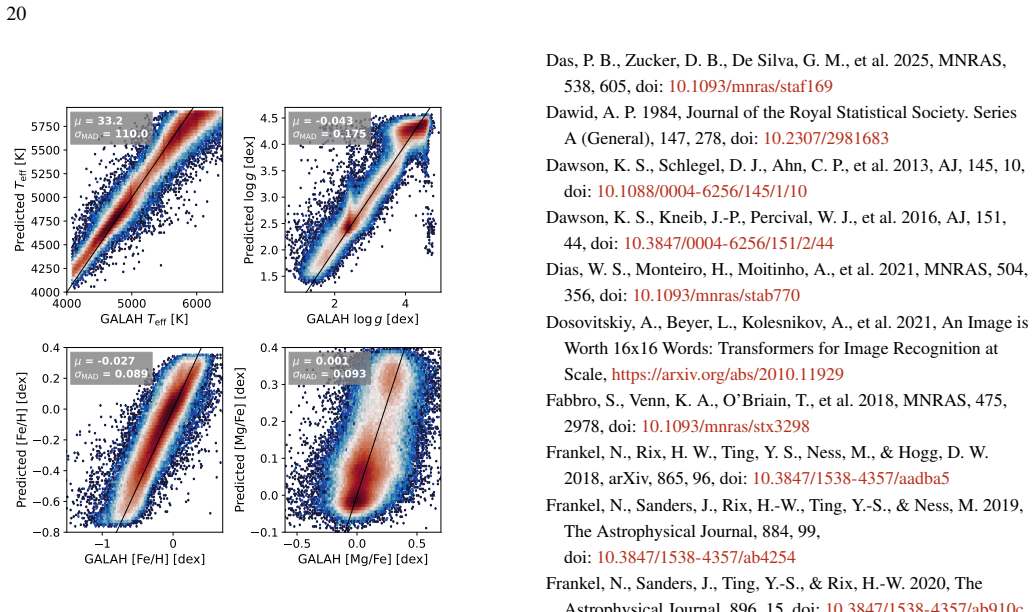
The authors introduce a unified deep-learning framework that employs a Transformer neural network to ingest stellar spectra of arbitrary wavelength coverage and spectral resolution. Trained as one end-to-end model on data from several surveys simultaneously, the network outputs effective temperature, surface gravity, iron abundance, abundances for twenty additional elements, distances, and ages, all placed on a single self-consistent scale without post-hoc recalibration. Results maintain consistency for the same stars observed across different surveys and match external validation sets such as distance catalogs and open-cluster properties.
What carries the argument
An end-to-end trained Transformer model that ingests spectra of arbitrary wavelength range and resolution and is trained jointly across heterogeneous surveys to enforce output consistency.
Load-bearing premise
That a single model trained on mixed survey data can remove all systematic differences between independent analysis pipelines while preserving true physical stellar properties and without adding new survey-specific biases.
What would settle it
If stars observed by more than one survey receive derived parameters that differ by amounts larger than the model's stated uncertainties, the claim of cross-survey homogeneity would be falsified.
Figures


read the original abstract
Large-scale spectroscopic surveys have collectively observed millions of stars across the Milky Way, but each derives stellar labels using independent pipelines with distinct modelling assumptions, introducing systematic offsets that obscure signals in chemical space and hinder large-scale Galactic archaeology. We present a unified deep-learning framework that delivers atmospheric parameters, chemical abundances for 20 elements, distances, and ages -- all on a single, self-consistent scale -- for an arbitrary number of spectroscopic surveys simultaneously. Our approach uses a Transformer model that ingests spectra of arbitrary wavelength range and resolution, trained end-to-end as a single model across all surveys, eliminating the need for post-hoc recalibration. We apply this framework to spectra from APOGEE DR17, GALAH DR3, DESI DR1, and $\textit{Gaia}$ RVS DR3, spanning resolutions from R ~ 2,000 to 28,000 and wavelengths from the optical to the near-infrared. On high-resolution APOGEE spectra the model achieves precisions of $18~$K in $\textrm{T}_{\rm eff}$, $0.04~$dex in $\textrm{log}\,\textit{g}$, $0.015~$dex in [Fe/H], and ${<}\,0.03~$dex across all abundances; on lower-resolution DESI spectra, typical precisions are $51~$K, $0.09~$dex, $0.04~$dex, and ${\sim}\,0.06~$dex, respectively. Cross-survey comparisons demonstrate that labels for the same stars observed by different surveys are consistent within model uncertainties; we further validate against external distance catalogs and open cluster metallicities and ages. The resulting homogeneous catalog enables Galactic archaeology at unprecedented scale and consistency, and the framework is readily extensible to forthcoming spectroscopic surveys such as SDSS-V, WEAVE, and 4MOST. The catalog is publicly available at https://doi.org/10.5281/zenodo.19830515.
Editorial analysis
A structured set of objections, weighed in public.
Referee Report
Summary. The manuscript claims to introduce a single end-to-end Transformer model trained jointly on spectra from APOGEE DR17, GALAH DR3, DESI DR1, and Gaia RVS DR3 that produces homogeneous stellar atmospheric parameters (Teff, log g, [Fe/H]), abundances for 20 elements, distances, and ages on one self-consistent scale. The model handles arbitrary wavelength ranges and resolutions, reports precisions such as 18 K in Teff, 0.04 dex in log g, and 0.015 dex in [Fe/H] on APOGEE data (with lower values on DESI), demonstrates cross-survey consistency for overlapping stars within uncertainties, and validates against external distance catalogs and open-cluster properties. The resulting catalog is released publicly.
Significance. If the central claim of true homogeneity holds, the work would be significant for Galactic archaeology by enabling large-scale, bias-free combination of spectroscopic data without post-hoc recalibrations. The flexible Transformer architecture and public catalog release are strengths that support extensibility to future surveys such as SDSS-V and WEAVE.
major comments (2)
- [Training procedure (abstract and methods)] The training procedure (described in the abstract and methods) uses pipeline-derived labels as supervision. For the thousands of multi-survey overlap stars, each spectrum supplies a different target vector, producing contradictory gradients in the loss. The abstract reports only that post-training predictions agree within model uncertainties; this shows convergence to a compromise but does not demonstrate that the compromise is closer to physical truth than the original pipelines or free of new survey-dependent residuals. No consistency regularizer, label pre-alignment, or multi-task invariance term is described, which is load-bearing for the homogeneity claim.
- [Results and validation sections] In the results and validation sections, the reported precisions (e.g., 18 K in Teff on APOGEE, 51 K on DESI) and cross-survey consistency are presented without explicit baseline comparisons to the individual survey pipelines or quantitative assessment of whether the unified model reduces systematic offsets relative to those pipelines. External validations against distance catalogs and open clusters are mentioned but lack details on error propagation and statistical tests for improvement, weakening support for the claim that the scale is demonstrably superior and homogeneous.
minor comments (2)
- [Abstract] The abstract would benefit from stating the total number of stars in the final catalog and the fraction of multi-survey overlaps to contextualize the scale of the homogeneity achievement.
- [Notation and figures] Notation for effective temperature (T_eff vs. Teff) and abundance brackets should be standardized throughout the text and figures for clarity.
Simulated Author's Rebuttal
We thank the referee for their insightful comments, which have helped clarify the presentation of our results. We address each major comment point by point below, with revisions indicated where we will strengthen the manuscript.
read point-by-point responses
-
Referee: The training procedure (described in the abstract and methods) uses pipeline-derived labels as supervision. For the thousands of multi-survey overlap stars, each spectrum supplies a different target vector, producing contradictory gradients in the loss. The abstract reports only that post-training predictions agree within model uncertainties; this shows convergence to a compromise but does not demonstrate that the compromise is closer to physical truth than the original pipelines or free of new survey-dependent residuals. No consistency regularizer, label pre-alignment, or multi-task invariance term is described, which is load-bearing for the homogeneity claim.
Authors: The single end-to-end Transformer is trained jointly across all surveys, allowing shared parameters to learn a common representation that reconciles spectral differences and label variations. For overlap stars the model produces predictions consistent within uncertainties, indicating that the optimization has identified a scale supported by the combined data rather than survey-specific artifacts. External validations against independent distance catalogs and open-cluster properties further support that this scale is physically meaningful. We did not add an explicit regularizer because the joint multi-survey training already enforces cross-survey invariance through the shared architecture. We will revise the methods section to include a dedicated discussion of the training dynamics, the role of overlap stars, and the limitations of relying on pipeline labels without additional regularization. revision: partial
-
Referee: In the results and validation sections, the reported precisions (e.g., 18 K in Teff on APOGEE, 51 K on DESI) and cross-survey consistency are presented without explicit baseline comparisons to the individual survey pipelines or quantitative assessment of whether the unified model reduces systematic offsets relative to those pipelines. External validations against distance catalogs and open clusters are mentioned but lack details on error propagation and statistical tests for improvement, weakening support for the claim that the scale is demonstrably superior and homogeneous.
Authors: We agree that explicit baseline comparisons and expanded validation details will strengthen the manuscript. In the revised version we will add quantitative comparisons of the unified model against the original pipeline labels for the same stars, including mean offsets and scatter reductions in the overlap samples. We will also expand the external-validation sections to describe uncertainty propagation from the model outputs to distances and ages, and include statistical tests (e.g., reduced chi-squared and Kolmogorov-Smirnov statistics) demonstrating improved consistency with open-cluster literature values relative to the individual pipelines. revision: yes
Circularity Check
No significant circularity detected
full rationale
The paper trains a single end-to-end Transformer on pipeline labels from APOGEE, GALAH, DESI, and Gaia RVS to produce a homogeneous catalog of stellar parameters. While supervision comes from the heterogeneous pipeline outputs, the central claims rest on the model's learned mapping from spectra to labels, with explicit cross-survey consistency checks and external validation against independent distance catalogs and open cluster metallicities/ages. No equation or step reduces the claimed self-consistent scale to the input labels by construction, nor does the derivation rely on self-citations, imported uniqueness theorems, or smuggled ansatzes. The framework is self-contained against external benchmarks.
Axiom & Free-Parameter Ledger
free parameters (2)
- Transformer architecture hyperparameters
- Training optimization parameters
axioms (1)
- domain assumption Spectra from different surveys contain overlapping information about the same underlying stellar physical properties despite differences in resolution and wavelength coverage.
Reference graph
Works this paper leans on
-
[1]
C., Hinneburg, A., & Keim, D
Aggarwal, C. C., Hinneburg, A., & Keim, D. A. 2001, in Proceedings of the 8th International Conference on Database
2001
-
[2]
2023, A&A, 678, A158, doi: 10.1051/0004-6361/202346666 Astropy Collaboration, Robitaille, T
Anders, F., Gispert, P., Ratcliffe, B., et al. 2023, A&A, 678, A158, doi: 10.1051/0004-6361/202346666 Astropy Collaboration, Robitaille, T. P., Tollerud, E. J., et al. 2013, A&A, 558, A33, doi: 10.1051/0004-6361/201322068 Astropy Collaboration, Price-Whelan, A. M., Sip˝ocz, B. M., et al. 2018, AJ, 156, 123, doi: 10.3847/1538-3881/aabc4f Astropy Collaborat...
-
[3]
Bensby, T., Feltzing, S., & Oey, M. S. 2014, A&A, 562, A71, doi: 10.1051/0004-6361/201322631
-
[4]
2025, A&A, 700, 160 doi: 10.1051/0004-6361/202555272
Berni, L., Spina, L., Magrini, L., et al. 2025, A&A, 700, A160, doi: 10.1051/0004-6361/202555272
-
[5]
2019, A&A, 623, A108, doi: 10.1051/0004-6361/201834693
Bossini, D., Vallenari, A., Bragaglia, A., et al. 2019, A&A, 623, A108, doi: 10.1051/0004-6361/201834693
-
[6]
THE CHEMICAL HOMOGENEITY OF OPEN CLUSTERS
Bovy, J. 2016, The Astrophysical Journal, 817, 49, doi: 10.3847/0004-637x/817/1/49
-
[7]
2021, MNRAS, 506, 150, doi: 10.1093/mnras/stab1242
Buder, S., Sharma, S., Kos, J., et al. 2021, Monthly Notices of the Royal Astronomical Society, 506, 150, doi: 10.1093/mnras/stab1242
-
[8]
Cantat-Gaudin, T., Jordi, C., Vallenari, A., et al. 2018, Astronomy & Astrophysics, 618, A93, doi: 10.1051/0004-6361/201833476
-
[9]
2019, A&A, 623, A80, doi: 10.1051/0004-6361/201834546
Carrera, R., Bragaglia, A., Cantat-Gaudin, T., et al. 2019, A&A, 623, A80, doi: 10.1051/0004-6361/201834546
-
[10]
Data Release 1 of the Dark Energy Spectroscopic Instrument
Collaboration, D., Karim, M. A., Adame, A. G., et al. 2026, Data Release 1 of the Dark Energy Spectroscopic Instrument, https://arxiv.org/abs/2503.14745
work page internal anchor Pith review arXiv 2026
-
[11]
Cooper, A. P., Koposov, S. E., Allende Prieto, C., et al. 2023, The Astrophysical Journal, 947, 37, doi: 10.3847/1538-4357/acb3c0
-
[12]
Das, P. B., Zucker, D. B., De Silva, G. M., et al. 2025, MNRAS, 538, 605, doi: 10.1093/mnras/staf169
-
[13]
Dawid, A. P. 1984, Journal of the Royal Statistical Society. Series A (General), 147, 278, doi: 10.2307/2981683
-
[14]
Dawson, K. S., Schlegel, D. J., Ahn, C. P., et al. 2013, AJ, 145, 10, doi: 10.1088/0004-6256/145/1/10
-
[15]
Dawson, K. S., Kneib, J.-P., Percival, W. J., et al. 2016, AJ, 151, 44, doi: 10.3847/0004-6256/151/2/44
-
[16]
Dias, W. S., Monteiro, H., Moitinho, A., et al. 2021, MNRAS, 504, 356, doi: 10.1093/mnras/stab770
-
[17]
An Image is Worth 16x16 Words: Transformers for Image Recognition at Scale
Dosovitskiy, A., Beyer, L., Kolesnikov, A., et al. 2021, An Image is Worth 16x16 Words: Transformers for Image Recognition at Scale, https://arxiv.org/abs/2010.11929
work page internal anchor Pith review arXiv 2021
-
[18]
Fabbro, S., Venn, K. A., O’Briain, T., et al. 2018, MNRAS, 475, 2978, doi: 10.1093/mnras/stx3298
-
[19]
Frankel, N., Rix, H. W., Ting, Y . S., Ness, M., & Hogg, D. W. 2018, arXiv, 865, 96, doi: 10.3847/1538-4357/aadba5
-
[20]
2019, The Astrophysical Journal, 884, 99, doi: 10.3847/1538-4357/ab4254
Frankel, N., Sanders, J., Rix, H.-W., Ting, Y .-S., & Ness, M. 2019, The Astrophysical Journal, 884, 99, doi: 10.3847/1538-4357/ab4254
-
[21]
2020, ApJ, 896, 15, doi: 10.3847/1538-4357/ab910c
Frankel, N., Sanders, J., Ting, Y .-S., & Rix, H.-W. 2020, The Astrophysical Journal, 896, 15, doi: 10.3847/1538-4357/ab910c
-
[22]
Freeman, K., & Bland-Hawthorn, J. 2002, ARA&A, 40, 487, doi: 10.1146/annurev.astro.40.060401.093840 Gaia Collaboration, Vallenari, A., Brown, A. G. A., et al. 2023, A&A, 674, A1, doi: 10.1051/0004-6361/202243940
-
[23]
Gal, Y ., & Ghahramani, Z. 2016, Dropout as a Bayesian Approximation: Representing Model Uncertainty in Deep Learning, https://arxiv.org/abs/1506.02142
-
[24]
Gneiting, T., Balabdaoui, F., & Raftery, A. E. 2007, Journal of the Royal Statistical Society Series B: Statistical Methodology, 69, 243–268, doi: 10.1111/j.1467-9868.2007.00587.x
-
[25]
Gou, J., Yu, B., Maybank, S. J., & Tao, D. 2021, International Journal of Computer Vision, 129, 1789–1819, doi: 10.1007/s11263-021-01453-z
-
[26]
2024, A&A, 682, A9, doi: 10.1051/0004-6361/202347122
Guiglion, G., Nepal, S., Chiappini, C., et al. 2024, A&A, 682, A9, doi: 10.1051/0004-6361/202347122
-
[27]
Harris, C. R., Millman, K. J., van der Walt, S. J., et al. 2020, Nature, 585, 357, doi: 10.1038/s41586-020-2649-2
-
[28]
Hayden, M. R., Bovy, J., Holtzman, J. A., et al. 2015, ApJ, 808, 132, doi: 10.1088/0004-637X/808/2/132
-
[29]
2014, A&A, 561, A93, doi: 10.1051/0004-6361/201322559
Heiter, U., Soubiran, C., Netopil, M., & Paunzen, E. 2014, A&A, 561, A93, doi: 10.1051/0004-6361/201322559
-
[30]
Helmi, A., Babusiaux, C., Koppelman, H. H., et al. 2018, Nature, 563, 85, doi: 10.1038/s41586-018-0625-x
-
[31]
Henry, A., Dachapally, P. R., Pawar, S., & Chen, Y . 2020, Query-Key Normalization for Transformers, https://arxiv.org/abs/2010.04245
-
[32]
Distilling the Knowledge in a Neural Network
Hinton, G., Vinyals, O., & Dean, J. 2015, Distilling the Knowledge in a Neural Network, https://arxiv.org/abs/1503.02531 21
work page internal anchor Pith review arXiv 2015
-
[33]
Ho, A. Y . Q., Rix, H.-W., Ness, M. K., et al. 2017a, ApJ, 841, 40, doi: 10.3847/1538-4357/aa6db3
-
[34]
Ho, A. Y . Q., Ness, M. K., Hogg, D. W., et al. 2017b, ApJ, 836, 5, doi: 10.3847/1538-4357/836/1/5
-
[35]
W., Eilers, A.-C., & Rix, H.-W
Hogg, D. W., Eilers, A.-C., & Rix, H.-W. 2019, The Astronomical Journal, 158, 147, doi: 10.3847/1538-3881/ab398c
-
[36]
Hunter, J. D. 2007, Computing in Science & Engineering, 9, 90, doi: 10.1109/MCSE.2007.55 Jofré, P., Heiter, U., & Soubiran, C. 2019, ARA&A, 57, 571, doi: 10.1146/annurev-astro-091918-104509
-
[37]
Lee, K., Lee, K., Lee, H., & Shin, J. 2018, A Simple Unified Framework for Detecting Out-of-Distribution Samples and Adversarial Attacks, https://arxiv.org/abs/1807.03888
-
[38]
Leung, H. W., & Bovy, J. 2018, Monthly Notices of the Royal Astronomical Society, doi: 10.1093/mnras/sty3217
-
[39]
Leung, H. W., & Bovy, J. 2023, Monthly Notices of the Royal Astronomical Society, 527, 1494–1520, doi: 10.1093/mnras/stad3015
-
[40]
Leung, H. W., Bovy, J., Mackereth, J. T., & Miglio, A. 2023, Monthly Notices of the Royal Astronomical Society, 522, 4577–4597, doi: 10.1093/mnras/stad1272
-
[41]
Li, S., Wang, W., Koposov, S. E., et al. 2025, AJ, 170, 171, doi: 10.3847/1538-3881/adf1a0
-
[42]
2022, Monthly Notices of the Royal Astronomical Society, 511, 5639–5655, doi: 10.1093/mnras/stac479
Lian, J., Zasowski, G., Hasselquist, S., et al. 2022, Monthly Notices of the Royal Astronomical Society, 511, 5639–5655, doi: 10.1093/mnras/stac479
-
[43]
2023, Outlier Detection in the DESI Bright Galaxy Survey, https://arxiv.org/abs/2307.07664
Liang, Y ., Melchior, P., Hahn, C., et al. 2023, Outlier Detection in the DESI Bright Galaxy Survey, https://arxiv.org/abs/2307.07664
-
[44]
Liu, F. T., Ting, K. M., & Zhou, Z.-H. 2008, in 2008 Eighth IEEE International Conference on Data Mining, 413–422, doi: 10.1109/ICDM.2008.17
-
[45]
Dynamical heating across the Milky Way disc using APOGEE andGaia,
Mackereth, J. T., Bovy, J., Leung, H. W., et al. 2019, Monthly Notices of the Royal Astronomical Society, 489, 176, doi: 10.1093/mnras/stz1521
-
[46]
Majewski, S. R., Schiavon, R. P., Frinchaboy, P. M., et al. 2017, The Astronomical Journal, 154, 94, doi: 10.3847/1538-3881/aa784d
- [47]
-
[48]
Nandakumar, G., Hayden, M. R., Sharma, S., et al. 2022, MNRAS, 513, 232, doi: 10.1093/mnras/stac873
-
[49]
2015, ApJ, 808, 16, doi: 10.1088/0004-637X/808/1/16 O’Briain, T., Ting, Y.-S., Fabbro, S., et al
Ness, M., Hogg, D. W., Rix, H. W., Ho, A. Y ., & Zasowski, G. 2015, Astrophysical Journal, 808, 16, doi: 10.1088/0004-637X/808/1/16 O’Briain, T., Ting, Y .-S., Fabbro, S., et al. 2021, ApJ, 906, 130, doi: 10.3847/1538-4357/abca96
-
[50]
Pace, W., She, C., Xu, L., et al. 2025, Lance: Efficient Random Access in Columnar Storage through Adaptive Structural Encodings, https://arxiv.org/abs/2504.15247
-
[51]
Parker, L., Lanusse, F., Shen, J., et al. 2025, arXiv e-prints, arXiv:2510.17960, doi: 10.48550/arXiv.2510.17960
-
[52]
PyTorch: An Imperative Style, High-Performance Deep Learning Library
Paszke, A., Gross, S., Massa, F., et al. 2019, PyTorch: An Imperative Style, High-Performance Deep Learning Library, https://arxiv.org/abs/1912.01703
work page internal anchor Pith review arXiv 2019
-
[53]
2011, Journal of Machine Learning Research, 12, 2825
Pedregosa, F., Varoquaux, G., Gramfort, A., et al. 2011, Journal of Machine Learning Research, 12, 2825
2011
-
[54]
Pinsonneault, M. H., Elsworth, Y . P., Tayar, J., et al. 2018, The Astrophysical Journal Supplement Series, 239, 32, doi: 10.3847/1538-4365/aaebfd
-
[55]
Piskunov, N., & Valenti, J. A. 2017, A&A, 597, A16, doi: 10.1051/0004-6361/201629124
-
[56]
Queiroz, A. B. A., Anders, F., Chiappini, C., et al. 2023, A&A, 673, A155, doi: 10.1051/0004-6361/202245399
-
[57]
Raasveldt, M., & Mühleisen, H. 2019, in Proceedings of the 2019 International Conference on Management of Data, SIGMOD ’19 (New York, NY , USA: Association for Computing Machinery), 1981–1984, doi: 10.1145/3299869.3320212
-
[58]
Recio-Blanco, A., de Laverny, P., Palicio, P. A., et al. 2023, A&A, 674, A29, doi: 10.1051/0004-6361/202243750
-
[59]
Sandford, N. R., Weisz, D. R., & Ting, Y .-S. 2020, The Astrophysical Journal Supplement Series, 249, 24, doi: 10.3847/1538-4365/ab9cb0
-
[60]
DistilBERT, a distilled version of BERT: smaller, faster, cheaper and lighter
Sanh, V ., Debut, L., Chaumond, J., & Wolf, T. 2020, DistilBERT, a distilled version of BERT: smaller, faster, cheaper and lighter, https://arxiv.org/abs/1910.01108
work page internal anchor Pith review arXiv 2020
-
[61]
GLU Variants Improve Transformer
Shazeer, N. 2020, GLU Variants Improve Transformer, https://arxiv.org/abs/2002.05202
work page internal anchor Pith review arXiv 2020
-
[62]
2026, homogeneous_stellar_parameters, Zenodo, doi: 10.5281/ZENODO.19830516
Shen, J. 2026, homogeneous_stellar_parameters, Zenodo, doi: 10.5281/ZENODO.19830516
-
[63]
2023, Multiscale Feature Attribution for Outliers, https://arxiv.org/abs/2310.20012
Shen, J., & Melchior, P. 2023, Multiscale Feature Attribution for Outliers, https://arxiv.org/abs/2310.20012
-
[64]
Shen, J., Speagle, J. S., Mackereth, J. T., Ting, Y .-S., & Bovy, J. 2024, ApJ, 960, 84, doi: 10.3847/1538-4357/ad0559
-
[65]
Universal spectral tokenization via self-supervised panchromatic representation learning, 2025
Shen, J., Lanusse, F., Holden Parker, L., et al. 2025, arXiv e-prints, arXiv:2510.17959, doi: 10.48550/arXiv.2510.17959
-
[66]
Deep Inside Convolutional Networks: Visualising Image Classification Models and Saliency Maps
Simonyan, K., Vedaldi, A., & Zisserman, A. 2014, Deep Inside Convolutional Networks: Visualising Image Classification Models and Saliency Maps, https://arxiv.org/abs/1312.6034
work page internal anchor Pith review arXiv 2014
-
[67]
Smilkov, D., Thorat, N., Kim, B., Viégas, F., & Wattenberg, M. 2017, SmoothGrad: removing noise by adding noise, https://arxiv.org/abs/1706.03825
-
[68]
Spina, L., Ting, Y .-S., De Silva, G. M., et al. 2021, MNRAS, 503, 3279, doi: 10.1093/mnras/stab471
-
[69]
RoFormer: Enhanced Transformer with Rotary Position Embedding
Su, J., Lu, Y ., Pan, S., et al. 2023, RoFormer: Enhanced Transformer with Rotary Position Embedding, https://arxiv.org/abs/2104.09864 22
work page internal anchor Pith review arXiv 2023
-
[70]
Axiomatic Attribution for Deep Networks, June 2017
Sundararajan, M., Taly, A., & Yan, Q. 2017, Axiomatic Attribution for Deep Networks, https://arxiv.org/abs/1703.01365
-
[71]
2021, Understanding and Improving Knowledge Distillation, https://arxiv.org/abs/2002.03532
Tang, J., Shivanna, R., Zhao, Z., et al. 2021, Understanding and Improving Knowledge Distillation, https://arxiv.org/abs/2002.03532
-
[72]
2021, A&A, 647, A19, doi: 10.1051/0004-6361/202039388
Tarricq, Y ., Soubiran, C., Casamiquela, L., et al. 2021, A&A, 647, A19, doi: 10.1051/0004-6361/202039388
-
[73]
Gemma 2: Improving Open Language Models at a Practical Size
Team, G., Riviere, M., Pathak, S., et al. 2024, Gemma 2: Improving Open Language Models at a Practical Size, https://arxiv.org/abs/2408.00118
work page internal anchor Pith review arXiv 2024
-
[74]
DiMarco, S. F. 2016, Oceanography, 29, doi: 10.5670/oceanog.2016.66
-
[75]
2017, ApJ, 843, 32, doi: 10.3847/1538-4357/aa7688
Ting, Y .-S., Conroy, C., Rix, H.-W., & Cargile, P. 2017, ApJ, 843, 32, doi: 10.3847/1538-4357/aa7688
-
[76]
2022, A&A, 659, A95, doi: 10.1051/0004-6361/202141702
Tsantaki, M., Pancino, E., Marrese, P., et al. 2022, A&A, 659, A95, doi: 10.1051/0004-6361/202141702
-
[77]
2025, A&A, 700, A195, doi: 10.1051/0004-6361/202555695
Turchi, A., Pancino, E., Avdeeva, A., et al. 2025, A&A, 700, A195, doi: 10.1051/0004-6361/202555695
-
[78]
Vaswani, A., Shazeer, N., Parmar, N., et al. 2017, Attention Is All You Need, arXiv. http://arxiv.org/abs/1706.03762
work page internal anchor Pith review arXiv 2017
-
[79]
2020, ApJ, 898, 58, doi: 10.3847/1538-4357/ab9a46
Wheeler, A., Ness, M., Buder, S., et al. 2020, ApJ, 898, 58, doi: 10.3847/1538-4357/ab9a46
-
[80]
Yanny, B., Rockosi, C., Newberg, H. J., et al. 2009, AJ, 137, 4377, doi: 10.1088/0004-6256/137/5/4377
discussion (0)
Sign in with ORCID, Apple, or X to comment. Anyone can read and Pith papers without signing in.