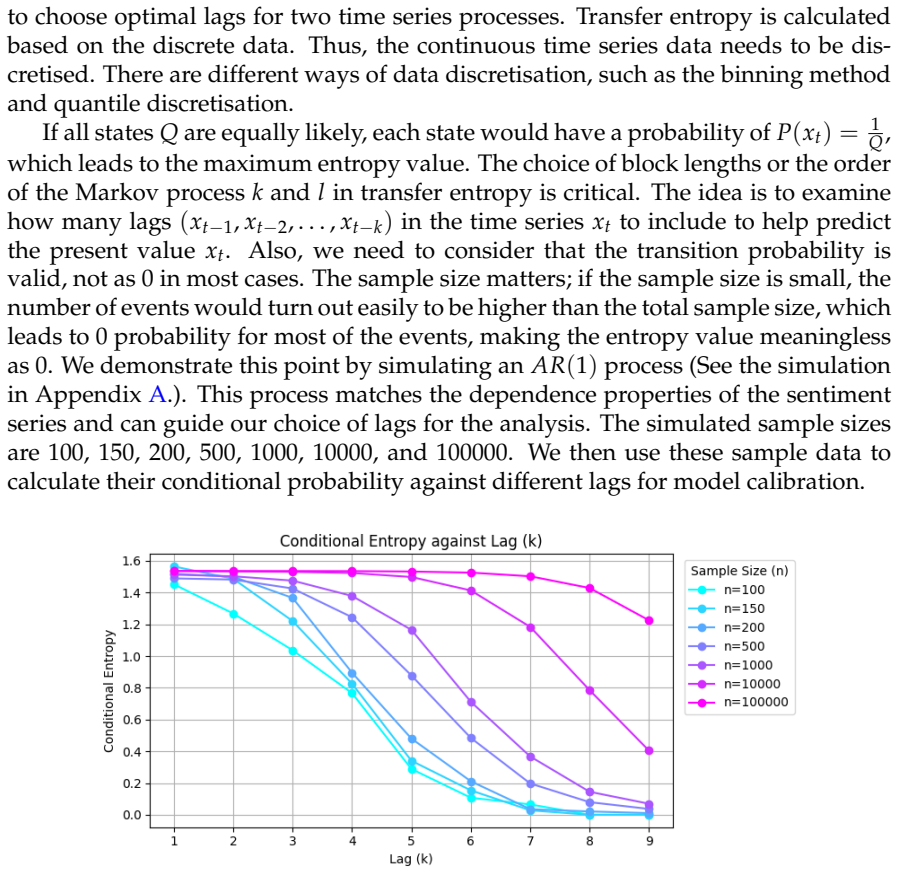
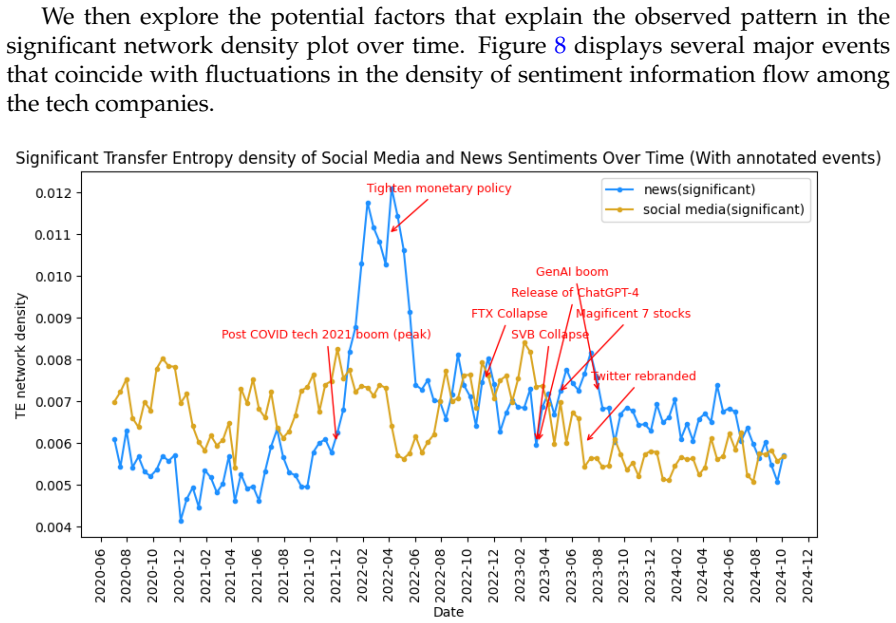
Recognition: unknown
Do News and Social Media Tell the Same Story? Constructing and Comparing Sentiment Spillover Networks
Pith reviewed 2026-05-08 03:16 UTC · model grok-4.3
The pith
News and social media produce different sentiment spillover networks for tech companies, with news flows intensifying after COVID-19.
A machine-rendered reading of the paper's core claim, the machinery that carries it, and where it could break.
Core claim
The sentiment spillover networks constructed from news and social media sentiment scores using transfer entropy reveal distinct information transmission patterns. News exhibits stronger intensity of flows among technology companies following COVID-19. Certain companies emerge as information hubs, and specific chains show the strongest directed flows, demonstrating that the two media sources do not tell the same story in terms of sentiment propagation.
What carries the argument
Transfer entropy applied to sentiment time series to construct directed networks where edge weights represent the strength of sentiment information spillover from one company to another.
Load-bearing premise
The extracted sentiment scores from news and social media truly represent underlying investor attitudes, and the transfer entropy calculations capture genuine directed information flows without being dominated by external market factors or noise.
What would settle it
A replication showing that post-COVID news transfer entropy values are not higher than pre-COVID levels, or that the network topologies for news and social media are statistically indistinguishable.
Figures


read the original abstract
Investor sentiment reflects the collective attitude of investors towards the asset, whether positive, negative or neutral. Market information, such as news and relevant social media posts, plays a significant role in shaping investor sentiment, which influences investment decisions accordingly. The sentiment for one single company may spill over to other relevant companies which are in the same industry. The information spillover network pattern between news and social media may also differ, as they are two different media sources. In this study, we introduce a network-based transfer entropy method to measure and compare the information transmission of news and social media sentiment across the technology companies. We examine whether and to what extent sentiment information from one company can transfer to other companies, and how different the spillover effect is for news and social media. The result signifies a stronger intensity of news information flow among the tech companies after COVID-19. We also highlight the companies which act as information hubs in the sentiment network. Furthermore, we identify the companies which lead the strongest information flow chain. Overall, this study provides a novel perspective in modelling sentiment spillover under two different media sources, and we find that news and social media show a different information transmission pattern during the studied period.
Editorial analysis
A structured set of objections, weighed in public.
Referee Report
Summary. The manuscript introduces a network-based transfer entropy method to quantify and compare sentiment spillover between news and social media for technology companies. It claims that news-based sentiment exhibits stronger information-flow intensity among these firms after COVID-19, identifies information hubs and leading chains in the networks, and concludes that the two media sources display distinct transmission patterns.
Significance. If the empirical claims survive controls for common shocks and appropriate statistical validation, the work would supply a useful comparative lens on how news versus social-media sentiment diffuses across firms, with potential relevance for understanding post-crisis information dynamics in the technology sector.
major comments (2)
- [§3] §3 (Transfer Entropy Construction): transfer entropy is computed directly on raw sentiment scores without conditioning on a market factor, orthogonalization, or surrogate-data tests. Because COVID-era market-wide shocks are likely to induce spurious directed links, this choice is load-bearing for the reported increase in post-COVID news-flow intensity and for the identified hub structure.
- [§4] §4 (Pre-/Post-COVID Comparison): the claim of stronger news information flow after COVID-19 is presented without sample sizes, number of observations, statistical tests on the intensity difference, or robustness checks against alternative sentiment lexicons or window lengths. These omissions leave the central empirical result without visible quantitative support.
minor comments (2)
- [Abstract] The abstract omits any mention of the number of companies, the exact sample period, or the sentiment-extraction method; adding these details would improve readability.
- [Figures] Network figures would benefit from explicit legends for node size (degree or strength) and edge thickness (transfer-entropy magnitude).
Simulated Author's Rebuttal
We thank the referee for the constructive comments, which highlight important methodological and empirical considerations. We address each major point below and indicate the revisions we will make to strengthen the manuscript.
read point-by-point responses
-
Referee: [§3] §3 (Transfer Entropy Construction): transfer entropy is computed directly on raw sentiment scores without conditioning on a market factor, orthogonalization, or surrogate-data tests. Because COVID-era market-wide shocks are likely to induce spurious directed links, this choice is load-bearing for the reported increase in post-COVID news-flow intensity and for the identified hub structure.
Authors: We agree that common market-wide shocks during the COVID period could induce spurious directed links in transfer entropy estimates applied to raw sentiment series. The original analysis computed transfer entropy directly on the sentiment scores to capture nonlinear information flows without imposing linearity assumptions. To address this concern, we will revise the manuscript to include orthogonalization to a market factor and surrogate-data tests for statistical validation of the directed links. These additions will provide stronger support for the post-COVID news-flow intensity results and hub identification. revision: yes
-
Referee: [§4] §4 (Pre-/Post-COVID Comparison): the claim of stronger news information flow after COVID-19 is presented without sample sizes, number of observations, statistical tests on the intensity difference, or robustness checks against alternative sentiment lexicons or window lengths. These omissions leave the central empirical result without visible quantitative support.
Authors: We acknowledge that the pre-/post-COVID comparison would benefit from explicit quantitative details. The manuscript reports comparative network metrics, but does not include sample sizes, formal statistical tests on intensity differences, or robustness checks. In the revised version, we will add the number of observations per period, statistical tests (e.g., permutation-based tests for transfer entropy differences), and sensitivity analyses using alternative sentiment lexicons and window lengths to provide the necessary quantitative support for the central empirical claim. revision: yes
Circularity Check
No significant circularity; results derived from external data and standard transfer entropy
full rationale
The paper extracts sentiment scores from independent news and social media corpora, computes transfer entropy between company-level time series to build spillover networks, and contrasts pre- versus post-COVID periods. These operations rely on external textual data and an established information-theoretic measure; the reported stronger news-flow intensity and hub identification emerge directly from the empirical computation rather than being presupposed by definition, fitted parameters renamed as predictions, or load-bearing self-citations. No equation or claim reduces to its own inputs by construction.
Axiom & Free-Parameter Ledger
Reference graph
Works this paper leans on
-
[1]
Antonakakis, N., Chatziantoniou, I., and Gabauer, D. (2020). Refined Measures of Dynamic Connectedness based on Time-Varying Parameter Vector Autoregressions.Journal of Risk and Financial Management, 13(4):84. Audrino, F. and Tetereva, A. (2019). Sentiment spillover effects for US and European compa- nies.Journal of Banking and Finance, 106:542 –
2020
-
[2]
and Wurgler, J
Baker, M. and Wurgler, J. (2006). Investor Sentiment and the Cross-Section of Stock Returns. The Journal of Finance, 61(4):1645–1680. Baker, M. and Wurgler, J. (2007). Investor Sentiment in the Stock Market.Journal of Economic Perspectives, 21(2):129–152. Baker, M., Wurgler, J., and Yuan, Y. (2012). Global, local, and contagious investor sentiment. Journa...
2006
-
[3]
Bollen, J., Mao, H., and Zeng, X
Accessed: 2026-04-23. Bollen, J., Mao, H., and Zeng, X. (2011). Twitter mood predicts the stock market.Journal of Computational Science, 2(1):1–8. Bouteska, A., Ha, L. T., Bhuiyan, F., Sharif, T., and Abedin, M. Z. (2024). Contagion between investor sentiment and green bonds in China during the global uncertainties.International Review of Economics & Fina...
2026
-
[4]
Cui, X., Lam, D., and Verma, A
Accessed: 2026-04-23. Cui, X., Lam, D., and Verma, A. (2016). Embedded value in bloomberg news and social sentiment data.Bloomberg LP. Da, Z., Engelberg, J., and Gao, P . (2011). In Search of Attention.The Journal of Finance, 66(5):1461–1499. Dash, S. R. and Maitra, D. (2019). The relationship between emerging and developed market sentiment: A wavelet-bas...
2026
-
[5]
Diebold, F. X. and Yilmaz, K. (2012). Better to give than to receive: Predictive directional measurement of volatility spillovers.International Journal of Forecasting, 28(1):57–66. Diebold, F. X. and Yilmaz, K. (2014). On the network topology of variance decompositions: Measuring the connectedness of financial firms.Journal of Econometrics, 182(1):119–134...
2012
-
[6]
43 Gan, B., Alexeev, V ., Bird, R., and Yeung, D
Accessed: 2026-04-23. 43 Gan, B., Alexeev, V ., Bird, R., and Yeung, D. (2020). Sensitivity to sentiment: News vs social media.International Review of Financial Analysis, 67:101390. Gao, Y. and Zhao, C. (2023). Investor sentiment and stock price jumps: A network analysis based on China’s carbonneutral sectors.North American Journal of Economics and Finance,
2026
-
[7]
Garcia Alvarado, F. (2022). Detecting crisis vulnerability using yield spread interconnected- ness.International Journal of Finance and Economics, 27(4):3864–3880. Garca, D. (2013). Sentiment during Recessions.The Journal of Finance, 68(3):1267–1300. Gong, X.-L., Liu, J.-M., Xiong, X., and Zhang, W. (2022). Research on stock volatility risk and investor s...
2022
-
[8]
and Kurov, A
Gu, C. and Kurov, A. (2020). Informational role of social media: Evidence from Twitter sentiment.Journal of Banking & Finance, 121:105969. Han, M. and Zhou, J. (2022). Multi-Scale Characteristics of Investor Sentiment Transmission Based on Wavelet, Transfer Entropy and Network Analysis.Entropy, 24(12):1786. He, J. and Shang, P . (2017). Comparison of tran...
2020
-
[9]
Jaccard, P
Accessed: 2026-04-23. Jaccard, P . (1901).´Etude comparative de la distribution florale dans une portion des alpes et des jura.Bull Soc Vaudoise Sci Nat, 37:547–579. Jack, E. (1967). Optimum branchings.Journal of Research of the National Bureau of Standards, B 71:233–240. 44 Jiang, C., Sun, Q., Ye, T., and Wang, Q. (2023). Identification of systemically i...
2026
-
[10]
Jiao, P ., Veiga, A., and Walther, A. (2020). Social media, news media and the stock market. Journal of Economic Behavior & Organization, 176:63–90. Keynes, J. M. (1936).The general theory of employment interest and money. Macmillan, London. Kwon, O. and Yang, J.-S. (2008). Information flow between stock indices.Europhysics Letters, 82(6):68003. Lee, S. (...
2020
-
[11]
Mbarki, I., Omri, A., and Naeem, M. A. (2022). From sentiment to systemic risk: Information transmission in Asia-Pacific stock markets.Research in International Business and Finance,
2022
-
[12]
The new digital edge: Rethinking strategy for the postpan- demic era
McKinsey & Company (2021). The new digital edge: Rethinking strategy for the postpan- demic era. Published: 26 May
2021
-
[13]
Mensi, W., Gubareva, M., Teplova, T., and Kang, S
Accessed: 2026-04-23. Mensi, W., Gubareva, M., Teplova, T., and Kang, S. (2023). Spillover and connectedness among G7 real estate investment trusts: The effects of investor sentiment and global fac- tors.North American Journal of Economics and Finance,
2026
-
[14]
A., Senthilkumar, A., Arfaoui, N., and Mohnot, R
Naeem, M. A., Senthilkumar, A., Arfaoui, N., and Mohnot, R. (2024). Mapping fear in fi- nancial markets: Insights from dynamic networks and centrality measures.Pacific Basin Finance Journal,
2024
-
[15]
Trusting the magnificent seven stocks
Nasdaq (2023). Trusting the magnificent seven stocks. Published: 14 November
2023
-
[16]
Ac- cessed: 2026-04-23. Neto, D. (2022). Examining interconnectedness between media attention and cryptocurrency markets: A transfer entropy story.Economics Letters, 214:110460. 45 Nit ¸oi, M. and Pochea, M. M. (2020). Time-varying dependence in european equity markets: A contagion and investor sentiment driven analysis.Economic Modelling, 86:133–147. Nya...
2026
-
[17]
Shannon, C. E. (1948). A Mathematical Theory of Communication.Bell System Technical Journal, 27(3):379–423. Shiller, R. J. (2019).Narrative Economics: How Stories Go Viral and Drive Major Economic Events. Princeton University Press. Song, Y., Ji, Q., Du, Y.-J., and Geng, J.-B. (2019). The dynamic dependence of fossil energy, investor sentiment and renewab...
1948
-
[18]
Tantardini, M., Ieva, F., Tajoli, L., and Piccardi, C. (2019). Comparing methods for comparing networks.Scientific Reports, 9(1):17557. 46 Tetlock, P . C. (2007). Giving Content to Investor Sentiment: The Role of Media in the Stock Market.The Journal of Finance, 62(3):1139–1168. Wan, X., Yang, J., Marinov, S., Calliess, J.-P ., Zohren, S., and Dong, X. (2...
2019
-
[19]
Wu, F., Liu, A., Chen, J., and Li, Y. (2024). Analysing Network Dynamics: The Contagion Effects of SVBs Collapse on the US Tech Industry.Journal of Risk and Financial Management, 17(10):427. Wu, F., Zhao, W.-L., Ji, Q., and Zhang, D. (2020). Dependency, centrality and dynamic net- works for international commodity futures prices.International Review of Ec...
2024
-
[20]
Zhou, L., Chen, D., and Huang, J. (2023). Stock-level sentiment contagion and the cross- section of stock returns.The North American Journal of Economics and Finance, 68:101966. 47
2023
discussion (0)
Sign in with ORCID, Apple, or X to comment. Anyone can read and Pith papers without signing in.