Recognition: unknown
The Likelihood Ratio Wall: Structural Limits on Accurate Risk Assessment for Rare Violence
Pith reviewed 2026-05-07 08:04 UTC · model grok-4.3
The pith
Low base rates for violent re-offense create a hard precision limit that current risk tools cannot cross.
A machine-rendered reading of the paper's core claim, the machinery that carries it, and where it could break.
Core claim
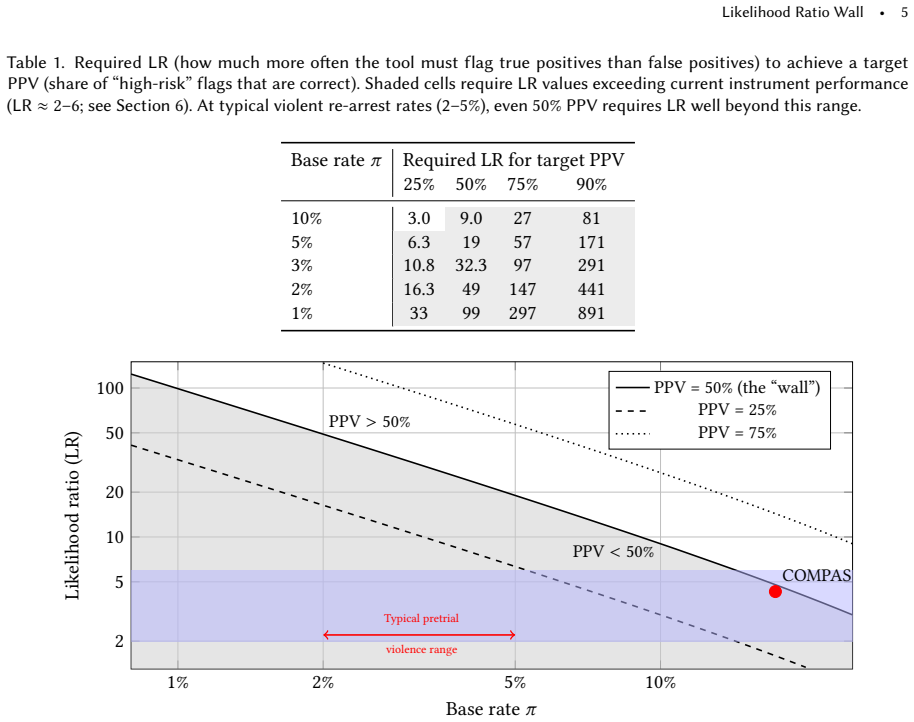
We derive a universal precision bound—the Likelihood Ratio Wall—showing that when violent re-arrest rates are low (2-5%), achieving even a 50% hit rate among people labeled 'high risk' (positive predictive value, or PPV) would require tools far more discriminative than current instruments appear to be. For rare outcomes, a tool can have respectable-looking performance metrics and still be wrong most of the time it flags someone as 'high risk for violence.' We show that post-hoc score recalibration cannot solve this problem because it does not improve the tool's underlying ability to separate true positives from false positives. We further prove a Surveillance Ceiling: when over-policing infl
What carries the argument
The Likelihood Ratio Wall, a bound on achievable positive predictive value obtained from the Bayes relation between likelihood ratios and base rates for rare events.
If this is right
- Current instruments cannot deliver high-confidence individual labels for rare violent re-offense without many false positives.
- Recalibrating existing scores leaves the precision bound unchanged because it does not increase separation of true and false positives.
- Over-policed groups face a structurally lower ceiling on precision even when their true offense rates match other groups.
- Decisions should incorporate the Number Needed to Detain rather than relying on binary high-risk flags.
- Fairness discussions that ignore base-rate limits and surveillance effects remain incomplete.
Where Pith is reading between the lines
- Similar structural limits likely appear in any domain that tries to predict rare binary events from noisy observational features, such as rare disease screening or low-probability security threats.
- Policy could shift from individualized detention thresholds toward group-level or resource-allocation approaches that do not require crossing the wall.
- Longitudinal data that track both recorded and unrecorded offending could test whether the Surveillance Ceiling is the dominant practical constraint.
- The bound supplies a concrete benchmark against which future instrument improvements can be measured rather than aggregate accuracy alone.
Load-bearing premise
The observed discrimination power of current instruments is representative of what is achievable and the standard Bayes model relating likelihood ratios to PPV holds without unmodeled dependencies between features and policing intensity.
What would settle it
A large-scale empirical test that measures the actual likelihood ratio of an existing pretrial instrument and shows whether it exceeds the threshold required to reach 50 percent PPV at 2-5 percent base rate, or a direct count of realized PPV in a jurisdiction with known low violent re-arrest prevalence.
Figures

read the original abstract
Pretrial risk assessment tools are used on over one million U.S. defendants each year, yet their use for predicting rare violent re-offense faces a basic statistical barrier. We derive a universal precision bound -- the Likelihood Ratio Wall -- showing that when violent re-arrest rates are low (2-5%), achieving even a 50% hit rate among people labeled "high risk" (positive predictive value, or PPV) would require tools far more discriminative than current instruments appear to be. For rare outcomes, a tool can have respectable-looking performance metrics and still be wrong most of the time it flags someone as "high risk for violence." We show that post-hoc score recalibration cannot solve this problem because it does not improve the tool's underlying ability to separate true positives from false positives. We further prove a Surveillance Ceiling: when over-policing inflates recorded "risk factors" among those who would not re-offend, the maximum achievable precision is structurally lower for over-policed groups, even at equal offense rates. We translate these results into the Number Needed to Detain (how many people must be detained to prevent one violent offense), and propose that risk reports should communicate this uncertainty explicitly. Our findings suggest that for rare violent outcomes, debates about fairness metrics alone are incomplete: under current data regimes, the available features may not support high-confidence individualized detention decisions.
Editorial analysis
A structured set of objections, weighed in public.
Referee Report
Summary. The paper derives a 'Likelihood Ratio Wall' from the standard Bayes relation between positive predictive value (PPV), likelihood ratio (LR+), and base rate, showing that at violent re-arrest base rates of 2-5% even a 50% PPV requires LR+ values substantially higher than those exhibited by existing pretrial risk instruments. It further proves a 'Surveillance Ceiling' arising when over-policing inflates recorded risk factors among non-offenders, demonstrates that post-hoc recalibration cannot overcome the underlying discrimination limit, introduces the Number Needed to Detain metric, and recommends explicit communication of uncertainty in risk reports. The central claim is that these statistical and data-regime constraints impose structural limits on high-confidence individualized detention decisions for rare violent outcomes.
Significance. If the modeling of policing effects is completed and the empirical claims about current tool performance are substantiated, the work supplies a clean, algebraically transparent bound that formalizes long-standing concerns about base-rate problems in criminal justice risk assessment. The explicit derivation of the required LR+ and the Surveillance Ceiling provide a useful quantitative language for policy discussions that have often remained qualitative. The translation into Number Needed to Detain and the call for uncertainty disclosure are practical contributions that could improve how risk scores are presented to judges and defendants.
major comments (2)
- [Surveillance Ceiling section] Surveillance Ceiling section: the model correctly captures the channel in which over-policing inflates false-positive risk factors, but omits any symmetric term for differential detection of the true violent offense (i.e., the outcome variable). Consequently the derived numerical wall describes performance on the observed re-arrest indicator rather than on the policy-relevant quantity of actual violence prevented; the manuscript should either extend the model to include both channels or explicitly qualify the scope of the bound.
- [Likelihood Ratio Wall derivation] Likelihood Ratio Wall derivation and empirical comparison: the algebraic rearrangement of PPV = (LR+ * base_rate) / (1 - base_rate + LR+ * base_rate) to solve for the minimum LR+ needed for a target PPV is correct and parameter-free given the base rate. However, the load-bearing claim that 'current instruments appear to be' unable to supply the required LR+ rests on specific empirical estimates; the paper should state the exact LR+ values, data sources, and jurisdictions used for that comparison so readers can assess generalizability.
minor comments (2)
- The abstract and introduction should more sharply distinguish the universal mathematical bound (which holds under the stated Bayes assumptions) from the contingent empirical claim about the discrimination power of existing tools.
- Notation for LR+ and PPV should be introduced with a brief reference to the diagnostic-testing literature at first use to aid readers outside criminology.
Simulated Author's Rebuttal
We thank the referee for their thoughtful and constructive comments, which have helped us sharpen the scope and empirical transparency of the manuscript. We address each major comment in turn below.
read point-by-point responses
-
Referee: [Surveillance Ceiling section] Surveillance Ceiling section: the model correctly captures the channel in which over-policing inflates false-positive risk factors, but omits any symmetric term for differential detection of the true violent offense (i.e., the outcome variable). Consequently the derived numerical wall describes performance on the observed re-arrest indicator rather than on the policy-relevant quantity of actual violence prevented; the manuscript should either extend the model to include both channels or explicitly qualify the scope of the bound.
Authors: We agree that the Surveillance Ceiling derivation applies to the observed re-arrest indicator, as the model incorporates over-policing effects on recorded risk factors and the administratively observed outcome. This focus is deliberate because risk tools are trained, validated, and used on observable data, and detention decisions are made on that basis. We acknowledge that differential detection of actual (unobserved) violence would constitute an additional channel. Extending the formal model to include both channels would require non-identifiable assumptions about group-specific rates of unreported violence, which cannot be recovered from current administrative datasets. We will therefore revise the manuscript to (i) explicitly qualify the scope of the Surveillance Ceiling to performance on the observed re-arrest indicator and (ii) add a concise discussion paragraph noting the implications of differential outcome detection as a limitation for interpreting the bound in terms of actual violence prevented. revision: partial
-
Referee: [Likelihood Ratio Wall derivation] Likelihood Ratio Wall derivation and empirical comparison: the algebraic rearrangement of PPV = (LR+ * base_rate) / (1 - base_rate + LR+ * base_rate) to solve for the minimum LR+ needed for a target PPV is correct and parameter-free given the base rate. However, the load-bearing claim that 'current instruments appear to be' unable to supply the required LR+ rests on specific empirical estimates; the paper should state the exact LR+ values, data sources, and jurisdictions used for that comparison so readers can assess generalizability.
Authors: We thank the referee for confirming the algebraic correctness of the Likelihood Ratio Wall derivation. The empirical comparison in the manuscript relies on published performance metrics from evaluations of pretrial instruments. In the revision we will insert a new subsection that explicitly reports the LR+ point estimates (and, where available, confidence intervals), the instruments (Public Safety Assessment, COMPAS, and others), the source studies, the jurisdictions or datasets (Broward County, Kentucky, and additional U.S. sites), and the base rates employed in those evaluations. We will also include a short sensitivity table showing how plausible variation in these LR+ values shifts the distance to the wall. This addition will make the empirical grounding fully transparent and allow readers to judge generalizability directly. revision: yes
Circularity Check
No significant circularity; derivation applies standard Bayes relations to stated base rates
full rationale
The Likelihood Ratio Wall is obtained by algebraic rearrangement of the standard PPV formula PPV = (LR+ * base_rate) / (1 - base_rate + LR+ * base_rate) to solve for the minimum LR+ needed for a target PPV at low base rates. This is a direct, parameter-free consequence of the definitions of likelihood ratio and positive predictive value; no parameters are fitted within the paper and then relabeled as predictions. The Surveillance Ceiling is presented as a modeled proof under explicit assumptions about differential recording of risk factors, without reducing to self-citation chains, author-specific uniqueness theorems, or ansatzes imported from prior work. No self-definitional loops, fitted-input predictions, or renaming of known results occur. The central claims remain independent of any internal data fitting and rest on externally verifiable Bayes relations and the stated modeling assumptions.
Axiom & Free-Parameter Ledger
free parameters (1)
- violent re-arrest base rate =
2-5%
axioms (2)
- standard math Positive predictive value is a function of the likelihood ratio and the base rate via Bayes' theorem
- domain assumption Over-policing inflates recorded risk factors among non-offenders
Reference graph
Works this paper leans on
-
[1]
Douglas G. Altman and J. Martin Bland. 1994. Statistics Notes: Diagnostic tests 2: predictive values.BMJ309, 6947 (1994), 102. doi:10.1136/bmj.309.6947.102
-
[2]
2016.Machine Bias
Julia Angwin, Jeff Larson, Surya Mattu, and Lauren Kirchner. 2016.Machine Bias. ProPublica. https://www.propublica.org/article/ machine-bias-risk-assessments-in-criminal-sentencing
2016
-
[3]
2019.Race After Technology: Abolitionist Tools for the New Jim Code
Ruha Benjamin. 2019.Race After Technology: Abolitionist Tools for the New Jim Code. Polity, Oxford, UK
2019
-
[4]
Alexandra Chouldechova. 2017. Fair Prediction with Disparate Impact: A Study of Bias in Recidivism Prediction Instruments.Big Data 5, 2 (2017), 153–163. doi:10.1089/big.2016.0047
-
[5]
Danielle Keats Citron and Frank Pasquale. 2014. The Scored Society: Due Process for Automated Predictions.Washington Law Review 89, 1 (2014), 1–33
2014
-
[6]
2018.The Public Safety Assessment: A Re-validation in Kentucky
Matthew DeMichele, Peter Baumgartner, Michael Wenger, Kelle Barrick, Megan Comfort, and Sanjay Misra. 2018.The Public Safety Assessment: A Re-validation in Kentucky. Technical Report. RTI International. https://advancingpretrial.org/psa/about/research/
2018
-
[7]
Sarah L. Desmarais, Kiersten L. Johnson, and Jay P. Singh. 2016. Performance of Recidivism Risk Assessment Instruments in U.S. Correctional Settings.Psychological Services13, 3 (2016), 206–222. doi:10.1037/ser0000075
-
[8]
Will Dobbie, Jacob Goldin, and Crystal S. Yang. 2018. The Effects of Pre-trial Detention on Conviction, Future Crime, and Employment: Evidence from Randomly Assigned Judges.American Economic Review108, 2 (2018), 201–240. doi:10.1257/aer.20161503
-
[9]
Friedler, Scott Neville, Carlos Scheidegger, and Suresh Venkatasubramanian
Danielle Ensign, Sorelle A. Friedler, Scott Neville, Carlos Scheidegger, and Suresh Venkatasubramanian. 2018. Runaway Feedback Loops in Predictive Policing. InProceedings of the 1st Conference on Fairness, Accountability and Transparency (FAT*), Vol. 81. PMLR, 160–171. Likelihood Ratio Wall•15
2018
-
[10]
2018.Automating Inequality: How High-Tech Tools Profile, Police, and Punish the Poor
Virginia Eubanks. 2018.Automating Inequality: How High-Tech Tools Profile, Police, and Punish the Poor. St. Martin’s Press, New York, NY
2018
-
[11]
Ben Green. 2020. The False Promise of Risk Assessments: Epistemic Reform and the Limits of Fairness. InProceedings of the 2020 Conference on Fairness, Accountability, and Transparency (FAccT ’20). ACM, 594–606. doi:10.1145/3351095.3372869
-
[12]
David J. Hand. 2009. Measuring Classifier Performance: A Coherent Alternative to the Area Under the ROC Curve.Machine Learning 77, 1 (2009), 103–123. doi:10.1007/s10994-009-5119-5
-
[13]
Harcourt
Bernard E. Harcourt. 2007.Against Prediction: Profiling, Policing, and Punishing in an Actuarial Age. University of Chicago Press, Chicago, IL
2007
-
[14]
John P. A. Ioannidis. 2005. Why Most Published Research Findings Are False.PLoS Medicine2, 8 (2005), e124. doi:10.1371/journal.pmed. 0020124
-
[15]
Jon Kleinberg, Sendhil Mullainathan, and Manish Raghavan. 2017. Inherent Trade-Offs in the Fair Determination of Risk Scores. In Proceedings of the 8th Innovations in Theoretical Computer Science Conference (ITCS). Schloss Dagstuhl–Leibniz-Zentrum fuer Informatik, 43:1–43:23
2017
-
[16]
Andreas Laupacis, David L. Sackett, and Robin S. Roberts. 1988. An Assessment of Clinically Useful Measures of the Consequences of Treatment.New England Journal of Medicine318, 26 (1988), 1728–1733. doi:10.1056/NEJM198806303182605
-
[17]
Lowenkamp, Marie VanNostrand, and Alexander Holsinger
Christopher T. Lowenkamp, Marie VanNostrand, and Alexander Holsinger. 2013.The Hidden Costs of Pretrial Detention. Technical Report. Laura and John Arnold Foundation
2013
-
[18]
Kristian Lum and William Isaac. 2016. To Predict and Serve?Significance13, 5 (2016), 14–19. doi:10.1111/j.1740-9713.2016.00960.x
-
[19]
Sandra G. Mayson. 2018. Dangerous Defendants.Yale Law Journal127, 3 (2018), 490–568
2018
-
[20]
C. M. A. McCauliff. 1982. Burdens of Proof: Degrees of Belief, Quanta of Evidence, or Constitutional Guarantees?Vanderbilt Law Review 35, 6 (1982), 1293–1335
1982
-
[21]
Alexandru Niculescu-Mizil and Rich Caruana. 2005. Predicting Good Probabilities with Supervised Learning. InProceedings of the 22nd International Conference on Machine Learning (ICML ’05). ACM, 625–632. doi:10.1145/1102351.1102430
-
[22]
NYC Mayor’s Office of Criminal Justice. 2021. Pretrial Docketed Rearrest: Contextual Overview — December 2021 Update. https://criminaljustice.cityofnewyork.us/wp-content/uploads/2021/12/Pretrial-Docketed-Rearrest-Contextual-Overview- December-2021-Update.pdf. Accessed: 2026-04-29
2021
-
[23]
John C. Platt. 1999. Probabilistic Outputs for Support Vector Machines and Comparisons to Regularized Likelihood Methods. InAdvances in Large Margin Classifiers, Alexander J. Smola, Peter Bartlett, Bernhard Schölkopf, and Dale Schuurmans (Eds.). MIT Press, 61–74
1999
-
[24]
Cynthia Rudin. 2019. Stop Explaining Black Box Machine Learning Models for High Stakes Decisions and Use Interpretable Models Instead.Nature Machine Intelligence1, 5 (2019), 206–215. doi:10.1038/s42256-019-0048-y
-
[25]
Wendy Sawyer and Peter Wagner. 2023. Mass Incarceration: The Whole Pie 2023. https://www.prisonpolicy.org/reports/pie2023.html
2023
-
[26]
Jennifer L. Skeem and John Monahan. 2011. Current Directions in Violence Risk Assessment.Current Directions in Psychological Science 20, 1 (2011), 38–42. doi:10.1177/0963721410397240
-
[27]
Sonja B. Starr. 2014. Evidence-Based Sentencing and the Scientific Rationalization of Discrimination.Stanford Law Review66, 4 (2014), 803–872
2014
-
[28]
Stevenson
Megan T. Stevenson. 2018. Assessing Risk Assessment in Action.Minnesota Law Review103, 1 (2018), 303–384
2018
-
[29]
Stevenson and Sandra G
Megan T. Stevenson and Sandra G. Mayson. 2022. Pretrial Detention and the Value of Liberty.Virginia Law Review108, 3 (2022), 709–782
2022
-
[30]
Supreme Court of the United States. 1979. Addington v. Texas. 441 U.S. 418. U.S. Supreme Court
1979
-
[31]
United States Congress. 1984. Bail Reform Act of 1984. 18 U.S.C. § 3142. Pub. L. No. 98–473, 98 Stat. 1976 (codified at 18 U.S.C. § 3142)
1984
-
[32]
Bianca Zadrozny and Charles Elkan. 2002. Transforming Classifier Scores into Accurate Multiclass Probability Estimates. InProceedings of the Eighth ACM SIGKDD International Conference on Knowledge Discovery and Data Mining (KDD ’02). ACM, 694–699. doi:10.1145/ 775047.775151 A Full Proof of Theorem 4 (Surveillance Ceiling) We provide the complete proof exp...
discussion (0)
Sign in with ORCID, Apple, or X to comment. Anyone can read and Pith papers without signing in.