Recognition: unknown
Threshold Exceedance Estimation in Spatially Correlated Areal Data Using Maxima-Nominated Sampling
Pith reviewed 2026-05-09 17:42 UTC · model grok-4.3
The pith
A maxima-nominated sampling design produces a closed-form estimator for the fraction of high-risk areas that has lower variance than standard sampling when the fraction is low to moderate.
A machine-rendered reading of the paper's core claim, the machinery that carries it, and where it could break.
Core claim
The DUST-MNS design forms n candidate sets of size k and obtains final measurements only from the area judged highest risk in each set, yielding n measured areas from nk screened candidates. A closed-form estimator of the exceedance probability θ is derived from these measurements, together with its exact bias and variance. In the regime θ < θ⋆(k), where θ⋆(k) depends only on k, the DUST-MNS estimator has smaller variance than the estimators from simple random sampling and from DUST-SRS. The paper supplies guidance on choosing k, efficiency bounds under a Beta model, extensions to imperfect ranking, variance estimators, and bootstrap confidence intervals.
What carries the argument
DUST-MNS design that forms n sets of k candidates, ranks them by auxiliary information or judgment, and measures only the maximum in each set, thereby combining maxima-nominated sampling with pps-DUST to control spatial spread and autocorrelation.
If this is right
- The estimator admits closed-form expressions for bias and variance that do not require simulation.
- Efficiency gains hold for all θ below a cutoff θ⋆(k) that is determined solely by the set size k.
- The method extends directly to imperfect ranking and supplies bootstrap confidence intervals.
- Efficiency bounds are available under a Beta model for the underlying success probabilities.
- Guidance is given for selecting the set size k to balance screening cost against variance reduction.
Where Pith is reading between the lines
- The same grouping-and-maxima logic could be tested on non-areal spatial data such as point-referenced pollution readings or gridded satellite imagery.
- Sequential updating of the ranking information across multiple survey waves might further reduce the number of full measurements needed.
- Simulations that vary the strength of spatial correlation beyond the Beta model would show whether the reported efficiency threshold θ⋆(k) remains stable.
Load-bearing premise
Areas within each candidate set can be ranked by risk with sufficient accuracy using only expert judgment, prior surveys, or cheap auxiliary covariates.
What would settle it
Apply the DUST-MNS estimator and an SRS estimator to the same fixed spatial population whose true exceedance proportion θ is known to lie above θ⋆(k) and compare their empirical mean squared errors.
Figures


read the original abstract
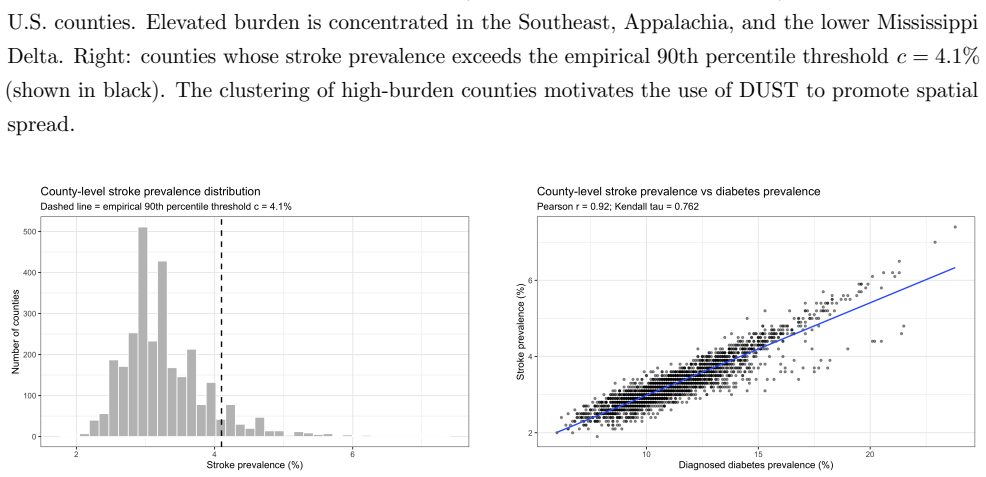
We study estimation of the proportion of areal units in a spatially correlated domain whose success probabilities exceed a prespecified threshold. Such problems arise in health surveillance, environmental monitoring, and social policy, where the goal is to estimate the fraction of high-risk areas. We propose a DUST-MNS design that combines maxima-nominated sampling (MNS) with the probability-proportional-to-size dependent unit sequential technique (pps-DUST), thereby promoting spatial spread while mitigating the effect of spatial autocorrelation. The design forms $n$ candidate sets of size $k$ and obtains final measurements only from the area judged to be at highest risk in each set, yielding $n$ measured areas from $nk$ screened candidates. Ranking may be based on expert judgment, prior surveys, or easily obtained auxiliary covariates. We derive a closed-form estimator of the exceedance probability $\theta$ based on data from DUST-MNS design, establish its bias and variance, and show that, in the rare-to-moderate exceedance regime $\theta<\theta^\star(k)$, the proposed DUST-MNS estimator outperforms its SRS and DUST-SRS counterparts, where $\theta^\star(k)$ depends only on $k$. We also provide guidance on the choice of $k$, derive efficiency bounds under a Beta model, extend the method to imperfect ranking, and develop variance estimation and bootstrap confidence intervals. An application to county-level stroke prevalence data from CDC PLACES, using diabetes prevalence as the ranking concomitant, illustrates the proposed approach.
Editorial analysis
A structured set of objections, weighed in public.
Referee Report
Summary. The manuscript proposes the DUST-MNS design, which combines maxima-nominated sampling of size-k candidate sets with pps-DUST to promote spatial spread while reducing the impact of spatial autocorrelation. From the n measured units (the maxima within each set), it derives a closed-form estimator of the exceedance probability θ, supplies exact bias and variance formulas, proves that this estimator dominates SRS and DUST-SRS when θ < θ⋆(k) for a threshold depending only on k, gives guidance on selecting k, extends the results to imperfect ranking, develops variance estimators and bootstrap intervals, and demonstrates the method on CDC PLACES county-level stroke prevalence data ranked by diabetes prevalence.
Significance. If the closed-form derivations and regime-specific dominance hold, the paper supplies a theoretically transparent and practically implementable sampling strategy for estimating rare-to-moderate exceedance proportions in spatially dependent areal data. The explicit bias/variance expressions, the k-only dependence of the efficiency threshold, the Beta-model bounds, and the real-data illustration are strengths that would make the contribution useful for health surveillance and environmental monitoring applications.
major comments (2)
- [§3.2] §3.2, the efficiency comparison: the statement that DUST-MNS outperforms DUST-SRS for θ < θ⋆(k) relies on the exact variance expressions derived under the pps-DUST inclusion probabilities; the manuscript should verify that the spatial-spread mechanism does not alter the ordering of the variances when the ranking is imperfect, as this is load-bearing for the practical recommendation.
- [§4.1] §4.1, Eq. (12): the closed-form estimator is presented as unbiased under perfect ranking, but the subsequent bias formula under imperfect ranking (Eq. (15)) introduces a multiplicative factor that depends on the ranking accuracy parameter; the paper should state whether this factor is estimated from data or treated as known, because it affects the claimed closed-form property.
minor comments (3)
- [§2.1] The notation for the candidate-set size k and the number of sets n is introduced in the abstract but first defined formally only in §2.1; a single early definition paragraph would improve readability.
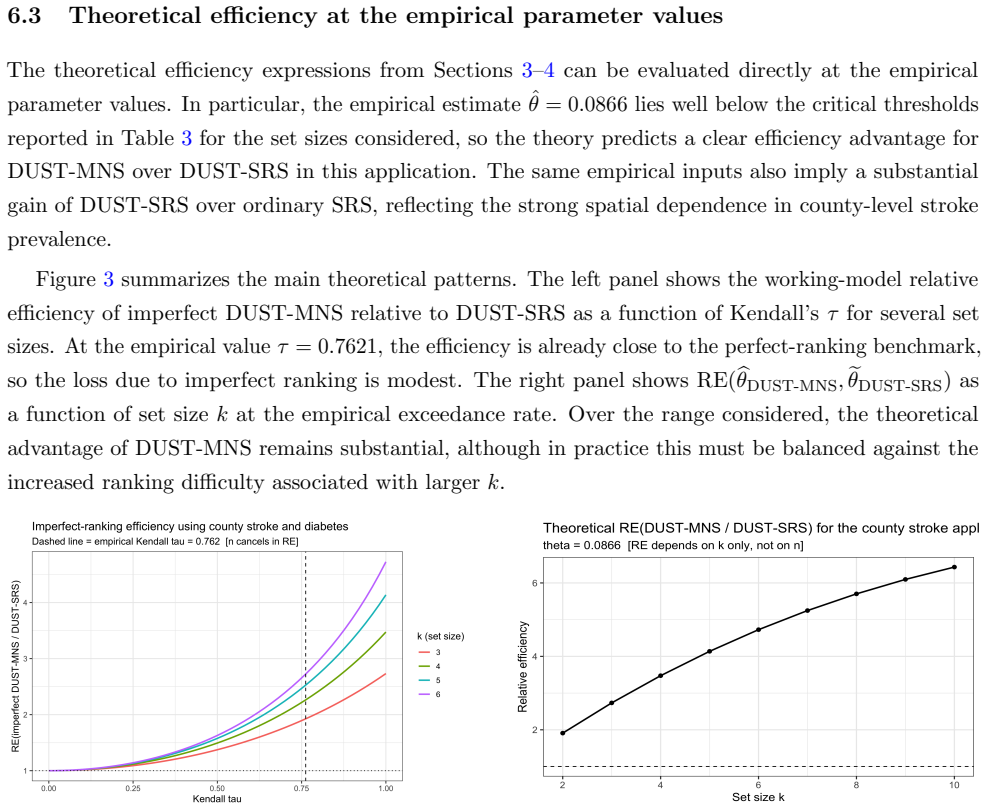
- [Figure 3] Figure 3 (efficiency curves) uses a log-scale on the θ axis without labeling the break points at θ⋆(k) for k=2,3,4; adding vertical reference lines at these values would make the regime condition visually immediate.
- [§5.3] The bootstrap CI procedure in §5.3 is described algorithmically but lacks a small simulation check against the exact variance formula; a brief table comparing coverage would strengthen the implementation guidance.
Simulated Author's Rebuttal
We thank the referee for the constructive review and the recommendation for minor revision. We address each major comment below with clarifications and planned revisions.
read point-by-point responses
-
Referee: [§3.2] §3.2, the efficiency comparison: the statement that DUST-MNS outperforms DUST-SRS for θ < θ⋆(k) relies on the exact variance expressions derived under the pps-DUST inclusion probabilities; the manuscript should verify that the spatial-spread mechanism does not alter the ordering of the variances when the ranking is imperfect, as this is load-bearing for the practical recommendation.
Authors: We agree that verifying the variance ordering under imperfect ranking is necessary to support the practical recommendations. The dominance result and exact variance formulas in §3.2 are derived under perfect ranking. Section 4.1 extends the bias and variance expressions to imperfect ranking by incorporating a ranking accuracy parameter that multiplicatively adjusts the formulas. However, we did not re-derive or numerically confirm that the pps-DUST spatial-spread mechanism preserves the dominance ordering (DUST-MNS over DUST-SRS for θ < θ⋆(k)) under this extension. We will add a short analytical argument or targeted simulation study in the revised §3.2 or §4 showing that the relative variance ordering is maintained, as the inclusion probabilities affect both estimators in a comparable way. This addition will be included in the next version. revision: yes
-
Referee: [§4.1] §4.1, Eq. (12): the closed-form estimator is presented as unbiased under perfect ranking, but the subsequent bias formula under imperfect ranking (Eq. (15)) introduces a multiplicative factor that depends on the ranking accuracy parameter; the paper should state whether this factor is estimated from data or treated as known, because it affects the claimed closed-form property.
Authors: The estimator in Eq. (12) is closed-form and can be computed directly from the observed maxima without reference to the ranking accuracy parameter. The multiplicative factor appearing in the bias expression (Eq. (15)) is a theoretical modeling device used solely to characterize bias under imperfect ranking; it is treated as a known constant in the analysis, following the standard approach in ranked-set and nominated sampling literature. This parameter is not estimated from the primary sample and is not required to compute the estimator, its variance estimator, or the bootstrap intervals. We will insert a clarifying sentence in §4.1 to make this distinction explicit, thereby preserving the closed-form claim for the estimator while addressing the referee's concern. revision: yes
Circularity Check
No significant circularity
full rationale
The paper derives a closed-form estimator for the exceedance probability θ directly from the DUST-MNS sampling design probabilities, along with explicit bias and variance formulas. The regime-specific dominance result is obtained by comparing these expressions to those for SRS and DUST-SRS, with the threshold θ⋆(k) depending only on the design parameter k. All steps are presented as mathematical consequences of the design construction and ranking mechanism without reducing to fitted parameters, self-referential definitions, or load-bearing self-citations. The argument is internally self-contained.
Axiom & Free-Parameter Ledger
free parameters (1)
- k
axioms (2)
- domain assumption Ranking within candidate sets can be performed reliably using expert judgment, prior surveys, or auxiliary covariates.
- domain assumption The exceedance probability θ lies in the rare-to-moderate regime θ < θ⋆(k).
Reference graph
Works this paper leans on
-
[1]
Arbia, G. (1993). The use of GIS in spatial statistical surveys. International Statistical Review , 61(2):339--359
1993
-
[2]
A., Zahnd, W
Benavidez, G. A., Zahnd, W. E., Hung, P., and Eberth, J. M. (2024). Chronic disease prevalence in the US : Sociodemographic and geographic variations by zip code tabulation area. Preventing Chronic Disease , 21:230267
2024
-
[3]
Bohn, L. L. and Wolfe, D. A. (1994). The effect of imperfect judgment rankings on properties of procedures based on the ranked-set samples analog of the Mann--Whitney--Wilcoxon statistic. Journal of the American Statistical Association , 89(425):168--176
1994
-
[4]
Boyles, R. A. and Samaniego, F. J. (1986). Estimating a distribution function based on nomination sampling. Journal of the American Statistical Association , 81(396):1039--1045
1986
-
[5]
A., Watson, K
Carlson, S. A., Watson, K. B., Rockhill, S., Wang, Y., Pankowska, M. M., and Greenlund, K. J. (2023). Linking Local-Level Chronic Disease and Social Vulnerability Measures to Inform Planning Efforts: A COPD Example. Preventing Chronic Disease , 20:230025
2023
-
[6]
Chen C., Becker C., Delhey L., Twardzik E., and Lisabeth L.D. (2026). County-Level Associations Between Structural Inequalities in Social Determinants of Health and Stroke Prevalence Among U.S. Adults: An Ecologic Study. American Journal of Preventive Medicine . Online ahead of print. DOI/URL: https://pubmed.ncbi.nlm.nih.gov/41167506/
-
[7]
A., and Wolfe, D
Chen, H., Stasny, E. A., and Wolfe, D. A. (2006). Unbalanced ranked set sampling for estimating a population proportion. Biometrics , 62(1):150--158
2006
-
[8]
David, H. A. and Nagaraja, H. N. (2003). Order Statistics, 3rd ed. Wiley, Hoboken, NJ
2003
-
[9]
J., Lu, H., Wang, Y., Matthews, K
Greenlund, K. J., Lu, H., Wang, Y., Matthews, K. A., LeClercq, J. M., Lee, B., and Carlson, S. A. (2022). PLACES : Local data for better health. Preventing Chronic Disease , 2022 Jun 16;19:E31
2022
-
[10]
and Kaufmann, R
Hacker, K. and Kaufmann, R. (2024). Chronic disease mapping, an important strategy and tool for health promotion. Preventing Chronic Disease , 2024 Apr 25;21:E28
2024
-
[11]
and Johnson, B
Jafari Jozani, M. and Johnson, B. C. (2012). Randomized nomination sampling for finite populations. Journal of Statistical Planning and Inference , 142(7):2103--2115
2012
-
[12]
Kvam, P. H. and Samaniego, F. J. (1993). On estimating distribution functions using nomination samples. Journal of the American Statistical Association , 88(424):1317--1322
1993
-
[13]
and Jafari Jozani, M
Loewen, N. and Jafari Jozani, M. (2026). Leveraging rank information for robust regression analysis: A nomination sampling approach. Statistics in Medicine , 45(1--2):e70362
2026
-
[14]
N., Stasny, E
MacEachern, S. N., Stasny, E. A., and Wolfe, D. A. (2004). Judgement post-stratification with imprecise rankings. Biometrics , 60(1):207--215
2004
-
[15]
Moran, P. A. P. (1950). Notes on continuous stochastic phenomena. Biometrika , 37(1--2):17--23
1950
-
[16]
W., Wolfe, D
Nahhas, R. W., Wolfe, D. A., and Chen, H. (2002). Ranked set sampling: Cost and optimal set size. Biometrics , 58(4):964--971
2002
-
[17]
Nourmohammadi, M., Jafari Jozani, M., and Johnson, B. C. (2014). Confidence intervals for quantiles in finite populations with randomized nomination sampling. Computational Statistics & Data Analysis , 73:112--128
2014
-
[18]
Nourmohammadi, M., Jafari Jozani, M., and Johnson, B. C. (2015). Nonparametric confidence intervals for quantiles with randomized nomination sampling. Sankhya A , 77(2):408--432
2015
-
[19]
Nourmohammadi, M., Jafari Jozani, M., and Johnson, B. C. (2020). Parametric inference using nomination sampling with an application to mercury contamination in fish. Sankhya A , 82(1):115--146
2020
-
[20]
L., Lisabeth, L., Schneider, A
Stulberg, E. L., Lisabeth, L., Schneider, A. L. C., Skolarus, L., Kershaw, K. N., Zheutlin, A. R., Harris, B. R. E., Sarpong, D., Wong, K.-H., Sheth, K. N., and de Havenon, A. (2024). Correlations of socioeconomic and clinical determinants with United States county-level stroke prevalence. Annals of Neurology , 96(4):739--744
2024
-
[21]
Tiwari, R. C. and Wells, M. T. (1989). Quantile estimation based on nomination sampling. IEEE Transactions on Reliability , 38(5):612--614
1989
-
[22]
Willemain, T. R. (1980). Estimating the population median by nomination sampling. Journal of the American Statistical Association , 75(372):908--911
1980
-
[23]
Yu, P. L. H. and Lam, K. (1997). Regression estimator in ranked set sampling. Biometrics , 53(3):1070--1080
1997
discussion (0)
Sign in with ORCID, Apple, or X to comment. Anyone can read and Pith papers without signing in.