Recognition: 3 theorem links
· Lean TheoremPersistent Homology of Time Series through Complex Networks
Pith reviewed 2026-05-08 19:28 UTC · model grok-4.3
The pith
Converting time series to graphs and extracting persistent homology features yields classification performance that varies with graph construction and distance metric.
A machine-rendered reading of the paper's core claim, the machinery that carries it, and where it could break.
Core claim
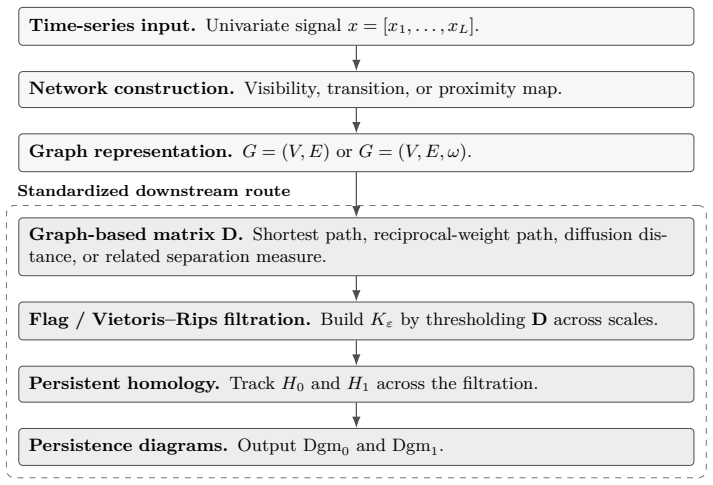
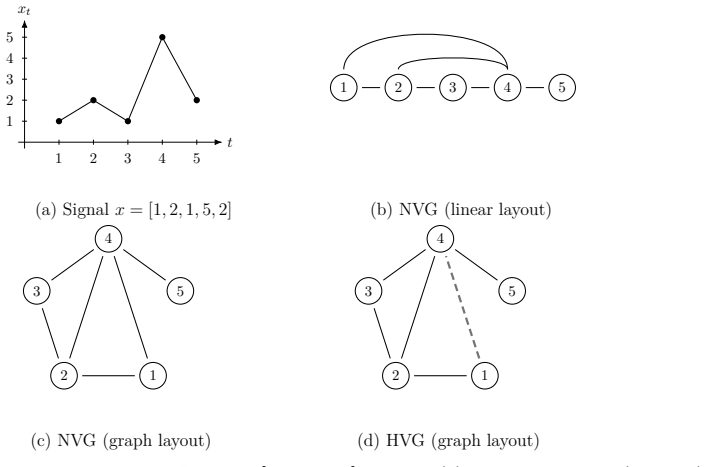
The central claim is that a time series can be represented as a complex network via visibility, horizontal visibility, transition, or proximity constructions; a dissimilarity matrix can then be formed from the graph; a Vietoris-Rips filtration of that matrix produces persistence diagrams; and those diagrams can be turned into classification features by persistence landscapes together with summary statistics. When this pipeline is applied uniformly, classification results on twelve standard time-series collections show that no single graph construction is universally superior, that diffusion distance uniformly outperforms shortest-path distance, and that the extracted features degrade only in
What carries the argument
The standardized pipeline that converts a time series to a graph, extracts a dissimilarity matrix, computes its Vietoris-Rips persistence diagrams, and vectorizes the diagrams with persistence landscapes and summary statistics.
If this is right
- Classification accuracy on a given time-series task will depend on selecting the graph construction whose structure best matches the discriminative patterns in that signal.
- Replacing shortest-path distance with diffusion distance on the constructed graph will raise accuracy for every construction and every dataset tested.
- The topological features extracted from the graphs will continue to support classification even after moderate amounts of noise are added to the original time series.
Where Pith is reading between the lines
- Users facing a new collection of time series may need to evaluate several graph constructions on a validation subset rather than adopting one default construction.
- The observed noise robustness suggests the pipeline could be applied directly to sensor recordings that contain typical measurement fluctuations.
- The same standardization approach could be used to compare additional graph constructions or alternative filtrations on the same benchmark collections.
Load-bearing premise
That holding the persistence-landscape and summary-statistic steps constant removes all interactions between graph construction and downstream feature quality, so performance gaps can be attributed only to the choice of graph and distance metric.
What would settle it
Repeating the twelve-dataset experiments while replacing persistence landscapes with a different vectorization such as persistence images and checking whether the relative ordering of the five graph constructions stays the same.
Figures


read the original abstract
We present a unified pipeline for univariate time series classification via complex networks and persistent homology. A time series is mapped to a graph through one of five constructions across three families (visibility (natural and horizontal visibility graphs), transition, and proximity) and the graph is converted to a dissimilarity matrix from which a Vietoris-Rips filtration yields persistence diagrams. These diagrams are vectorized into fixed-length features through persistence landscapes and topological summary statistics. By standardizing the downstream processing, differences in classification performance are attributable to the network construction and distance metric alone. Experiments on twelve UCR benchmarks show that (i) no single construction dominates: the optimal graph type depends on the signal's discriminative structure; (ii) the graph distance metric is a first-order design choice, with diffusion distance uniformly outperforming shortest-path alternatives; and (iii) persistence-based features degrade gracefully under noise, consistent with the classical stability theorem of persistent homology.
Editorial analysis
A structured set of objections, weighed in public.
Referee Report
Summary. The manuscript proposes a unified pipeline for univariate time series classification that maps each series to one of five complex-network constructions (natural/horizontal visibility graphs, transition graphs, proximity graphs), converts the graph to a dissimilarity matrix, computes a Vietoris-Rips persistence diagram, and vectorizes the diagram via persistence landscapes plus topological summary statistics. By fixing the downstream vectorization, performance differences across constructions and distance metrics (diffusion vs. shortest-path) are attributed to the upstream choices. Experiments on twelve UCR benchmarks show that no construction dominates, diffusion distance consistently outperforms shortest-path alternatives, and the resulting features degrade gracefully under additive noise.
Significance. If the empirical comparisons hold after addressing scale normalization, the work supplies a systematic, benchmark-driven evaluation of how graph-construction choices and distance metrics shape persistent-homology features for time series. The finding that diffusion distance is uniformly superior and that topological summaries remain stable under noise aligns with classical stability theorems and offers concrete guidance for practitioners choosing among visibility, transition, and proximity representations.
major comments (2)
- [Abstract and Methods] Abstract and Methods (pipeline description): the claim that 'standardizing the downstream processing' makes classification differences attributable solely to network construction and distance metric is not yet supported. The five constructions produce dissimilarity matrices with systematically different scales and sparsity (visibility graphs yield sparse, locally determined distances; proximity and transition graphs yield denser or probabilistic weights). Vietoris-Rips filtrations are sensitive to absolute distance values; without explicit per-matrix normalization (e.g., diameter scaling or min-max), birth/death times embed scale-dependent information that the fixed persistence landscapes and summary statistics can exploit, creating a hidden interaction between upstream construction and feature quality.
- [Results] Results section (benchmark tables): it is unclear whether the reported accuracy differences are statistically significant after correction for multiple comparisons across twelve datasets, five constructions, and two distance metrics, or whether hyperparameters and data splits were pre-specified. Without these details the claim that 'no single construction dominates' and that 'diffusion distance uniformly outperforms' cannot be evaluated for robustness.
minor comments (2)
- [Methods] The manuscript would benefit from an explicit table or subsection listing the precise parameter settings (e.g., visibility thresholds, proximity radii, transition-matrix construction) used for each of the five graph families.
- [Figures] Figure captions should state the exact noise model and SNR levels used in the robustness experiments to allow direct replication.
Simulated Author's Rebuttal
We thank the referee for these insightful comments on scale sensitivity and statistical robustness. We agree that both points identify areas where the current manuscript can be strengthened without altering its core contributions. We respond to each major comment below and will incorporate the suggested revisions.
read point-by-point responses
-
Referee: [Abstract and Methods] Abstract and Methods (pipeline description): the claim that 'standardizing the downstream processing' makes classification differences attributable solely to network construction and distance metric is not yet supported. The five constructions produce dissimilarity matrices with systematically different scales and sparsity (visibility graphs yield sparse, locally determined distances; proximity and transition graphs yield denser or probabilistic weights). Vietoris-Rips filtrations are sensitive to absolute distance values; without explicit per-matrix normalization (e.g., diameter scaling or min-max), birth/death times embed scale-dependent information that the fixed persistence landscapes and summary statistics can exploit, creating a hidden interaction between upstream construction and feature quality.
Authors: We agree that the absence of explicit per-matrix normalization leaves open the possibility that scale differences in the dissimilarity matrices influence the resulting persistence diagrams and downstream features. Although the vectorization step is held fixed, the Vietoris-Rips filtration itself depends on absolute distances. To eliminate this confounding factor, we will revise the Methods section to apply diameter normalization to every dissimilarity matrix (scaling all entries by the matrix diameter so that distances lie in [0,1]) before filtration. This change will be documented with pseudocode and will ensure that performance differences can be attributed more cleanly to the choice of network construction and distance metric. revision: yes
-
Referee: [Results] Results section (benchmark tables): it is unclear whether the reported accuracy differences are statistically significant after correction for multiple comparisons across twelve datasets, five constructions, and two distance metrics, or whether hyperparameters and data splits were pre-specified. Without these details the claim that 'no single construction dominates' and that 'diffusion distance uniformly outperforms' cannot be evaluated for robustness.
Authors: The train/test splits follow the pre-specified UCR protocols, and graph-construction hyperparameters were set to the literature defaults cited in the manuscript. However, we did not conduct formal significance testing or apply multiple-comparison corrections. In the revised Results section we will add a statistical analysis subsection that reports Wilcoxon signed-rank tests (or paired t-tests where appropriate) on the accuracy differences, together with Bonferroni correction across the 12 datasets × 5 constructions × 2 metrics comparisons. We will also state the hyperparameter choices explicitly. These additions will allow readers to assess the robustness of the claims that no construction dominates and that diffusion distance is uniformly superior. revision: yes
Circularity Check
No circularity: empirical pipeline with standardized downstream processing
full rationale
The paper describes a fixed pipeline (five graph constructions from time series, dissimilarity matrices, Vietoris-Rips filtrations, persistence landscapes plus summary statistics) and reports comparative classification accuracies on twelve public UCR benchmarks. No mathematical derivation, uniqueness theorem, or prediction is claimed; performance differences are presented as experimental outcomes under the explicit methodological choice of standardized vectorization. No self-citations appear as load-bearing premises, no parameters are fitted then relabeled as predictions, and no ansatz or renaming reduces the central claims to inputs by construction. The standardization step is a design decision whose validity is testable against the benchmarks rather than tautological.
Axiom & Free-Parameter Ledger
axioms (2)
- standard math Vietoris-Rips filtration and persistence diagrams are well-defined on the dissimilarity matrices derived from the graphs.
- domain assumption Persistence landscapes and topological summary statistics provide stable, fixed-length features.
Reference graph
Works this paper leans on
-
[1]
Aaron Adcock, Erik Carlsson, and Gunnar Carlsson. The ring of algebraic functions on persistence bar codes.Homology, Homotopy and Applications, 18(1):381–402, 2016. doi: 10.4310/HHA.2016.v18.n1.a21
-
[2]
Akingbade, Marian Gidea, Matteo Manzi, and Vahid Nateghi
Samuel W. Akingbade, Marian Gidea, Matteo Manzi, and Vahid Nateghi. Why topological data analysis detects financial bubbles?Communications in Nonlinear Science and Numerical Simulation, 128:107665, 2024. doi: 10.1016/j.cnsns.2023.107665
-
[3]
Multiscale permutation entropy of physiological time series
Wajid Aziz and Muhammad Arif. Multiscale permutation entropy of physiological time series. In9th International Multitopic Conference (INMIC). IEEE, 2005. doi: 10.1109/INMIC.2005. 334494
-
[4]
Anthony Bagnall, Jason Lines, Aaron Bostrom, James Large, and Eamonn Keogh. The great time series classification bake off: a review and experimental evaluation of recent algorithmic advances.Data Mining and Knowledge Discovery, 31(3):606–660, 2017. doi: 10.1007/s10618-016-0483-9
-
[5]
Christoph Bandt and Bernd Pompe. Permutation entropy: a natural complexity measure for time series.Physical Review Letters, 88(17):174102, 2002. doi: 10.1103/PhysRevLett.88. 174102
-
[6]
Nicolas Bonneel, Julien Rabin, Gabriel Peyr ´e, and Hanspeter Pfister
Ulrich Bauer. Ripser: efficient computation of Vietoris–Rips persistence barcodes.Journal of Applied and Computational Topology, 5(3):391–423, 2021. doi: 10.1007/s41468-021-00071-5
-
[7]
Statistical topological data analysis using persistence landscapes.Jour- nal of Machine Learning Research, 16:77–102, 2015
Peter Bubenik. Statistical topological data analysis using persistence landscapes.Jour- nal of Machine Learning Research, 16:77–102, 2015. URLhttp://jmlr.org/papers/v16/ bubenik15a.html
2015
-
[8]
An introduction to topological data analysis: funda- mental and practical aspects for data scientists.Frontiers in Artificial Intelligence, 4:667963,
Frédéric Chazal and Bertrand Michel. An introduction to topological data analysis: funda- mental and practical aspects for data scientists.Frontiers in Artificial Intelligence, 4:667963,
-
[9]
doi: 10.3389/frai.2021.667963
-
[10]
David Cohen-Steiner, Herbert Edelsbrunner, John Harer, and Yuriy Mileyko
DavidCohen-Steiner, HerbertEdelsbrunner, andJohnHarer. Stabilityofpersistencediagrams. Discrete & Computational Geometry, 37(1):103–120, 2007. doi: 10.1007/s00454-006-1276-5
-
[11]
RonaldR.CoifmanandStéphaneLafon. Diffusionmaps.Applied and Computational Harmonic Analysis, 21(1):5–30, 2006. doi: 10.1016/j.acha.2006.04.006
-
[12]
The UCR time series archive.IEEE/CAA Journal of Automatica Sinica, 6(6):1293–1305, 2019
Hoang Anh Dau, Anthony Bagnall, Kaveh Kamgar, Chin-Chia Michael Yeh, Yan Zhu, Shaghayegh Gharghabi, Chotirat Ann Ratanamahatana, and Eamonn Keogh. The UCR time series archive.IEEE/CAA Journal of Automatica Sinica, 6(6):1293–1305, 2019. doi: 10.1109/JAS.2019.1911747. 30
-
[13]
Luiz Carlos de Jesus Jr., Francisco Fernández-Navarro, and Mariano Carbonero-Ruz. Enhanc- ing financial time series forecasting through topological data analysis.Neural Computing and Applications, 2025. doi: 10.1007/s00521-024-10787-x
-
[14]
Cambridge University Press, 2022
Tamal Krishna Dey and Yusu Wang.Computational Topology for Data Analysis. Cambridge University Press, 2022. doi: 10.1017/9781009099950
-
[15]
Reik V. Donner, Yong Zou, Jonathan F. Donges, Norbert Marwan, and Jürgen Kurths. Recur- rence networks—a novel paradigm for nonlinear time series analysis.New Journal of Physics, 12:033025, 2010. doi: 10.1088/1367-2630/12/3/033025
-
[16]
Topological persistence and simplification.Discrete & Computational Geometry, 28(4):511–533, 2002
Herbert Edelsbrunner, David Letscher, and Afra Zomorodian. Topological persistence and simplification.Discrete & Computational Geometry, 28(4):511–533, 2002. doi: 10.1007/ s00454-002-2885-2
2002
-
[17]
Complex network from time series based on phase space reconstruction.Chaos, 19(3):033137, 2009
Zhong-Ke Gao and Ning-De Jin. Complex network from time series based on phase space reconstruction.Chaos, 19(3):033137, 2009. doi: 10.1063/1.3227736
-
[18]
İsmail Güzel and Atabey Kaygun. Classification of stochastic processes with topological data analysis.Concurrency and Computation: Practice and Experience, 35(24):e7732, 2023. doi: 10.1002/cpe.7732
-
[19]
Eunwoo Heo and Jae-Hun Jung. Persistent homology of featured time series data and its applications.AIMS Mathematics, 9(10):27028–27057, 2024. doi: 10.3934/math.20241315
-
[20]
Danijela Horak, Slobodan Maletić, and Milan Rajković. Persistent homology of complex net- works.Journal of Statistical Mechanics: Theory and Experiment, 2009(3):P03034, 2009. doi: 10.1088/1742-5468/2009/03/P03034
-
[21]
Takashi Ichinomiya. Time series analysis using persistent homology of distance matrix.Non- linear Theory and Its Applications, IEICE, 14(2):79–91, 2023. doi: 10.1587/nolta.14.79
-
[22]
Machine learning of time series data using persistent homology.Scientific Reports, 15(15), 2025
Takashi Ichinomiya. Machine learning of time series data using persistent homology.Scientific Reports, 15(15), 2025. doi: 10.1038/s41598-025-06551-3
-
[23]
Time series classification via topological data analysis
Alperen Karan and Atabey Kaygun. Time series classification via topological data analysis. Expert Systems with Applications, 183:115326, 2021. doi: 10.1016/j.eswa.2021.115326
-
[24]
Kennel, Reggie Brown, and Henry D
Matthew B. Kennel, Reggie Brown, and Henry D. I. Abarbanel. Determining embedding dimension for phase-space reconstruction using a geometrical construction.Physical Review A, 45(6):3403–3411, 1992. doi: 10.1103/PhysRevA.45.3403
-
[25]
Khasawneh, Elizabeth Munch, Danielle Barnes, Max M
Firas A. Khasawneh, Elizabeth Munch, Danielle Barnes, Max M. Chumley, İsmail Güzel, Audun D. Myers, Sunia Tanweer, Sarah Tymochko, and Melih Yesilli. Teaspoon: A Python package for topological signal processing.Journal of Open Source Software, 10(107):7243,
-
[26]
doi: 10.21105/joss.07243
-
[27]
LucasLacasa, BartoloLuque, FernandoBallesteros, JordiLuque, andJuanCarlosNuno. From time series to complex networks: the visibility graph.Proceedings of the National Academy of Sciences, 105(13):4972–4975, 2008. doi: 10.1073/pnas.0709247105. 31
-
[28]
Zixin Lin, Nur Fariha Syaqina Zulkepli, Mohd Shareduwan Mohd Kasihmuddin, and R. U. Gobithaasan. Time-series forecasting via topological information supervised framework with efficient topological feature learning.Expert Systems with Applications, 299:130032, 2026. doi: 10.1016/j.eswa.2025.130032
-
[29]
Bartolo Luque, Lucas Lacasa, Fernando Ballesteros, and Jordi Luque. Horizontal visibility graphs: exact results for random time series.Physical Review E, 80(4):046103, 2009. doi: 10.1103/PhysRevE.80.046103
-
[30]
Sourav Majumdar and Arnab Kumar Laha. Clustering and classification of time series using topological data analysis with applications to finance.Expert Systems with Applications, 162: 113868, 2020. doi: 10.1016/j.eswa.2020.113868
-
[31]
Michael McCullough, Michael Small, Thomas Stemler, and Herbert Ho-Ching Iu. Time lagged ordinal partition networks for capturing dynamics of continuous dynamical systems.Chaos, 25(5):053101, 2015. doi: 10.1063/1.4919075
-
[32]
Khasawneh
Audun Myers, Elizabeth Munch, and Firas A. Khasawneh. Persistent homology of complex networks for dynamic state detection.Physical Review E, 100(2):022314, 2019. doi: 10.1103/ PhysRevE.100.022314
2019
-
[33]
Khasawneh, and Elizabeth Munch
Audun Myers, Firas A. Khasawneh, and Elizabeth Munch. Persistence of weighted ordinal partition networks for dynamic state detection.SIAM Journal on Applied Dynamical Systems, 22(1):65–89, 2023. doi: 10.1137/22M1476848
-
[34]
Myers, Firas A
Audun D. Myers, Firas A. Khasawneh, and Brittany T. Fasy. ANAPT: additive noise analysis for persistence thresholding.Foundations of Data Science, 4(2):243–269, 2022. doi: 10.3934/ fods.2022005
2022
-
[35]
Audun D. Myers, Max M. Chumley, Firas A. Khasawneh, and Elizabeth Munch. Persistent homology of coarse-grained state-space networks.Physical Review E, 107(3):034303, 2023. doi: 10.1103/PhysRevE.107.034303
-
[36]
Audun D. Myers, Max M. Chumley, and Firas A. Khasawneh. Delay parameter selection in permutation entropy using topological data analysis.La Matematica, 3(3):1103–1136, 2024. doi: 10.1007/s44007-024-00110-4
-
[37]
Jose A. Perea and John Harer. Sliding windows and persistence: an application of topological methods to signal analysis.Foundations of Computational Mathematics, 15(3):799–838, 2015. doi: 10.1007/s10208-014-9206-z
-
[38]
CatBoost: unbiased boosting with categorical features
Liudmila Prokhorenkova, Gleb Gusev, Aleksandr Vorobev, Anna Veronika Dorogush, and Andrey Gulin. CatBoost: unbiased boosting with categorical features. InAdvances in Neural Information Processing Systems, volume 31, 2018
2018
-
[39]
An introduction to persistent homology for time series
Nalini Ravishanker and Renjie Chen. An introduction to persistent homology for time series. WIREs Computational Statistics, 13(3):e1548, 2021. doi: 10.1002/wics.1548
-
[40]
Vanessa Freitas Silva, Maria Eduarda Silva, Pedro Ribeiro, and Fernando Silva. Time series analysis via network science: concepts and algorithms.WIREs Data Mining and Knowledge Discovery, 11(3):e1404, 2021. doi: 10.1002/widm.1404. 32
-
[41]
Detecting strange attractors in turbulence
Floris Takens. Detecting strange attractors in turbulence. InDynamical Systems and Turbu- lence, Warwick 1980, volume 898 ofLecture Notes in Mathematics, pages 366–381. Springer,
1980
-
[42]
doi: 10.1007/BFb0091924
-
[43]
Joshua B. Tenenbaum, Vin de Silva, and John C. Langford. A global geometric framework for nonlinear dimensionality reduction.Science, 290(5500):2319–2323, 2000. doi: 10.1126/science. 290.5500.2319
-
[44]
Minggang Wang and Lixin Tian. From time series to complex networks: the phase space coarse graining.Physica A: Statistical Mechanics and its Applications, 461:456–468, 2016. doi: 10.1016/j.physa.2016.06.028. 33
discussion (0)
Sign in with ORCID, Apple, or X to comment. Anyone can read and Pith papers without signing in.