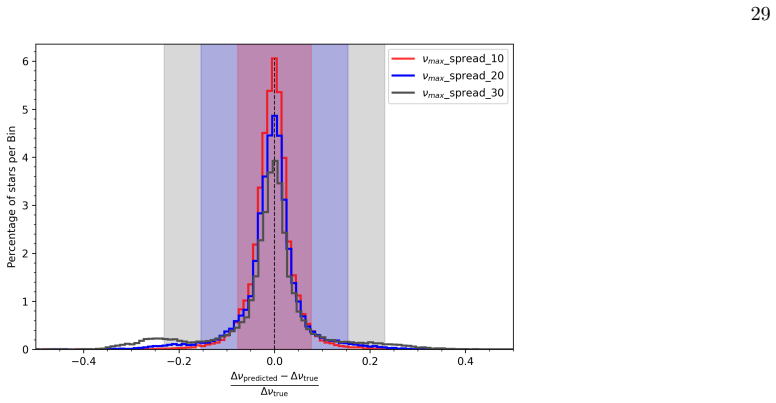
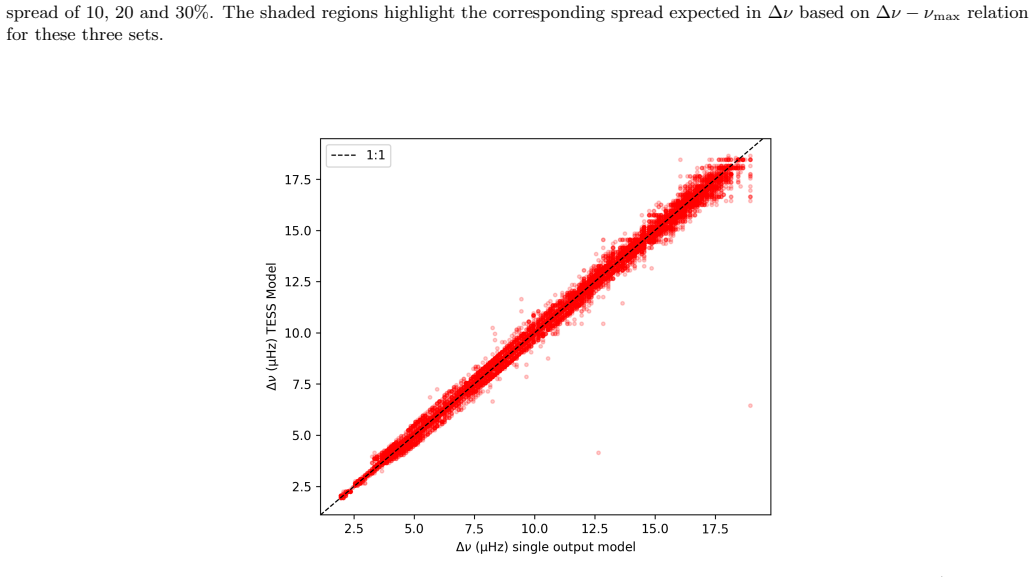
Recognition: no theorem link
Inferring Asteroseismic Parameters from Short Observations Using Deep Learning: Application to TESS and K2 Red Giants
Pith reviewed 2026-05-11 02:12 UTC · model grok-4.3
The pith
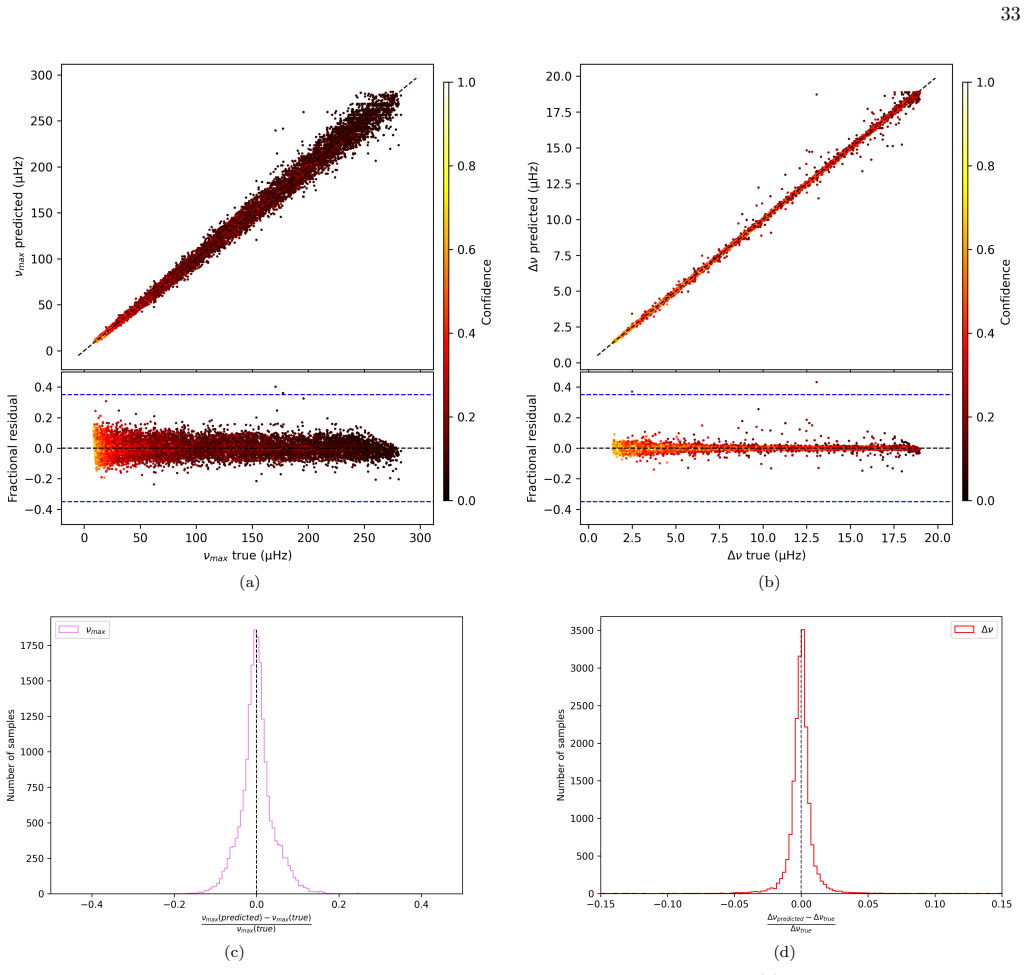
Deep learning can accurately infer the large frequency separation Δν and frequency of maximum power ν_max from one-month TESS observations of red giants in about 23 percent of cases.
A machine-rendered reading of the paper's core claim, the machinery that carries it, and where it could break.
Core claim
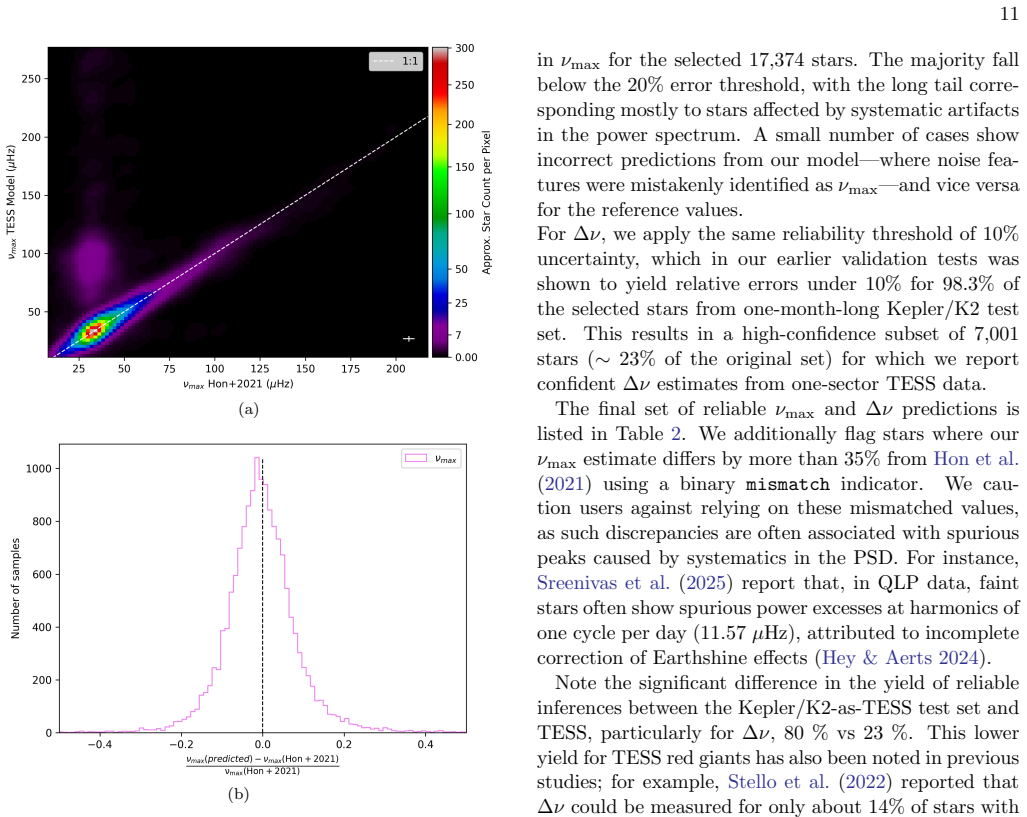
Our machine learning algorithm can accurately infer Δν and ν_max for approximately 50% of samples created by taking one-month Kepler and K2 observations. For TESS one sector data however, we recover reliable Δν for only about 23% of the stars. Additionally, we get reliable ΔΠ1 inferences for about 200 young red-giants from K2, which match the known Δν-ΔΠ1 degenerate sequence observed in Kepler red-giants.
What carries the argument
A deep learning model trained to map short-duration power spectra or light curves to the global seismic parameters Δν, ν_max, and ΔΠ1.
Load-bearing premise
The deep learning model trained on Kepler and K2 data generalizes to TESS observations despite differences in noise, cadence, and systematics, and the success rates are not inflated by unaccounted domain shifts or selection effects.
What would settle it
Direct comparison of the machine learning predictions against independent asteroseismic parameters derived from full-length observations or alternative analysis methods on the same TESS and K2 targets.
Figures


read the original abstract
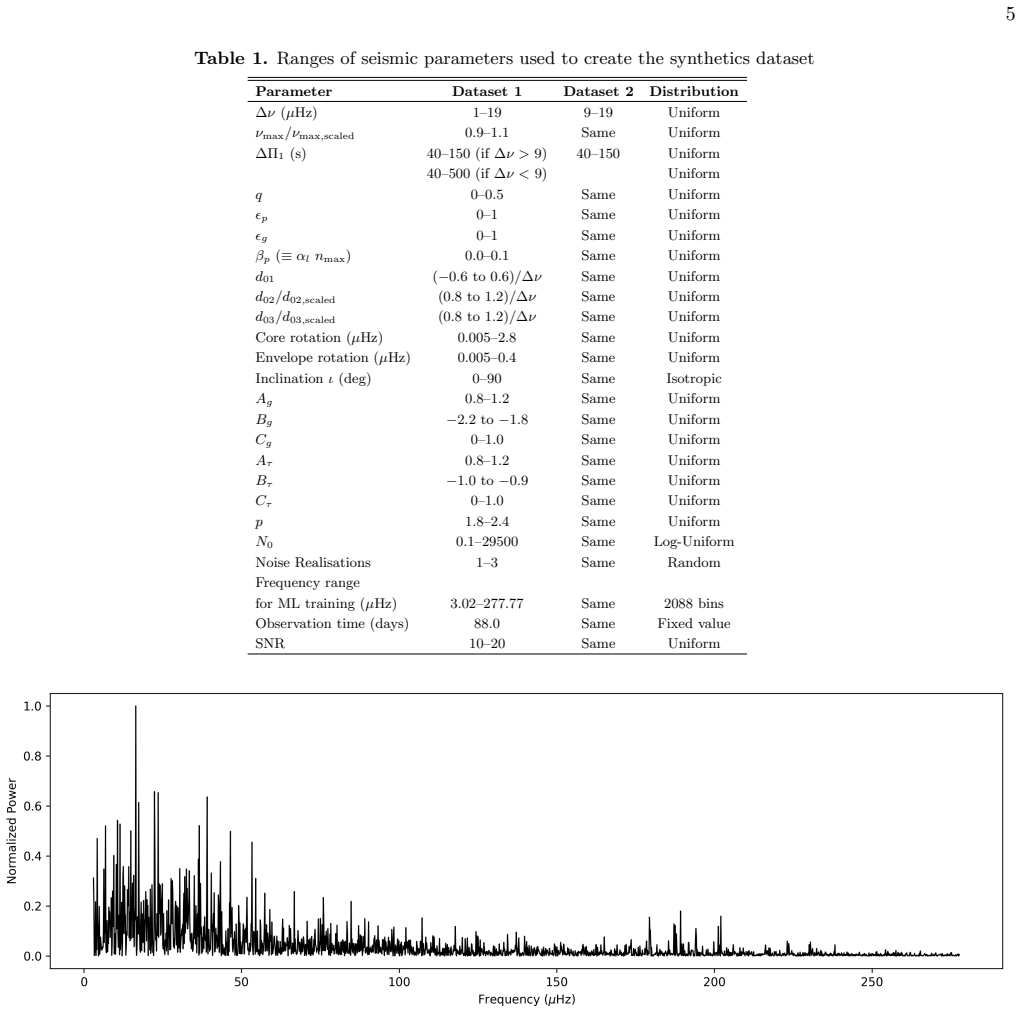
Asteroseismology is the study of resonant oscillations of stars to infer their internal structure and dynamics. It is also a powerful tool for precisely determining stellar parameters such as mass, radius, surface gravity, and age. The ongoing TESS mission, with its nearly complete sky coverage, presents a unique opportunity to uniformly probe stellar populations across the Milky Way. TESS is estimated to have observed more than 300,000 oscillating red giants, most of which have one to two months of observations. Given the scale of this dataset, we need a fast, efficient, and robust way to analyse the data. In this work, our objective is to develop a machine learning (ML) based method to infer asteroseismic parameters from short-duration observations. Specifically, we focus on two global seismic parameters, the large frequency separation ($\Delta\nu$) and the frequency at maximum power ($\nu_{\mathrm{max}}$), from one-month-long TESS observations of red giants. Meanwhile, for K2 data, our focus extends to inferring the period spacings of dipolar gravity modes ($\Delta\Pi_{1}$), in addition to $\Delta\nu$ and $\nu_{\mathrm{max}}$. Our findings demonstrate that our machine learning algorithm can accurately infer $\Delta\nu$ and $\nu_{\mathrm{max}}$ for approximately 50% of samples created by taking one-month Kepler and K2 observations. For TESS one sector data however, we recover reliable $\Delta\nu$ for only about 23% of the stars. Additionally, we get reliable $\Delta\Pi_{1}$ inferences for about 200 young red-giants from K2. For these $\Delta\Pi_{1}$ inferences, we see a good match with the well known $\Delta\nu-\Delta\Pi_{1}$ degenerate sequence observed in Kepler red-giants.
Editorial analysis
A structured set of objections, weighed in public.
Referee Report
Summary. The manuscript presents a deep learning method to infer global asteroseismic parameters (Δν and ν_max) from one-month observations of red giants, trained primarily on Kepler and K2 data and applied to TESS one-sector observations. It additionally reports inferences of the dipolar gravity-mode period spacing ΔΠ1 for ~200 young K2 red giants, which are shown to align with the known Δν–ΔΠ1 degenerate sequence from longer Kepler data.
Significance. If the reported success rates and generalization hold after addressing domain-shift controls, the work would enable efficient processing of the >300,000 TESS red-giant targets with short light curves, supporting large-scale stellar population studies. The explicit match between the inferred ΔΠ1 values and the established Kepler sequence provides a useful internal consistency check.
major comments (3)
- [Abstract] Abstract: The central claim that the model recovers reliable Δν for ~23% of TESS one-sector targets (versus ~50% for Kepler/K2 short observations) is load-bearing for the paper’s TESS application, yet no TESS-specific training data, domain-adaptation procedure, or noise-model injection is described. This leaves open the possibility that the performance drop reflects unmodeled instrument differences rather than intrinsic model capability.
- [Abstract] Abstract and results section: The terms “accurately infer” and “reliable” are used for the 50% and 23% fractions without an explicit definition of the acceptance threshold, uncertainty quantification, or how false-positive rates were controlled on the held-out short observations. This prevents assessment of whether the quoted percentages are robust or sensitive to post-hoc selection.
- [Results] ΔΠ1 results: While the alignment with the Kepler Δν–ΔΠ1 sequence is noted for the ~200 K2 stars, the manuscript does not report the fraction of K2 targets for which ΔΠ1 was attempted, the selection criteria for the “young red-giants” subset, or a quantitative metric (e.g., scatter or correlation coefficient) for the sequence match.
minor comments (2)
- Notation: The symbol ν_max is written with inconsistent subscript formatting in several figure captions and equations.
- [Abstract] The abstract states specific success fractions but supplies no information on model architecture, training/validation splits, or how “reliable” is defined; these details should be added to the main text or a methods summary table.
Simulated Author's Rebuttal
We thank the referee for their thoughtful and constructive comments on our manuscript. We have carefully considered each point and provide detailed responses below. Where appropriate, we will revise the manuscript to improve clarity and completeness.
read point-by-point responses
-
Referee: [Abstract] Abstract: The central claim that the model recovers reliable Δν for ~23% of TESS one-sector targets (versus ~50% for Kepler/K2 short observations) is load-bearing for the paper’s TESS application, yet no TESS-specific training data, domain-adaptation procedure, or noise-model injection is described. This leaves open the possibility that the performance drop reflects unmodeled instrument differences rather than intrinsic model capability.
Authors: The model was deliberately trained only on Kepler and K2 data to assess its ability to generalize to TESS observations without instrument-specific tuning. This tests the method's robustness for future applications where training data may be limited. We agree that a discussion of domain shift is warranted. In the revised manuscript, we will add a new subsection discussing the differences in noise characteristics between Kepler/K2 and TESS, potential reasons for the performance drop (including photometric precision and sampling rate), and outline possible future domain-adaptation strategies. We maintain that the reported 23% reflects the model's performance on real TESS data as is. revision: partial
-
Referee: [Abstract] Abstract and results section: The terms “accurately infer” and “reliable” are used for the 50% and 23% fractions without an explicit definition of the acceptance threshold, uncertainty quantification, or how false-positive rates were controlled on the held-out short observations. This prevents assessment of whether the quoted percentages are robust or sensitive to post-hoc selection.
Authors: We acknowledge that more precise definitions are required. In the revised manuscript, we will explicitly define the criteria for 'reliable' inferences, such as the fractional difference from the reference values derived from full-length observations being below a specified threshold (e.g., 10% for Δν and 5% for ν_max). We will also describe the uncertainty estimation method used in the deep learning model and report metrics like precision and recall on the held-out test sets to control for false positives. This will allow readers to evaluate the robustness of the quoted fractions. revision: yes
-
Referee: [Results] ΔΠ1 results: While the alignment with the Kepler Δν–ΔΠ1 sequence is noted for the ~200 K2 stars, the manuscript does not report the fraction of K2 targets for which ΔΠ1 was attempted, the selection criteria for the “young red-giants” subset, or a quantitative metric (e.g., scatter or correlation coefficient) for the sequence match.
Authors: We will expand the relevant results section to provide these details. Specifically, we will state the total number of K2 red giants considered for ΔΠ1 inference and the fraction (~200 out of the selected young subset) that yielded reliable results. The selection criteria for young red giants were based on their position in the Δν–ν_max diagram corresponding to the early red giant branch. Additionally, we will include quantitative measures such as the root-mean-square deviation from the Kepler sequence and the Spearman rank correlation coefficient to quantify the match. revision: yes
Circularity Check
No significant circularity in empirical ML performance claims
full rationale
The paper reports empirical success rates (approximately 50% on shortened Kepler/K2 data and 23% on TESS one-sector data) for a deep learning model inferring Δν, ν_max, and ΔΠ1. These are measured outcomes on held-out or new observations, not quantities that reduce by construction to the model's fitted parameters or self-referential definitions. No self-definitional loops, fitted inputs relabeled as predictions, or load-bearing self-citations appear in the abstract or described chain. Validation against the external known Δν-ΔΠ1 sequence is independent evidence, not circular. The derivation is self-contained empirical application rather than tautological.
Axiom & Free-Parameter Ledger
Reference graph
Works this paper leans on
-
[1]
Abadi, M., Agarwal, A., Barham, P., et al. 2015. https://www.usenix.org/system/files/conference/osdi16/ osdi16-abadi.pdf
work page 2015
-
[2]
Aerts, C., Christensen-Dalsgaard, J., & Kurtz, D. W. 2010, Asteroseismology, doi: 10.1007/978-1-4020-5803-5
-
[3]
2017, A&A, 600, A70, doi: 10.1051/0004-6361/201629363
Anders, F., Chiappini, C., Minchev, I., et al. 2017, A&A, 600, A70, doi: 10.1051/0004-6361/201629363
-
[4]
2006, in 36th COSPAR Scientific Assembly, Vol
Baglin, A., Auvergne, M., Boisnard, L., et al. 2006, in 36th COSPAR Scientific Assembly, Vol. 36, 3749
work page 2006
-
[5]
R., Mosser, B., Huber, D., et al
Bedding, T. R., Mosser, B., Huber, D., et al. 2011, Nature, 471, 608, doi: 10.1038/nature09935
-
[6]
Belkacem, K., Marques, J. P., Goupil, M. J., et al. 2015, A&A, 579, A31, doi: 10.1051/0004-6361/201526043
-
[7]
Benomar, O. 2023, Power Spectrum Simulator for Solar-like stars, Siddharth2023, Zenodo, doi: 10.5281/zenodo.8296459
-
[8]
2009, A&A, 506, 15, doi: 10.1051/0004-6361/200911657
Benomar, O., Appourchaux, T., & Baudin, F. 2009, A&A, 506, 15, doi: 10.1051/0004-6361/200911657
-
[9]
Benomar, O., Belkacem, K., Bedding, T. R., et al. 2014, ApJL, 781, L29, doi: 10.1088/2041-8205/781/2/L29
-
[10]
1994, Mixture density networks, WorkingPaper 4288, Aston University
Bishop, C. 1994, Mixture density networks, WorkingPaper 4288, Aston University
work page 1994
-
[11]
Kepler Planet-Detection Mission: Introduction and First Results.Science2010,327, 977
Borucki, W. J., Koch, D., Basri, G., et al. 2010, Science, 327, 977, doi: 10.1126/science.1185402
-
[12]
Chaplin, W. J., Kjeldsen, H., Bedding, T. R., et al. 2011, ApJ, 732, 54, doi: 10.1088/0004-637X/732/1/54
-
[13]
Davies, G. R., & Miglio, A. 2016, Astronomische Nachrichten, 337, 774, doi: 10.1002/asna.201612371 42
-
[14]
Deheuvels, S., Ballot, J., Beck, P. G., et al. 2015, A&A, 580, A96, doi: 10.1051/0004-6361/201526449
-
[15]
Astronomy and Astrophysics , author =
Deheuvels, S., Ballot, J., Gehan, C., & Mosser, B. 2022, Astronomy & Astrophysics, Volume 659, id.A106, <NUMPAGES>14</NUMPAGES>pp., 659, A106, doi: 10.1051/0004-6361/202142094
-
[16]
Deheuvels, S., Ouazzani, R. M., & Basu, S. 2017, A&A, 605, A75, doi: 10.1051/0004-6361/201730786
-
[17]
2022, ApJ, 928, 188, doi: 10.3847/1538-4357/ac5247 —
Dhanpal, S., Benomar, O., Hanasoge, S., et al. 2022, ApJ, 928, 188, doi: 10.3847/1538-4357/ac5247 —. 2023, ApJ, 958, 63, doi: 10.3847/1538-4357/ad0046
-
[18]
A., Belkacem, K., Samadi, R., et al
Dupret, M. A., Belkacem, K., Samadi, R., et al. 2009, A&A, 506, 57, doi: 10.1051/0004-6361/200911713
-
[19]
Fabbro, S., Venn, K. A., O’Briain, T., et al. 2018, MNRAS, 475, 2978, doi: 10.1093/mnras/stx3298 Gaia Collaboration, Brown, A. G. A., Vallenari, A., et al. 2018, A&A, 616, A1, doi: 10.1051/0004-6361/201833051 —. 2021, A&A, 649, A1, doi: 10.1051/0004-6361/202039657 Garc´ ıa, R. A., & Ballot, J. 2019, Living Reviews in Solar Physics, 16, 4, doi: 10.1007/s41...
-
[20]
2018, A&A, 616, A24, doi: 10.1051/0004-6361/201832822
Gehan, C., Mosser, B., Michel, E., Samadi, R., & Kallinger, T. 2018, A&A, 616, A24, doi: 10.1051/0004-6361/201832822
-
[21]
Goupil, M. J., Mosser, B., Marques, J. P., et al. 2013, A&A, 549, A75, doi: 10.1051/0004-6361/201220266
-
[22]
Grosjean, M., Dupret, M. A., Belkacem, K., et al. 2014, A&A, 572, A11, doi: 10.1051/0004-6361/201423827
-
[23]
Handberg, R., Lund, M. N., White, T. R., et al. 2021, AJ, 162, 170, doi: 10.3847/1538-3881/ac09f1
-
[24]
Harris, C. R., Millman, K. J., van der Walt, S. J., et al. 2020, Nature, 585, 357, doi: 10.1038/s41586-020-2649-2
-
[25]
Hastings, W. K. 1970, Biometrika, 57, 97, doi: 10.1093/biomet/57.1.97
-
[26]
Hatt, E., Nielsen, M. B., Chaplin, W. J., et al. 2023, A&A, 669, A67, doi: 10.1051/0004-6361/202244579
-
[27]
2024, A&A, 688, A93, doi: 10.1051/0004-6361/202450489
Hey, D., & Aerts, C. 2024, A&A, 688, A93, doi: 10.1051/0004-6361/202450489
-
[28]
Kuszlewicz, J. S. 2020, Monthly Notices of the Royal Astronomical Society, 499, 2445, doi: 10.1093/mnras/staa2853
-
[29]
S., Huber, D., Stello, D., & Reyes, C
Hon, M., Kuszlewicz, J. S., Huber, D., Stello, D., & Reyes, C. 2022, AJ, 164, 135, doi: 10.3847/1538-3881/ac8931
-
[30]
Hon, M., Stello, D., Garc´ ıa, R. A., et al. 2019, MNRAS, 485, 5616, doi: 10.1093/mnras/stz622
-
[31]
Hon, M., Stello, D., & Zinn, J. C. 2018, ApJ, 859, 64, doi: 10.3847/1538-4357/aabfdb
-
[32]
Hon, M., Huber, D., Kuszlewicz, J. S., et al. 2021, ApJ, 919, 131, doi: 10.3847/1538-4357/ac14b1
-
[33]
B., Sobeck, C., Haas, M., et al
Howell, S. B., Sobeck, C., Haas, M., et al. 2014, PASP, 126, 398, doi: 10.1086/676406
-
[34]
Huber, D., Stello, D., Bedding, T. R., et al. 2009, Communications in Asteroseismology, 160, 74, doi: 10.48550/arXiv.0910.2764
-
[35]
Huber, D., Bedding, T. R., Stello, D., et al. 2010, ApJ, 723, 1607, doi: 10.1088/0004-637X/723/2/1607 —. 2011, ApJ, 743, 143, doi: 10.1088/0004-637X/743/2/143
-
[36]
Kallinger, T., & Matthews, J. M. 2010, ApJL, 711, L35, doi: 10.1088/2041-8205/711/1/L35
-
[37]
2010, A&A, 522, A1, doi: 10.1051/0004-6361/201015263
Kallinger, T., Mosser, B., Hekker, S., et al. 2010, A&A, 522, A1, doi: 10.1051/0004-6361/201015263
-
[38]
2018, MNRAS, 479, 391, doi: 10.1093/mnras/sty1358
Kamiaka, S., Benomar, O., & Suto, Y. 2018, MNRAS, 479, 391, doi: 10.1093/mnras/sty1358
-
[39]
Kjeldsen, H., & Bedding, T. R. 2011, A&A, 529, L8, doi: 10.1051/0004-6361/201116789
-
[40]
Kuszlewicz, J. S., Hon, M., & Huber, D. 2023, The Astrophysical Journal, 954, 152, doi: 10.3847/1538-4357/ace598
-
[41]
Leung, H. W., & Bovy, J. 2019, MNRAS, 483, 3255, doi: 10.1093/mnras/sty3217
-
[42]
2024, A&A, 688, A184, doi: 10.1051/0004-6361/202449882 Lightkurve Collaboration, Cardoso, J
Li, G., Deheuvels, S., & Ballot, J. 2024, A&A, 688, A184, doi: 10.1051/0004-6361/202449882 Lightkurve Collaboration, Cardoso, J. V. d. M., Hedges, C., et al. 2018, Lightkurve: Kepler and TESS time series analysis in Python, Astrophysics Source Code Library. http://ascl.net/1812.013
-
[43]
Lomb, N. R. 1976, Ap&SS, 39, 447, doi: 10.1007/BF00648343
-
[44]
Lund, M. N. 2019, MNRAS, 489, 1072, doi: 10.1093/mnras/stz2010
-
[45]
Lund, M. N., Miesch, M. S., & Christensen-Dalsgaard, J. 2014, ApJ, 790, 121, doi: 10.1088/0004-637X/790/2/121
-
[46]
Lund, M. N., Handberg, R., Buzasi, D. L., et al. 2021, ApJS, 257, 53, doi: 10.3847/1538-4365/ac214a
-
[47]
T., Miglio, A., Elsworth, Y., et al
Mackereth, J. T., Miglio, A., Elsworth, Y., et al. 2021, MNRAS, 502, 1947, doi: 10.1093/mnras/stab098
-
[48]
Mathur, S., Garc´ ıa, R. A., R´ egulo, C., et al. 2010, A&A, 511, A46, doi: 10.1051/0004-6361/200913266
-
[49]
2011, ApJ, 741, 119, doi: 10.1088/0004-637X/741/2/119
Mathur, S., Hekker, S., Trampedach, R., et al. 2011, ApJ, 741, 119, doi: 10.1088/0004-637X/741/2/119
-
[50]
The Journal of Chemical Physics21(6), 1087–1092 (1953) https://doi.org/10.1063/1.1699114
Teller, A. H., & Teller, E. 1953, JChPh, 21, 1087, doi: 10.1063/1.1699114
-
[51]
Miglio, A., Chiappini, C., Mackereth, J. T., et al. 2021, A&A, 645, A85, doi: 10.1051/0004-6361/202038307 Montalb´ an, J., Miglio, A., Noels, A., et al. 2013, ApJ, 766, 118, doi: 10.1088/0004-637X/766/2/118 43
-
[52]
2009, A&A, 508, 877, doi: 10.1051/0004-6361/200912944
Mosser, B., & Appourchaux, T. 2009, A&A, 508, 877, doi: 10.1051/0004-6361/200912944
-
[53]
2018, A&A, 618, A109, doi: 10.1051/0004-6361/201832777
Mosser, B., Gehan, C., Belkacem, K., et al. 2018, A&A, 618, A109, doi: 10.1051/0004-6361/201832777
-
[54]
Goupil, M. J. 2015a, A&A, 584, A50, doi: 10.1051/0004-6361/201527075 —. 2015b, A&A, 584, A50, doi: 10.1051/0004-6361/201527075
-
[55]
2011, A&A, 532, A86, doi: 10.1051/0004-6361/201116825
Mosser, B., Barban, C., Montalb´ an, J., et al. 2011, A&A, 532, A86, doi: 10.1051/0004-6361/201116825
-
[56]
Mosser, B., Goupil, M. J., Belkacem, K., et al. 2012, A&A, 540, A143, doi: 10.1051/0004-6361/201118519
-
[57]
Ong, J. M. J., & Basu, S. 2020, ApJ, 898, 127, doi: 10.3847/1538-4357/ab9ffb
-
[58]
Ong, J. M. J., Basu, S., & Roxburgh, I. W. 2021, The Astrophysical Journal, 920, 8, doi: 10.3847/1538-4357/ac12ca
-
[59]
Ong, J. M. J., Bugnet, L., & Basu, S. 2022, ApJ, 940, 18, doi: 10.3847/1538-4357/ac97e7
-
[60]
Ong, J. M. J., & Gehan, C. 2023, The Astrophysical Journal, 946, 92, doi: 10.3847/1538-4357/acbf2f
-
[61]
OpenAI, Achiam, J., Adler, S., et al. 2024, GPT-4 Technical Report. https://arxiv.org/abs/2303.08774
work page internal anchor Pith review Pith/arXiv arXiv 2024
-
[62]
2019, A&A, 621, A26, doi: 10.1051/0004-6361/201833617
Pasquet, J., Bertin, E., Treyer, M., Arnouts, S., & Fouchez, D. 2019, A&A, 621, A26, doi: 10.1051/0004-6361/201833617
-
[63]
Press, W. H., & Rybicki, G. B. 1989, ApJ, 338, 277, doi: 10.1086/167197
-
[64]
2024, arXiv e-prints, arXiv:2406.05447, doi: 10.48550/arXiv.2406.05447
Rauer, H., Aerts, C., Cabrera, J., et al. 2024, arXiv e-prints, arXiv:2406.05447, doi: 10.48550/arXiv.2406.05447
-
[65]
2022, pandas-dev/pandas: Pandas 1.4.3, v1.4.3, Zenodo, doi: 10.5281/zenodo.6702671
Reback, J., jbrockmendel, McKinney, W., et al. 2022, pandas-dev/pandas: Pandas 1.4.3, v1.4.3, Zenodo, doi: 10.5281/zenodo.6702671
-
[66]
Richard, M. D., & Lippmann, R. P. 1991, Neural Computation, 3, 461, doi: 10.1162/neco.1991.3.4.461
-
[67]
Ricker, G. R., Winn, J. N., Vanderspek, R., et al. 2015, Journal of Astronomical Telescopes, Instruments, and Systems, 1, 014003, doi: 10.1117/1.JATIS.1.1.014003
work page internal anchor Pith review doi:10.1117/1.jatis.1.1.014003 2015
-
[68]
Deep Learning is Robust to Massive Label Noise
Rolnick, D., Veit, A., Belongie, S., & Shavit, N. 2017, arXiv e-prints, arXiv:1705.10694, doi: 10.48550/arXiv.1705.10694
-
[69]
Rothe, R., Timofte, R., & Van Gool, L. 2015, in 2015 IEEE International Conference on Computer Vision Workshop (ICCVW), 252–257, doi: 10.1109/ICCVW.2015.41
-
[70]
Scargle, J. D. 1982, ApJ, 263, 835, doi: 10.1086/160554
-
[71]
2019, MNRAS, 490, 5335, doi: 10.1093/mnras/stz2861
Sharma, S., Stello, D., Bland-Hawthorn, J., et al. 2019, MNRAS, 490, 5335, doi: 10.1093/mnras/stz2861
-
[72]
Shuntov, M., Pasquet, J., Arnouts, S., et al. 2020, A&A, 636, A90, doi: 10.1051/0004-6361/201937382 Silva Aguirre, V., Bojsen-Hansen, M., Slumstrup, D., et al. 2018, MNRAS, 475, 5487, doi: 10.1093/mnras/sty150 Silva Aguirre, V., Stello, D., Stokholm, A., et al. 2020, ApJL, 889, L34, doi: 10.3847/2041-8213/ab6443
-
[73]
Sreenivas, K. R., Bedding, T. R., Huber, D., et al. 2025, Testing the Wavelength Dependence of Oscillations and Granulation in Red Giants Using Kepler and TESS, arXiv, doi: 10.48550/arXiv.2502.01899
-
[74]
Bedding, T. R. 2009, MNRAS, 400, L80, doi: 10.1111/j.1745-3933.2009.00767.x
-
[75]
2015, The Astrophysical Journal, 809, L3, doi: 10.1088/2041-8205/809/1/L3
Stello, D., Huber, D., Sharma, S., et al. 2015, The Astrophysical Journal, 809, L3, doi: 10.1088/2041-8205/809/1/L3
-
[76]
2022, MNRAS, 512, 1677, doi: 10.1093/mnras/stac414
Stello, D., Saunders, N., Grunblatt, S., et al. 2022, MNRAS, 512, 1677, doi: 10.1093/mnras/stac414
-
[77]
2022, arXiv e-prints, arXiv:2211.05641, doi: 10.48550/arXiv.2211.05641
Stewart, L., Bach, F., Berthet, Q., & Vert, J.-P. 2022, arXiv e-prints, arXiv:2211.05641, doi: 10.48550/arXiv.2211.05641
-
[78]
Sullivan, P. W., Winn, J. N., Berta-Thompson, Z. K., et al. 2015, ApJ, 809, 77, doi: 10.1088/0004-637X/809/1/77
-
[79]
Vanderburg, A., & Johnson, J. A. 2014, PASP, 126, 948, doi: 10.1086/678764
-
[80]
2016, A&A, 588, A87, doi: 10.1051/0004-6361/201527259
Vrard, M., Mosser, B., & Samadi, R. 2016, A&A, 588, A87, doi: 10.1051/0004-6361/201527259
discussion (0)
Sign in with ORCID, Apple, or X to comment. Anyone can read and Pith papers without signing in.