Recognition: 2 theorem links
· Lean TheoremThe Gordian Knot for VLMs: Diagrammatic Knot Reasoning as a Hard Benchmark
Pith reviewed 2026-05-12 04:35 UTC · model grok-4.3
The pith
Vision-language models can describe knot diagrams but fail to simulate the moves required to reason about them.
A machine-rendered reading of the paper's core claim, the machinery that carries it, and where it could break.
Core claim
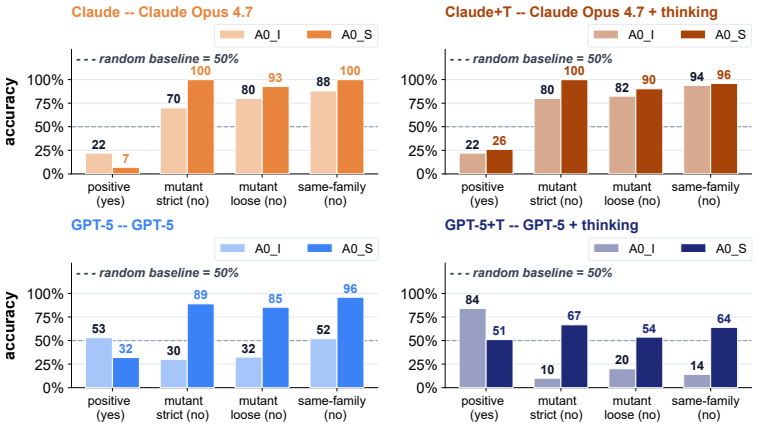
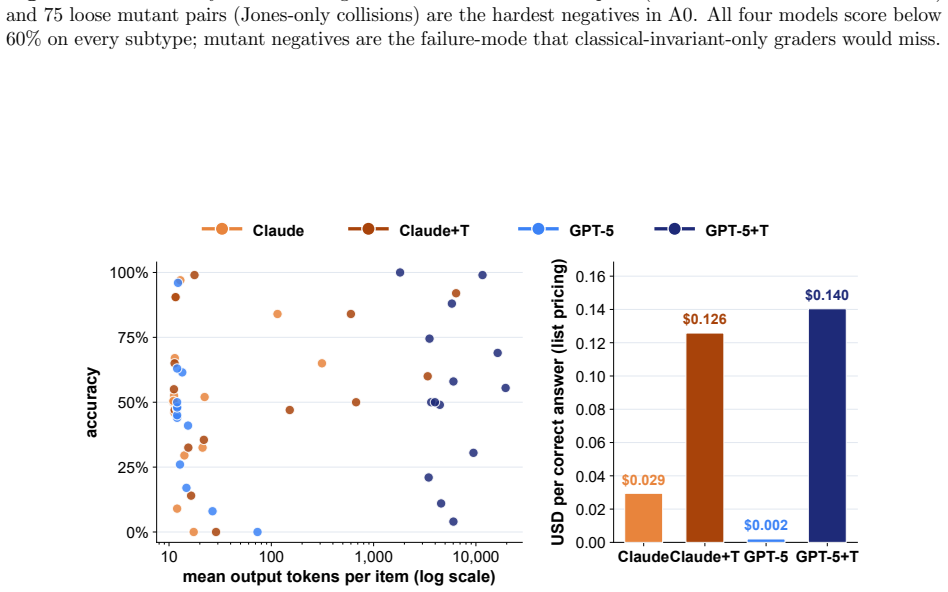
KnotBench shows that current vision-language models hold perceptual features of a knot diagram but lack apparatus to simulate moves on those features. Across 56 task-model combinations, 15 fall at or below random baseline and 8 of 14 tasks have best scores under 1.5 times random; thinking mode raises overall accuracy by only 1.65 points for one model and 9.25 for the other. No model produces a strictly correct string in diagram-to-symbol transcription, and permissive Regina decoding recovers the knot in at most 4 of 100 cases.
What carries the argument
KnotBench protocol of 14 tasks in four families, with answers checked against Regina canonical knot signatures and an image-versus-symbol split that measures the perception-operation gap.
If this is right
- Models remain near random on move-prediction and equivalence tasks even after thinking steps are allowed.
- Diagram-to-symbol transcription yields no strictly correct outputs, and permissive decoding recovers the knot in at most four of one hundred cases.
- The perception-operation gap persists across both image-only and symbol-augmented inputs.
- Thinking mode narrows the gap only modestly, leaving eight of fourteen tasks below 1.5 times random.
Where Pith is reading between the lines
- The same limitation may appear in other domains that require applying discrete operations to visual structures, such as geometry proofs or circuit diagrams.
- Hybrid systems pairing a vision-language model with an explicit symbolic simulator for moves could be tested directly on the same task set.
- Extending the benchmark to include non-prime knots or random diagrams would check whether the observed gap is specific to prime-knot structure.
Load-bearing premise
The generated knot-diagram images and Regina ground truth form an unbiased test of diagrammatic reasoning without systematic artifacts from rendering style or task wording.
What would settle it
Any vision-language model that produces strictly correct diagram-to-symbol strings on the full test set and scores well above 1.5 times random on all move-prediction and equivalence tasks would falsify the central claim.
Figures


read the original abstract
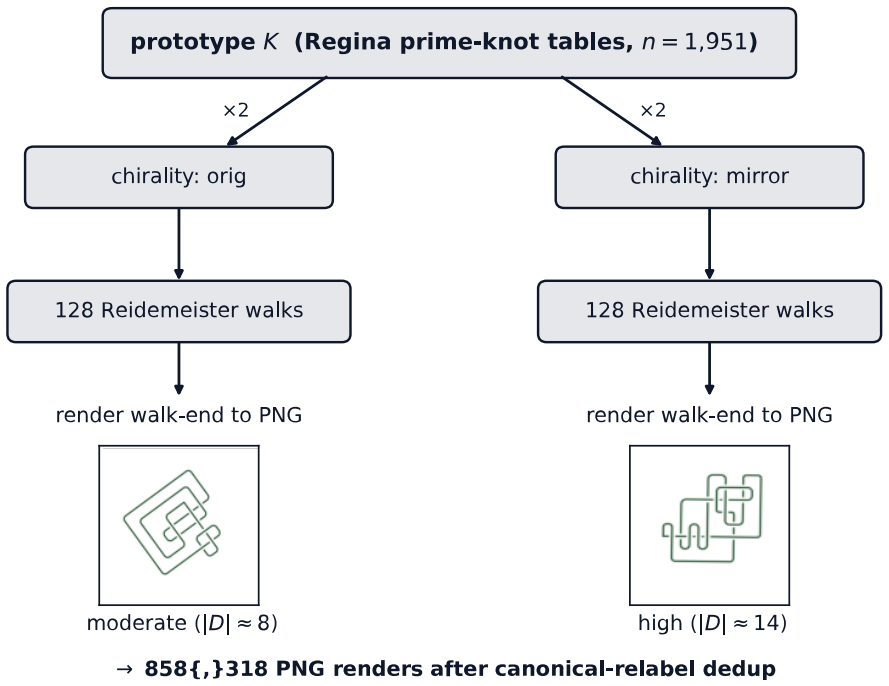
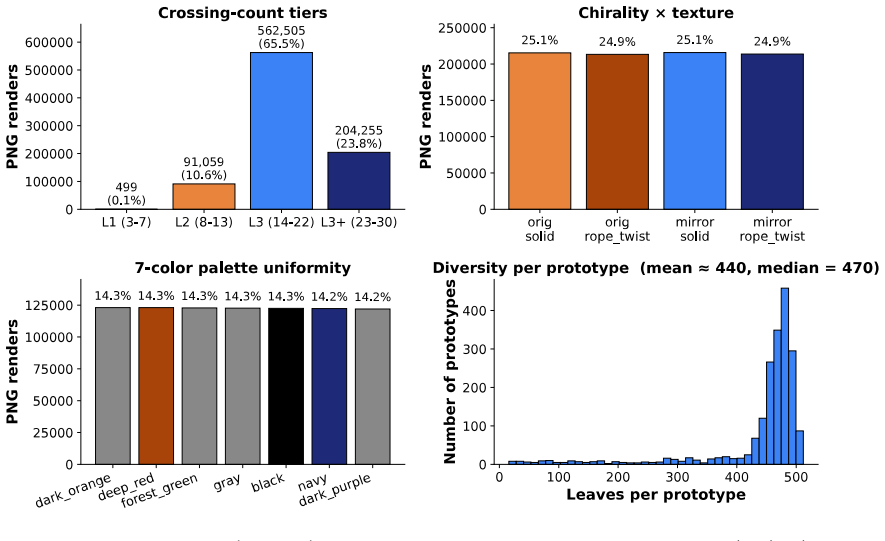
A vision-language model can look at a knot diagram and report what it sees, yet fail to act on that structure. KnotBench pairs an 858,318-image corpus from 1,951 prime-knot prototypes (crossing numbers 3 to 19) with a protocol whose answers are checked against Regina's canonical knot signature. Its 14 tasks span four families, equivalence judgment, move prediction, identification, and cross-modal grounding; an image-versus-symbol split locates failures along the perception-operation gap. We score Claude Opus 4.7 and GPT-5, each with and without thinking, under a 64K output-token budget matched on both vendors. Across 56 (task, model) cases, 15 sit at or below a random baseline and 8 of 14 tasks have a best score under 1.5x random. On diagram-to-symbol transcription, no model produces a strictly correct string, and permissive Regina decoding recovers the knot in 0 to 4 of 100 items. Thinking-mode reasoning lifts overall accuracy by 1.65 points for Claude and 9.25 points for GPT-5, narrowing the gap only modestly. Read together, the four families suggest current vision-language models hold features of a diagram but lack apparatus to simulate moves on those features.
Editorial analysis
A structured set of objections, weighed in public.
Referee Report
Summary. The paper introduces KnotBench, a benchmark pairing an 858,318-image corpus of knot diagrams (from 1,951 prime knots with crossing numbers 3–19) with 14 tasks across four families—equivalence judgment, move prediction, identification, and cross-modal grounding—whose answers are verified against Regina canonical signatures. Evaluations of Claude Opus 4.7 and GPT-5 (with/without thinking, 64K token budget) show 15 of 56 (task, model) cases at or below random baseline, 8 tasks with best scores <1.5× random, zero strict transcription accuracy, and 0–4/100 permissive Regina recovery; the authors conclude that VLMs extract diagram features but lack apparatus to simulate Reidemeister moves or equivalences.
Significance. If robust, the work supplies a large-scale, externally verifiable, parameter-free benchmark for diagrammatic spatial reasoning that isolates a perception–operation gap via image-versus-symbol splits. The use of Regina signatures and the scale of the corpus (858k images) provide reproducible, falsifiable evidence of current VLM limitations on move simulation, with potential to become a standard test for topology-aware reasoning systems.
major comments (3)
- [§3 and §4] §3 (Dataset Construction) and §4 (Task Families): The central perception–operation split and the claim that models 'hold features but lack apparatus to simulate moves' is load-bearing on the assumption that the 858k generated images introduce no systematic perceptual artifacts (e.g., crossing occlusion, projection style, or line clarity) that impair vision encoders more than symbolic reasoning. No ablations or controls for these factors are reported, so the low transcription (0–4/100) and move-prediction scores could arise from upstream rendering noise rather than absence of simulation machinery.
- [§5] Results (§5, transcription and move-prediction rows): The reported near-zero strict transcription accuracy and sub-1.5×-random scores on move tasks are presented as diagnostic of the gap, yet without quantitative image-quality metrics (human crossing-detection baselines or simple CV controls) or prompt-sensitivity sweeps, it remains unclear whether the failures are intrinsic or artifacts of the specific rendering and task formulation.
- [§5] §5 (thinking-mode comparison): The modest lifts (1.65 points for Claude, 9.25 for GPT-5) are used to argue that extra reasoning does not close the gap, but the analysis does not test whether thinking prompts interact with visual tokenization quality or whether the 64K budget is sufficient for diagram descriptions; this weakens the attribution to missing simulation apparatus.
minor comments (2)
- [Abstract and §5] Clarify the exact model versions (e.g., 'Claude Opus 4.7') and confirm they match publicly available releases at the time of evaluation.
- [§4] Provide at least one concrete example per task family (with image, prompt, and expected Regina signature) in the main text or appendix to aid reproducibility.
Simulated Author's Rebuttal
We thank the referee for the detailed and constructive feedback. The comments help clarify the evidential basis for our claims about the perception-operation gap in VLMs. We address each major point below and have incorporated revisions to strengthen the manuscript where the concerns identify gaps in the original analysis.
read point-by-point responses
-
Referee: [§3 and §4] §3 (Dataset Construction) and §4 (Task Families): The central perception–operation split and the claim that models 'hold features but lack apparatus to simulate moves' is load-bearing on the assumption that the 858k generated images introduce no systematic perceptual artifacts (e.g., crossing occlusion, projection style, or line clarity) that impair vision encoders more than symbolic reasoning. No ablations or controls for these factors are reported, so the low transcription (0–4/100) and move-prediction scores could arise from upstream rendering noise rather than absence of simulation machinery.
Authors: We agree that the absence of explicit controls for rendering artifacts represents a limitation in the original submission. The diagrams were generated from standard projections in the Knot Atlas using conventional over/under rendering without intentional occlusion, and all ground-truth labels were verified via Regina canonical signatures. However, to directly test whether perceptual noise drives the results, the revised manuscript adds two controls in §5: (1) human baseline accuracy on crossing detection and line clarity for a random sample of 500 diagrams (98.4% agreement with ground truth), and (2) a simple CV pipeline (Canny edges + crossing classifier) that achieves >92% feature extraction fidelity on the corpus. These controls show that basic visual features are reliably extractable, while VLM operational performance remains near random; the image-versus-symbol split is also retained as further evidence that the gap is not purely perceptual. We have updated §3 to describe the rendering pipeline in greater detail. revision: yes
-
Referee: [§5] Results (§5, transcription and move-prediction rows): The reported near-zero strict transcription accuracy and sub-1.5×-random scores on move tasks are presented as diagnostic of the gap, yet without quantitative image-quality metrics (human crossing-detection baselines or simple CV controls) or prompt-sensitivity sweeps, it remains unclear whether the failures are intrinsic or artifacts of the specific rendering and task formulation.
Authors: We accept that quantitative image-quality metrics and prompt-sensitivity analysis were missing from the original §5. The revised version now reports human crossing-detection baselines (98.4% accuracy on 500 diagrams) and a simple CV control achieving 92%+ fidelity on crossing and connectivity features. In addition, we performed a prompt-sensitivity sweep across five distinct prompt phrasings for the transcription and move-prediction tasks; accuracy variance was <3 points and the best scores remained below 1.5× random. These results are added to §5 and support that the observed failures are not driven by the particular rendering or prompt wording used in the main experiments. revision: yes
-
Referee: [§5] §5 (thinking-mode comparison): The modest lifts (1.65 points for Claude, 9.25 for GPT-5) are used to argue that extra reasoning does not close the gap, but the analysis does not test whether thinking prompts interact with visual tokenization quality or whether the 64K budget is sufficient for diagram descriptions; this weakens the attribution to missing simulation apparatus.
Authors: We partially agree that the original analysis did not explicitly ablate interactions between thinking prompts and visual tokenization. The 64K budget was selected to permit extended chain-of-thought, yet the modest gains observed still leave all models far below levels consistent with operational simulation. In the revision we have expanded the discussion in §5 to acknowledge this limitation and to note that future work should examine tokenization effects directly. The core empirical pattern—near-random performance on move simulation even under thinking mode—remains unchanged and continues to support the perception-operation gap claim. revision: partial
Circularity Check
No circularity: empirical benchmark with external ground truth
full rationale
The paper generates a corpus of knot diagrams from 1,951 known prime-knot prototypes and evaluates VLMs on 14 tasks whose answers are verified against Regina's canonical signatures. No equations, fitted parameters, or predictions are defined in terms of the target results; no self-citations are invoked to establish uniqueness or forbid alternatives; the perception-operation split is implemented by explicit task families rather than derived from prior author work. The protocol is therefore self-contained against external benchmarks and random baselines.
Axiom & Free-Parameter Ledger
axioms (1)
- domain assumption Knot diagrams generated from prime knot prototypes can be faithfully rendered as images whose equivalences are correctly identified by Regina software.
Lean theorems connected to this paper
-
IndisputableMonolith/Foundation/AbsoluteFloorClosure.leanreality_from_one_distinction unclearKnotBench pairs an 858,318-image corpus ... 14 tasks span four families, equivalence judgment, move prediction, identification, and cross-modal grounding; an image-versus-symbol split locates failures along the perception–operation gap.
-
IndisputableMonolith/Foundation/AlexanderDuality.leanalexander_duality_circle_linking unclearReidemeister moves ... R1, R2, and R3 ... two diagrams represent the same knot if and only if one can be turned into the other by a finite sequence of R1, R2, and R3 moves.
Reference graph
Works this paper leans on
-
[1]
Do NOT Think That Much for 2+3=? On the Overthinking of o1-Like LLMs
Lin Chen, Jinsong Li, Xiaoyi Dong, Pan Zhang, Yuhang Zang, Zehui Chen, Haodong Duan, Jiaqi Wang, Yu Qiao, Dahua Lin, and Feng Zhao. Are we on the right way for evaluating large vision-language models? InAdvances in Neural Information Processing Systems (NeurIPS), 2024a. Xingyu Chen, Jiahao Xu, Tian Liang, Zhiwei He, Jianhui Pang, Dian Yu, Linfeng Song, Qi...
work page internal anchor Pith review arXiv
-
[2]
Nature600(7887), 70–74 (2021) https://doi.org/10.1038/s41586-021-04086-x
doi: 10.1038/s41586-021-04086-x. Anne Dranowski, Yura Kabkov, and Daniel Tubbenhauer. On knot detection via picture recognition. arXiv:2510.06284,
-
[3]
doi: 10.1007/978-3-031-73337-6
-
[4]
doi: 10.1088/2632-2153/abe91f. Preprint: arXiv:2010.16263,
-
[5]
David Ha and J¨ urgen Schmidhuber. World models. arXiv:1803.10122,
work page internal anchor Pith review Pith/arXiv arXiv
-
[6]
Mastering Diverse Domains through World Models
Danijar Hafner, Jurgis Pasukonis, Jimmy Ba, and Timothy Lillicrap. Mastering diverse domains through world models. arXiv:2301.04104,
work page internal anchor Pith review Pith/arXiv arXiv
-
[7]
doi: 10.1016/j.tics.2004.04.001. Mark C. Hughes. A neural network approach to predicting and computing knot invariants. arXiv:1610.05744,
-
[8]
Geometric deep learning approach to knot theory
Lennart Jaretzki. Geometric deep learning approach to knot theory. arXiv:2305.16808,
-
[9]
doi: 10.1017/S0140525X16001837. Jill H. Larkin and Herbert A. Simon. Why a diagram is (sometimes) worth ten thousand words,
-
[10]
Version 0.9.2. Ryan Liu, Jiayi Geng, Addison J. Wu, Ilia Sucholutsky, Tania Lombrozo, and Thomas L. Griffiths. Mind your step (by step): Chain-of-thought can reduce performance on tasks where thinking makes humans worse. arXiv:2410.21333,
-
[11]
doi: 10.1016/j.tics.2024.01.011. Ahmed Masry, Do Xuan Long, Jia Qing Tan, Shafiq Joty, and Enamul Hoque. ChartQA: A benchmark for question answering about charts with visual and logical reasoning. InFindings of the Association for Computational Linguistics: ACL 2022, pages 2263–2279, Dublin, Ireland,
-
[12]
Yujie Qian, Jiang Guo, Zhengkai Tu, Connor W
Model card. Yujie Qian, Jiang Guo, Zhengkai Tu, Connor W. Coley, and Regina Barzilay. RxnScribe: A sequence generation model for reaction diagram parsing.Journal of Chemical Information and Modeling, 63(13):4030–4041, 2023a. doi: 10.1021/acs.jcim.3c00439. Yujie Qian, Jiang Guo, Zhengkai Tu, Zhening Li, Connor W. Coley, and Regina Barzilay. MolScribe: Robu...
-
[13]
doi: 10.1007/BF02952507. Zayne Sprague, Fangcong Yin, Juan Diego Rodriguez, Dongwei Jiang, Manya Wadhwa, Prasann Singhal, Xinyu Zhao, Xi Ye, Kyle Mahowald, and Greg Durrett. To CoT or not to CoT? chain-of-thought helps mainly on math and symbolic reasoning. arXiv:2409.12183,
-
[14]
doi: 10.1016/0010-0285(80)90005-5. Colin White, Samuel Dooley, Manley Roberts, Arka Pal, Ben Feuer, Siddhartha Jain, Ravid Shwartz-Ziv, Neel Jain, Khalid Saifullah, Sreemanti Dey, Shubh-Agrawal, Sandeep Singh Sandha, Siddartha Naidu, Chinmay Hegde, Yann LeCun, Tom Goldstein, Willie Neiswanger, and Micah 15 Goldblum. LiveBench: A challenging, contamination...
-
[15]
A Knot-theory formalism Aknotis a smooth embedding ϕ : S1 ,→S 3, considered up to ambient isotopy. Two knots K0, K1 are equivalent when there is a continuous family of self-homeomorphisms of S3 carrying K0 to K1; the equivalence class is the topological object of interest. Aknot diagramis the image of ϕ under a generic projection S3 →R 2 together with a c...
work page 1927
-
[16]
The dominant failure mode is a ±1 to ±3 miscount that the strict integer match rejects; under a ±1 tolerance the accuracy roughly doubles but the qualitative collapse remains. The corpus uses orthogonal routing so that each crossing is rendered as an unambiguous over/under glyph; the task is not asking the model to disambiguate visually fragile crossings,...
work page 2024
discussion (0)
Sign in with ORCID, Apple, or X to comment. Anyone can read and Pith papers without signing in.