Recognition: 2 theorem links
· Lean TheoremAre Single-Zone Emission models Sufficient to Explain GRB 220426A and GRB 230812B?
Pith reviewed 2026-05-13 01:28 UTC · model grok-4.3
The pith
Spectral width increases with time in GRB 220426A and GRB 230812B, challenging single-zone emission models.
A machine-rendered reading of the paper's core claim, the machinery that carries it, and where it could break.
Core claim
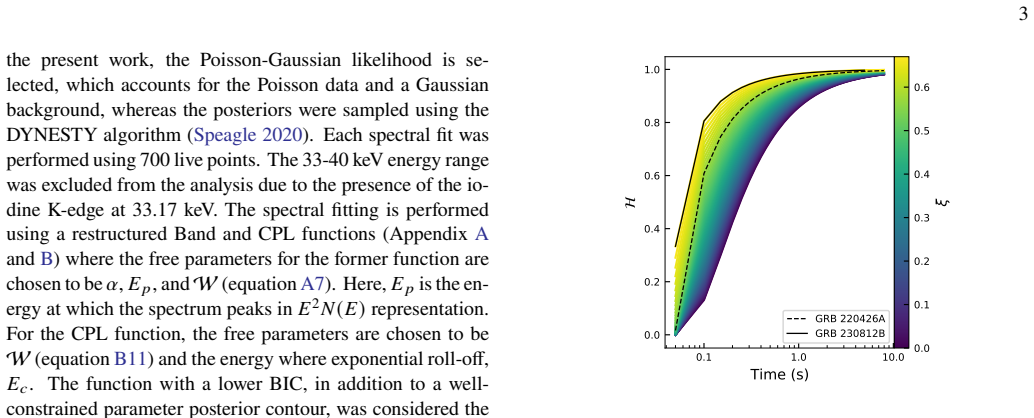
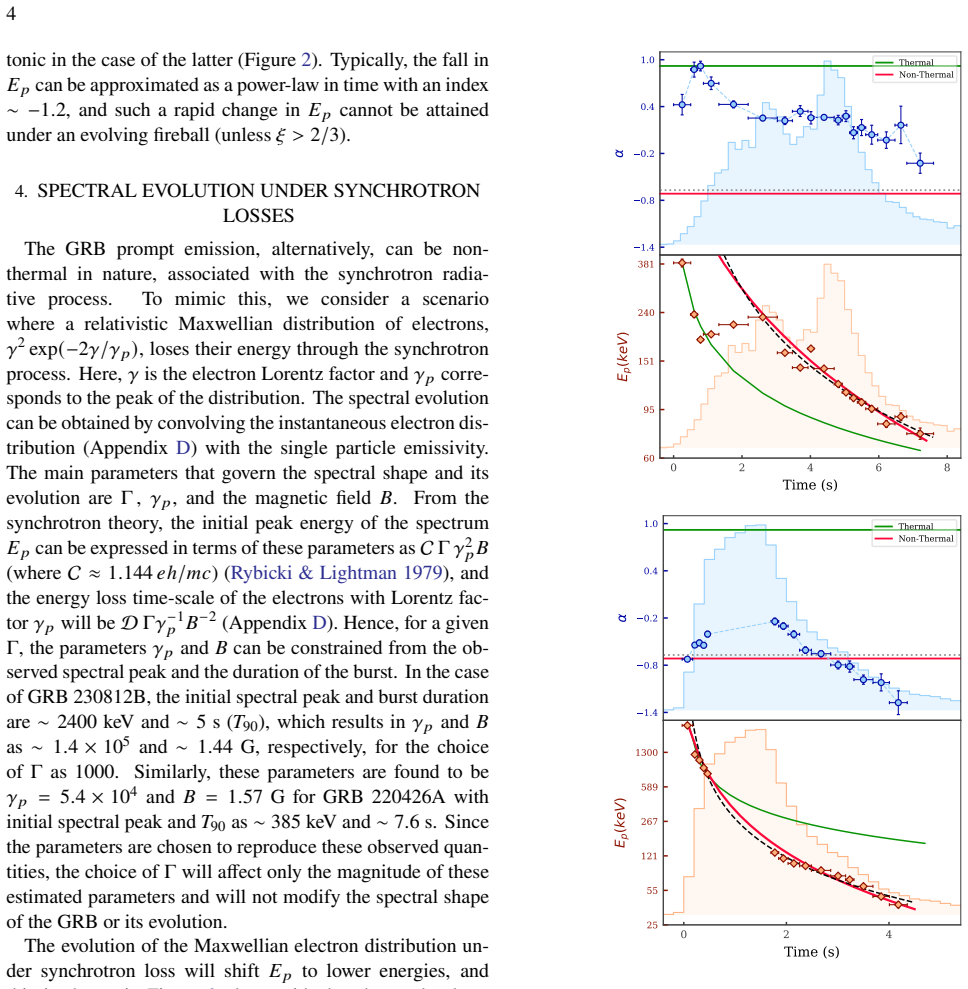
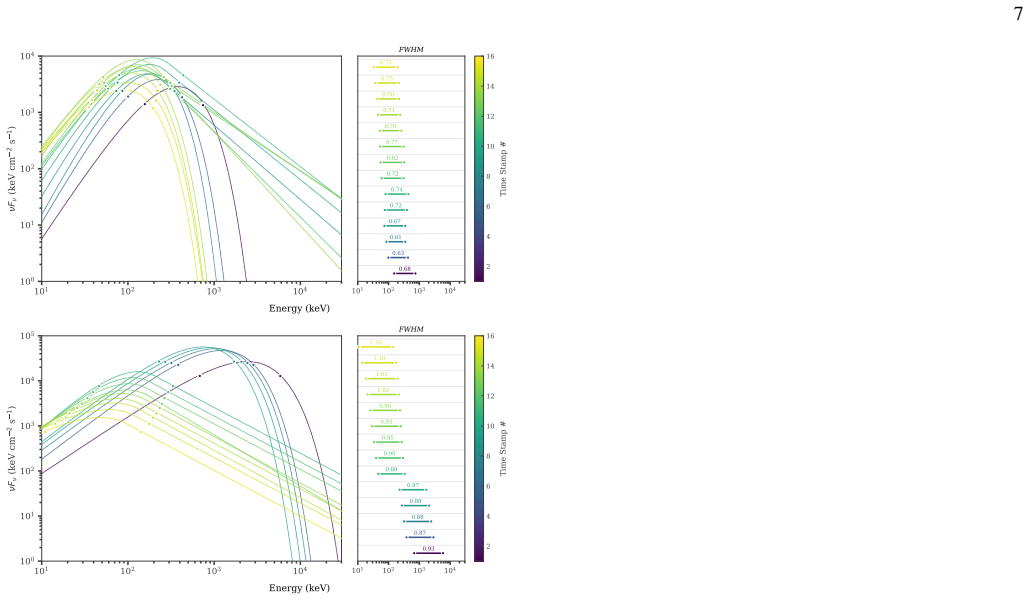
For GRB 220426A and GRB 230812B, the spectral width W, measured at half maxima, increases with time during the prompt phase. This behavior contradicts the expectations from single-zone emission models, including thermal and synchrotron scenarios, which forecast a decreasing width. The findings provide evidence that the GRB prompt phase involves the development of multiple emission zones, with their relative contributions changing over time.
What carries the argument
The spectral width W at half maximum of the GRB spectrum, which serves as a diagnostic to test emission models by tracking its time evolution.
If this is right
- Single-zone models cannot account for the observed spectral evolution in these bursts.
- The prompt emission requires multiple emission zones.
- The relative contributions from these zones vary during the burst duration.
- Inferences from spectral modeling need to consider time-dependent multi-zone effects.
Where Pith is reading between the lines
- Similar increases in W might be detectable in other well-observed GRBs with high time resolution.
- This could lead to revised models incorporating evolving jet structures or multiple dissipation sites.
- Testing with future instruments capable of finer spectral timing could confirm the multi-zone scenario.
Load-bearing premise
The claim rests on the assumption that single-zone models are incapable of producing an increasing spectral width under any choice of parameters and that the width measurements are not significantly affected by instrumental effects or background subtraction.
What would settle it
A calculation or simulation demonstrating that a single-zone model can fit the data with increasing W would disprove the need for multiple zones.
Figures


read the original abstract
Gamma-ray bursts (GRBs) are the universe's most energetic phenomena (isotropic luminosity $\sim 10^{51} - 10^{54}$ ergs/s) lasting for a very short duration ($\sim$ milliseconds - a few seconds). Even after an average of one GRB detected per day, their emission mechanism remains contentious. Inferences drawn from the empirical modelling of the GRB spectrum are often inconclusive. Some studies favor the emission from a thermal blast of hot plasma, while others suggest a synchrotron emission originating from a rapid acceleration of particles at the expense of the burst energy. Under these scenarios, the spectral width of the burst ($\mathcal{W}$), which is measured at half maxima, is expected to decrease with time. We show that for the GRB 220426A and GRB 230812B, $\mathcal{W}$ increases with time, raising serious concerns regarding the validity of these emission models. The results instead offer strong evidence that the GRB prompt phase involves the development of multiple emission zones, whose relative contributions change over time.
Editorial analysis
A structured set of objections, weighed in public.
Referee Report
Summary. The manuscript claims that the spectral width W of GRB 220426A and GRB 230812B increases with time, contrary to the predictions of single-zone thermal and synchrotron emission models which expect W to decrease. This is used to argue that the prompt emission involves multiple emission zones with changing relative contributions over time.
Significance. If the time evolution of W is accurately measured and single-zone models are shown to be incapable of producing an increasing W under any reasonable parameter evolution, the result would challenge the sufficiency of single-zone models for these GRBs and support multi-zone interpretations. This could have implications for understanding the prompt phase of GRBs. The significance is currently limited by the absence of detailed methodology, error analysis, and exhaustive model exclusion.
major comments (2)
- [Abstract] Abstract: The assertion that W increases with time for GRB 220426A and GRB 230812B supplies no data sources, measurement procedure for W at half maxima, error bars, or quantitative comparison to model predictions, leaving the central observational claim unsupported by visible evidence.
- [Abstract] Abstract: The expectation that single-zone models predict decreasing W with time is stated without an analytic derivation, reference, or exhaustive parameter scan demonstrating that no time evolution of parameters (e.g., B, gamma_min, peak energy, or viewing angle) can produce dW/dt > 0. This is load-bearing for the claim that single-zone models are insufficient.
minor comments (2)
- [Abstract] The notation for spectral width W should be explicitly defined with reference to standard GRB literature on how it is measured at half maxima.
- Consider including a table or figure with time-binned W values, uncertainties, and direct model comparisons for the two bursts to strengthen the presentation.
Simulated Author's Rebuttal
We thank the referee for their thoughtful review and for highlighting areas where the abstract could better convey the supporting evidence and reasoning. We address each major comment below. The full manuscript contains the requested details on data, methods, and model comparisons, but we agree that the abstract should be expanded for clarity. We will submit a revised version incorporating these improvements.
read point-by-point responses
-
Referee: [Abstract] Abstract: The assertion that W increases with time for GRB 220426A and GRB 230812B supplies no data sources, measurement procedure for W at half maxima, error bars, or quantitative comparison to model predictions, leaving the central observational claim unsupported by visible evidence.
Authors: We agree that the abstract is too concise and omits key supporting information. The full text specifies that the spectra are derived from Fermi-GBM data for both GRBs, with W measured as the full width at half-maximum of the fitted spectrum in each time bin. Error bars on W are obtained via Monte Carlo resampling of the spectral parameters, and the time evolution is compared quantitatively to single-zone predictions in Section 3. To address the comment, we will revise the abstract to include a brief statement on the data source, the W measurement definition, and a reference to the detailed analysis and figures in the main text. revision: yes
-
Referee: [Abstract] Abstract: The expectation that single-zone models predict decreasing W with time is stated without an analytic derivation, reference, or exhaustive parameter scan demonstrating that no time evolution of parameters (e.g., B, gamma_min, peak energy, or viewing angle) can produce dW/dt > 0. This is load-bearing for the claim that single-zone models are insufficient.
Authors: The manuscript relies on the standard result that, for both thermal (blackbody or photospheric) and synchrotron single-zone models, the spectral width W narrows as the peak energy decreases or as the emitting region cools, which is the typical time evolution in GRB prompt emission. We will add a reference to prior analytic work on GRB spectral widths (e.g., studies showing W remains narrow for synchrotron with fast cooling) and include a short derivation in the revised introduction showing that dW/dt < 0 for monotonic evolution of B, gamma_min, or E_peak under standard assumptions. An exhaustive numerical scan over all possible parameter trajectories is beyond the scope of this work and would require a separate study; however, we will add a brief discussion of why physically plausible evolutions (decreasing magnetic field strength or increasing minimum Lorentz factor) cannot produce increasing W without violating energy conservation or observed spectral shapes. revision: partial
Circularity Check
No significant circularity; central claim rests on independent observational comparison
full rationale
The paper measures the time evolution of spectral width W directly from data for GRB 220426A and GRB 230812B and contrasts it against the stated general expectation that single-zone thermal or synchrotron models produce decreasing W. No equations in the provided text reduce this expectation to a fitted parameter, self-definition, or self-citation chain that is load-bearing for the result. The derivation does not rename a known result or smuggle an ansatz via prior self-work; it performs a direct empirical test. The skeptic concern about whether the expectation is exhaustively proven is a question of model completeness, not circularity. The paper remains self-contained against external benchmarks.
Axiom & Free-Parameter Ledger
axioms (1)
- domain assumption Single-zone thermal and synchrotron models predict that spectral width W decreases with time.
Lean theorems connected to this paper
-
IndisputableMonolith/Foundation/AbsoluteFloorClosure.leanreality_from_one_distinction unclearWe show that for the GRB 220426A and GRB 230812B, W increases with time... multiple emission zones
-
IndisputableMonolith/Cost/FunctionalEquation.leanwashburn_uniqueness_aczel unclearUnder these scenarios, the spectral width of the burst (W)... is expected to decrease with time
Reference graph
Works this paper leans on
-
[1]
Atoyan, A. M., & Aharonian, F. A. 1999, MNRAS, 302, 253, doi: 10.1046/j.1365-8711.1999.02172.x
-
[2]
2015, MNRAS, 447, 3150, doi: 10.1093/mnras/stu2675
Axelsson, M., & Borgonovo, L. 2015, MNRAS, 447, 3150, doi: 10.1093/mnras/stu2675
-
[3]
1993, ApJ, 413, 281, doi: 10.1086/172995
Band, D., Matteson, J., Ford, L., et al. 1993, ApJ, 413, 281, doi: 10.1086/172995
-
[4]
Beloborodov, A. M. 2011, ApJ, 737, 68, doi: 10.1088/0004-637X/737/2/68 11 Boˇsnjak, ˇZ., Daigne, F., & Dubus, G. 2009, A&A, 498, 677, doi: 10.1051/0004-6361/200811375
-
[5]
2011, ApJ, 733, 85, doi: 10.1088/0004-637X/733/2/85
Bromberg, O., Mikolitzky, Z., & Levinson, A. 2011, ApJ, 733, 85, doi: 10.1088/0004-637X/733/2/85
-
[6]
Burgess, J. M. 2019, A&A, 629, A69, doi: 10.1051/0004-6361/201935140
-
[7]
M., B´egu´e, D., Greiner, J., et al
Burgess, J. M., B´egu´e, D., Greiner, J., et al. 2020, Nature Astronomy, 4, 174, doi: 10.1038/s41550-019-0911-z
-
[8]
Burgess, J. M., & Ryde, F. 2015, MNRAS, 447, 3087, doi: 10.1093/mnras/stu2670
-
[9]
Burgess, J. M., Ryde, F., & Yu, H.-F. 2015, MNRAS, 451, 1511, doi: 10.1093/mnras/stv775
-
[10]
2021, ApJ, 920, 53, doi: 10.3847/1538-4357/ac14b8
Chen, J.-M., Peng, Z.-Y., Du, T.-T., Yin, Y., & Wu, H. 2021, ApJ, 920, 53, doi: 10.3847/1538-4357/ac14b8
-
[11]
Chiaberge, M., & Ghisellini, G. 1999, MNRAS, 306, 551, doi: 10.1046/j.1365-8711.1999.02538.x
-
[12]
1997, ApJL, 488, L7, doi: 10.1086/310916
Cohen, E., & Piran, T. 1997, ApJL, 488, L7, doi: 10.1086/310916
-
[13]
Crider, A., Liang, E. P., Smith, I. A., et al. 1997, ApJL, 479, L39, doi: 10.1086/310574
-
[14]
2011, A&A, 526, A110, doi: 10.1051/0004-6361/201015457
Daigne, F., Boˇsnjak, ˇZ., & Dubus, G. 2011, A&A, 526, A110, doi: 10.1051/0004-6361/201015457
-
[15]
Daigne, F., & Mochkovitch, R. 1998, MNRAS, 296, 275, doi: 10.1046/j.1365-8711.1998.01305.x
-
[16]
2022, arXiv e-prints, arXiv:2205.08737, doi: 10.48550/arXiv.2205.08737
Deng, L.-T., Lin, D.-B., Zhou, L., et al. 2022, arXiv e-prints, arXiv:2205.08737, doi: 10.48550/arXiv.2205.08737
-
[17]
2014, ApJ, 785, 112, doi: 10.1088/0004-637X/785/2/112
Deng, W., & Zhang, B. 2014, ApJ, 785, 112, doi: 10.1088/0004-637X/785/2/112
-
[18]
2021, MNRAS, 504, 1939, doi: 10.1093/mnras/stab1013
Gill, R., & Granot, J. 2021, MNRAS, 504, 1939, doi: 10.1093/mnras/stab1013
-
[19]
1986, ApJL, 308, L47, doi: 10.1086/184741
Goodman, J. 1986, ApJL, 308, L47, doi: 10.1086/184741
-
[20]
2024, The Astrophysical Journal Letters, 970, L12, doi: 10.3847/2041-8213/ad5e1e
Gupta, S., & Sahayanathan, S. 2024, The Astrophysical Journal Letters, 970, L12, doi: 10.3847/2041-8213/ad5e1e
-
[21]
2025, Astronomy & Astrophysics, 701, A172, doi: 10.1051/0004-6361/202555055
Gupta, S., Gupta, R., Chattopadhayay, T., et al. 2025, Astronomy & Astrophysics, 701, A172, doi: 10.1051/0004-6361/202555055
-
[22]
Iyyani, S., Ryde, F., Burgess, J. M., Pe’er, A., & B´egu´e, D. 2016, MNRAS, 456, 2157, doi: 10.1093/mnras/stv2751
-
[23]
1997, ApJ, 490, 92, doi: 10.1086/512791
Kobayashi, S., Piran, T., & Sari, R. 1997, ApJ, 490, 92, doi: 10.1086/512791
-
[24]
2013, MNRAS, 428, 2430, doi: 10.1093/mnras/sts219
Lundman, C., Pe’er, A., & Ryde, F. 2013, MNRAS, 428, 2430, doi: 10.1093/mnras/sts219
-
[25]
2022, GRB Coordinates Network, 31955, 1
Malacaria, C., Meegan, C., & Fermi GBM Team. 2022, GRB Coordinates Network, 31955, 1
work page 2022
-
[26]
Meszaros, P., & Rees, M. J. 1993, ApJ, 405, 278, doi: 10.1086/172360
-
[27]
2011, ApJ, 732, 26, doi: 10.1088/0004-637X/732/1/26
Mizuta, A., Nagataki, S., & Aoi, J. 2011, ApJ, 732, 26, doi: 10.1088/0004-637X/732/1/26
-
[28]
1986, ApJL, 308, L43, doi: 10.1086/184740 Pe’er, A
Paczynski, B. 1986, ApJL, 308, L43, doi: 10.1086/184740 Pe’er, A. 2008, ApJ, 682, 463, doi: 10.1086/588136 Pe’er, A., & Zhang, B. 2006, ApJ, 653, 454, doi: 10.1086/508681 Pe’Er, A., Zhang, B.-B., Ryde, F., et al. 2012, MNRAS, 420, 468, doi: 10.1111/j.1365-2966.2011.20052.x
-
[29]
1999, PhR, 314, 575, doi: 10.1016/S0370-1573(98)00127-6
Piran, T. 1999, PhR, 314, 575, doi: 10.1016/S0370-1573(98)00127-6
-
[30]
1993, MNRAS, 263, 861, doi: 10.1093/mnras/263.4.861
Piran, T., Shemi, A., & Narayan, R. 1993, MNRAS, 263, 861, doi: 10.1093/mnras/263.4.861
-
[31]
Preece, R. D., Briggs, M. S., Mallozzi, R. S., et al. 1998, ApJL, 506, L23, doi: 10.1086/311644
-
[32]
Rees, M. J. 1978, MNRAS, 184, 61P, doi: 10.1093/mnras/184.1.61P
-
[33]
Rees, M. J., & Meszaros, P. 1994, ApJL, 430, L93, doi: 10.1086/187446
-
[34]
Rees, M. J., & M´esz´aros, P. 2005, ApJ, 628, 847, doi: 10.1086/430818
-
[35]
J., Cleveland, W., & Fermi GBM Team
Roberts, O. J., Cleveland, W., & Fermi GBM Team. 2024, GRB Coordinates Network, 35660, 1
work page 2024
-
[36]
J., Meegan, C., Lesage, S., et al
Roberts, O. J., Meegan, C., Lesage, S., et al. 2023, GRB Coordinates Network, 34391, 1
work page 2023
-
[37]
Ruffini, R., Siutsou, I. A., & Vereshchagin, G. V. 2013, ApJ, 772, 11, doi: 10.1088/0004-637X/772/1/11
-
[38]
Rybicki, G. B., & Lightman, A. P. 1979, Radiative processes in astrophysics
work page 1979
-
[39]
1997, MNRAS, 287, 110, doi: 10.1093/mnras/287.1.110
Sari, R., & Piran, T. 1997, MNRAS, 287, 110, doi: 10.1093/mnras/287.1.110
-
[40]
1998, ApJL, 497, L17, doi: 10.1086/311269
Sari, R., Piran, T., & Narayan, R. 1998, ApJL, 497, L17, doi: 10.1086/311269
-
[41]
Scargle, J. D. 1998, The Astrophysical Journal, 504, 405
work page 1998
-
[42]
2019, ApJL, 882, L10, doi: 10.3847/2041-8213/ab3a48
Sharma, V., Iyyani, S., Bhattacharya, D., et al. 2019, ApJL, 882, L10, doi: 10.3847/2041-8213/ab3a48
-
[43]
Spada, M., Ghisellini, G., Lazzati, D., & Celotti, A. 2001, MNRAS, 325, 1559, doi: 10.1046/j.1365-8711.2001.04557.x
-
[44]
Speagle, J. S. 2020, Monthly Notices of the Royal Astronomical Society, 493, 3132, doi: 10.1093/mnras/staa278
-
[45]
1996, ApJ, 466, 768, doi: 10.1086/177551
Tavani, M. 1996, ApJ, 466, 768, doi: 10.1086/177551
-
[46]
Uhm, Z. L., & Zhang, B. 2014, Nature Physics, 10, 351, doi: 10.1038/nphys2932 —. 2015, ApJ, 808, 33, doi: 10.1088/0004-637X/808/1/33
-
[47]
2013, ApJ, 764, 143, doi: 10.1088/0004-637X/764/2/143
Vurm, I., Lyubarsky, Y., & Piran, T. 2013, ApJ, 764, 143, doi: 10.1088/0004-637X/764/2/143
-
[48]
Yu, H.-F., Preece, R. D., Greiner, J., et al. 2016, A&A, 588, A135, doi: 10.1051/0004-6361/201527509
-
[49]
2011, ApJ, 726, 90, doi: 10.1088/0004-637X/726/2/90
Zhang, B., & Yan, H. 2011, ApJ, 726, 90, doi: 10.1088/0004-637X/726/2/90
-
[50]
2016, ApJ, 816, 72, doi: 10.3847/0004-637X/816/2/72
Zhang, B. 2016, ApJ, 816, 72, doi: 10.3847/0004-637X/816/2/72
-
[51]
2011, ApJ, 730, 141, doi: 10.1088/0004-637X/730/2/141
Zhang, B.-B., Zhang, B., Liang, E.-W., et al. 2011, ApJ, 730, 141, doi: 10.1088/0004-637X/730/2/141
-
[52]
B., Zhang, B., Castro-Tirado, A
Zhang, B. B., Zhang, B., Castro-Tirado, A. J., et al. 2018, Nature Astronomy, 2, 69, doi: 10.1038/s41550-017-0309-8
discussion (0)
Sign in with ORCID, Apple, or X to comment. Anyone can read and Pith papers without signing in.