Recognition: 2 theorem links
· Lean TheoremTowards Affordable Energy: A Gymnasium Environment for Electric Utility Demand-Response Programs
Pith reviewed 2026-05-13 04:10 UTC · model grok-4.3
The pith
A new open-source Gymnasium environment called DR-Gym lets utilities train reinforcement learning agents on demand-response decisions that account for customer responses to pricing.
A machine-rendered reading of the paper's core claim, the machinery that carries it, and where it could break.
Core claim
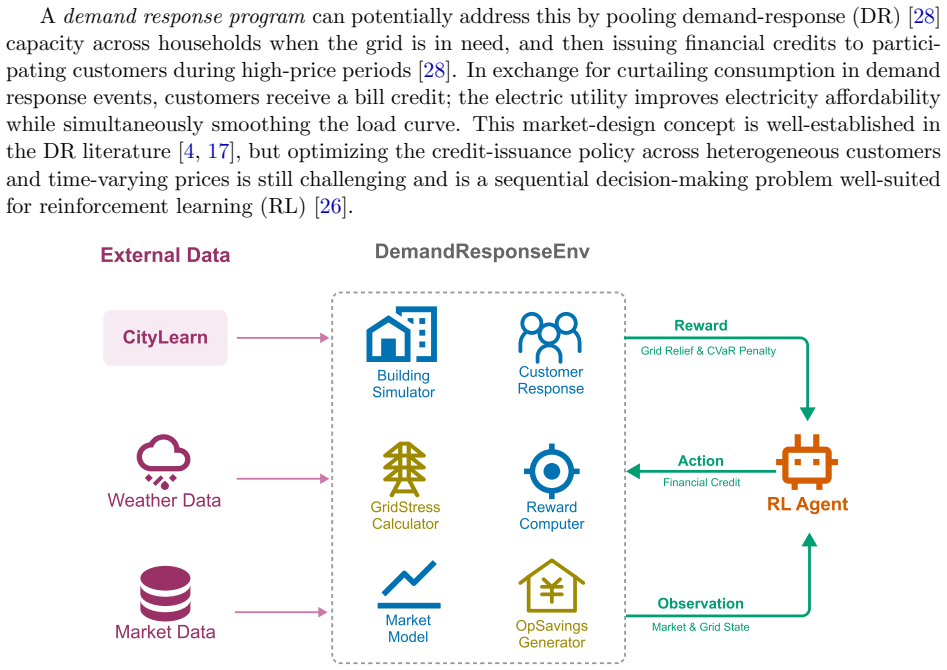
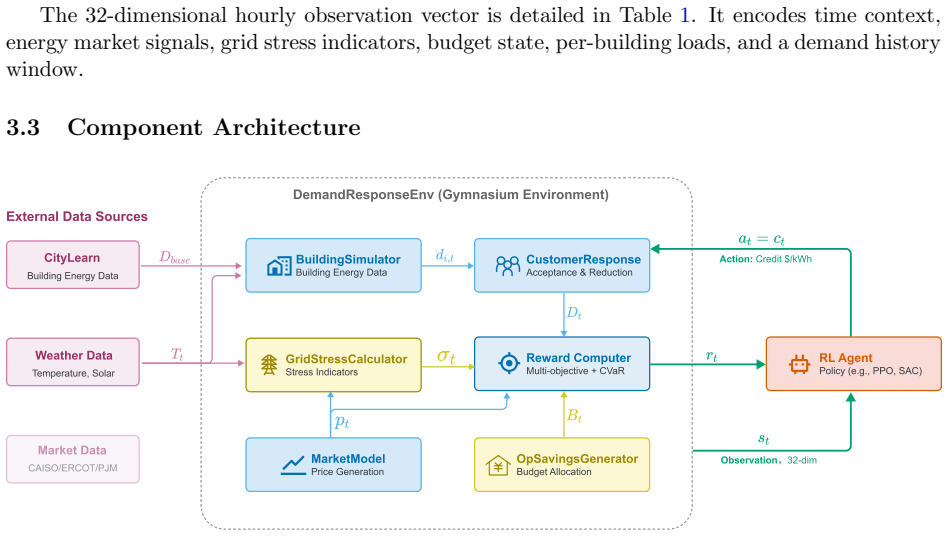
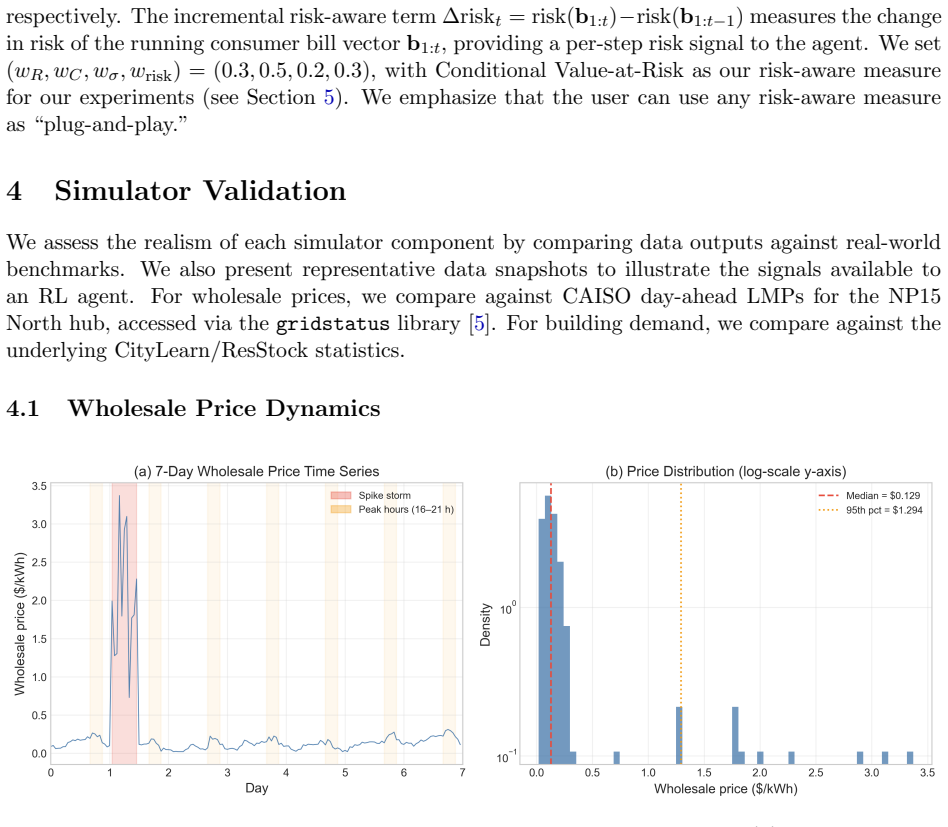
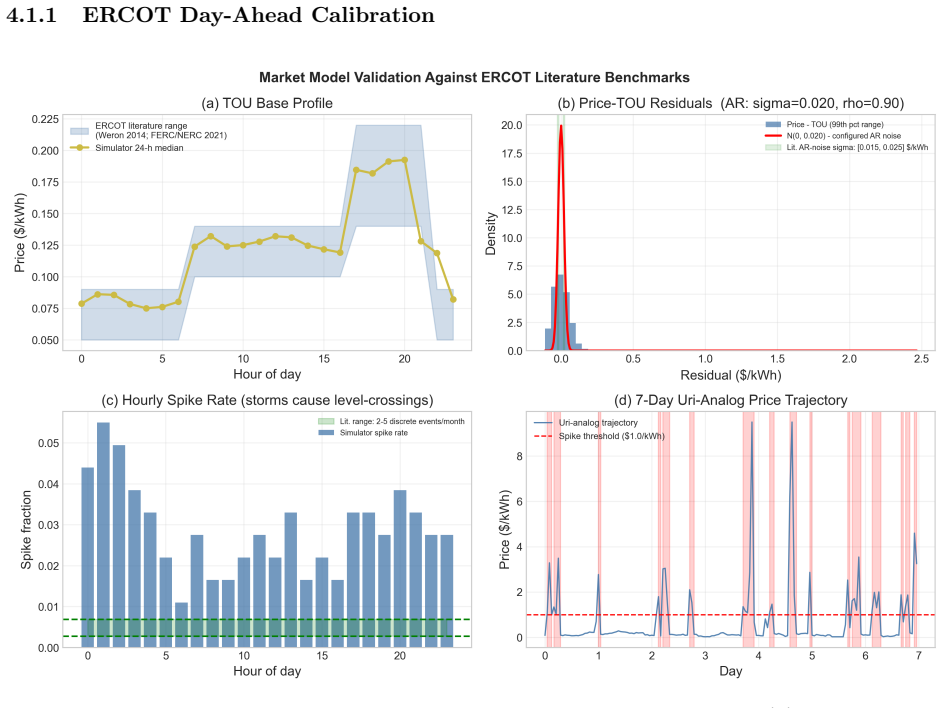
We introduce DR-Gym, an open-source, online Gymnasium-compatible environment designed to train and evaluate demand-response from the electric utility's perspective. Unlike existing device-level energy simulators, our environment focuses on the market-level electric utility setting and provides a rich observational space relevant to the electric utility. The simulator additionally features a regime-switching wholesale price model calibrated to real-world extreme events, alongside physics-based building demand profiles. For our learning signal, we use a configurable, multi-objective reward function for specifying diverse learning objectives. We demonstrate through baseline strategies and data
What carries the argument
DR-Gym, the Gymnasium-compatible simulator that models interactive feedback between utility pricing signals and customer demand using regime-switching wholesale prices and physics-based building profiles.
Load-bearing premise
The regime-switching wholesale price model calibrated to real-world extreme events together with physics-based building demand profiles sufficiently capture the interactive feedback between utility pricing signals and customer acceptance.
What would settle it
A direct comparison of demand reductions produced by the simulator under specific pricing policies against measured outcomes from an actual utility demand-response trial.
Figures


read the original abstract
Extreme weather and volatile wholesale electricity markets expose residential consumers to catastrophic financial risks, yet demand response at the distribution level remains an underutilized tool for grid flexibility and energy affordability. While a demand-response program can shield consumers by issuing financial credits during high-price periods, optimizing this sequential decision-making process presents a unique challenge for reinforcement learning despite the plentiful offline historical smart meter and wholesale pricing data available publicly. Offline historical data fails to capture the dynamic, interactive feedback loop between an electric utility's pricing signals and customer acceptance and adaptation to a demand-response program. To address this, we introduce DR-Gym, an open-source, online Gymnasium-compatible environment designed to train and evaluate demand-response from the electric utility's perspective. Unlike existing device-level energy simulators, our environment focuses on the market-level electric utility setting and provides a rich observational space relevant to the electric utility. The simulator additionally features a regime-switching wholesale price model calibrated to real-world extreme events, alongside physics-based building demand profiles. For our learning signal, we use a configurable, multi-objective reward function for specifying diverse learning objectives. We demonstrate through baseline strategies and data snapshots the capability of our simulator to create realistic and learnable environments.
Editorial analysis
A structured set of objections, weighed in public.
Referee Report
Summary. The manuscript presents DR-Gym, a new open-source Gymnasium environment for simulating and optimizing demand-response programs from the electric utility's perspective. It includes a regime-switching wholesale price model calibrated to extreme events, physics-based building demand profiles, and a configurable multi-objective reward function. The environment is intended to model the interactive feedback between utility pricing and customer responses, enabling RL training where offline data falls short. Baseline strategies are shown to illustrate its use.
Significance. Should the simulator prove realistic, it would offer a valuable platform for developing and benchmarking RL algorithms for demand response, potentially aiding in mitigating financial risks from volatile energy prices and enhancing grid flexibility. The open-source and Gymnasium-compatible design promotes accessibility and reproducibility in the field. The shift to market-level utility focus distinguishes it from device-level simulators.
major comments (2)
- [Abstract] The central claim that DR-Gym captures the dynamic interactive feedback loop between pricing signals and customer acceptance relies on the regime-switching price model and physics-based profiles, yet no quantitative validation metrics, error analysis, or comparisons to real-world customer response data (e.g., smart-meter data under DR programs) are provided. This leaves the fidelity of the modeled interactions unverified.
- [Demonstration of baseline strategies] The provided demonstrations consist only of baseline strategies and data snapshots without any quantitative assessment of how well the simulated load shifts or acceptance rates match empirical outcomes from actual demand-response programs.
Simulated Author's Rebuttal
We thank the referee for the constructive and detailed review. We address each major comment below and describe the revisions we intend to incorporate to improve the manuscript.
read point-by-point responses
-
Referee: [Abstract] The central claim that DR-Gym captures the dynamic interactive feedback loop between pricing signals and customer acceptance relies on the regime-switching price model and physics-based profiles, yet no quantitative validation metrics, error analysis, or comparisons to real-world customer response data (e.g., smart-meter data under DR programs) are provided. This leaves the fidelity of the modeled interactions unverified.
Authors: We agree that the absence of quantitative validation metrics, error analysis, or direct comparisons to real-world smart-meter data from operational DR programs leaves the fidelity of the modeled pricing-customer interaction unverified. The manuscript grounds the price component in a regime-switching process calibrated to historical extreme events and uses physics-based building demand models, but does not provide empirical benchmarks for customer acceptance rates or load-shift magnitudes. In the revised manuscript we will add a dedicated limitations subsection that explicitly states these gaps, includes sensitivity analysis on the acceptance parameters, and outlines feasible validation pathways using publicly available DR program reports where direct smart-meter traces are unavailable. revision: yes
-
Referee: [Demonstration of baseline strategies] The provided demonstrations consist only of baseline strategies and data snapshots without any quantitative assessment of how well the simulated load shifts or acceptance rates match empirical outcomes from actual demand-response programs.
Authors: The baseline demonstrations are intended to illustrate environment usability and task learnability rather than to serve as empirical validation. We acknowledge that they lack quantitative metrics comparing simulated load shifts and acceptance rates to outcomes reported in the DR literature. In the revision we will expand the demonstration section with additional performance tables that report load-shift percentages and acceptance fractions under the baseline policies, together with a brief comparison to typical ranges cited in utility DR program evaluations, while clearly noting that these remain illustrative rather than statistically validated against proprietary smart-meter datasets. revision: yes
Circularity Check
No circularity: environment creation with inputs stated as such
full rationale
The paper's core contribution is the creation and release of the DR-Gym simulator rather than any derivation, theorem, or prediction. The regime-switching wholesale price model and physics-based building profiles are explicitly presented as calibrated inputs and features of the environment, not as outputs or predictions derived from the simulator itself. Baseline strategy demonstrations are described as illustrative snapshots without any claim that they constitute fitted predictions or self-referential results. No equations, uniqueness theorems, or self-citations are invoked in a load-bearing way that would reduce the central claim to its own inputs by construction. The work is therefore self-contained as an engineering artifact.
Axiom & Free-Parameter Ledger
free parameters (2)
- regime-switching wholesale price parameters
- multi-objective reward weights
axioms (1)
- domain assumption Physics-based building demand profiles plus historical smart-meter patterns can approximate real customer responses to pricing signals
Lean theorems connected to this paper
-
IndisputableMonolith/Cost/FunctionalEquation.leanwashburn_uniqueness_aczel unclearWe model the electric utility’s decision problem as an episodic Markov Decision Process (MDP) M=⟨S,A,P,R,γ⟩... regime-switching wholesale price model... heterogeneous customer response model with dynamic behavioral fatigue
-
IndisputableMonolith/Foundation/RealityFromDistinction.leanreality_from_one_distinction unclearphysics-based building demand profiles from CityLearn’s EnergyPlus/ResStock dataset... configurable, multi-objective reward function
Reference graph
Works this paper leans on
-
[1]
URLhttps://www.eia.gov/todayinenergy/detail.php?id=55139#
Lori Antini, Jan 2023. URLhttps://www.eia.gov/todayinenergy/detail.php?id=55139#
work page 2023
-
[2]
Ioannis Antonopoulos, Valentin Robu, Benoit Couraud, Desen Kirli, Sonam Norbu, Aris- tides Kiprakis, David Flynn, Salvador Elizondo-Gonzalez, Steve Wattam, and Merlinda An- doni. Artificial intelligence and machine learning approaches to energy demand-side response: A systematic review.Renewable and Sustainable Energy Reviews, 130:109899, 2020. doi: 10.10...
-
[3]
Retail demand response in Southwest Power Pool
Ranjit Bharvirkar, Charles Goldman, Grayson Heffner, and Richard Sedano. Retail demand response in Southwest Power Pool. Technical Report LBNL-1470E, Lawrence Berkeley Na- tional Laboratory, 2009. URLhttps://eta-publications.lbl.gov/sites/default/files/ report-lbnl-1470e.pdf
work page 2009
-
[4]
Dynamic pricing, advanced meter- ing, and demand response in electricity markets
Severin Borenstein, Michael Jaske, and Arthur Rosenfeld. Dynamic pricing, advanced meter- ing, and demand response in electricity markets. Technical Report CSEM WP 105, Center for the Study of Energy Markets, UC Berkeley, 2002. URLhttps://escholarship.org/uc/ item/11w8d6m4
work page 2002
-
[5]
gridstatus: Extract data from isos and other energy grid sources,
Fiona Burlig and Others. gridstatus: Extract data from isos and other energy grid sources,
-
[6]
URLhttps://github.com/gridstatus/gridstatus
-
[7]
Alejandro Campoy-Nieves, Antonio Manjavacas, Javier Jim´ enez-Raboso, Miguel Molina- Solana, and Juan G´ omez-Romero. Sinergym – a virtual testbed for building energy op- timization with reinforcement learning.Energy and Buildings, 327:115075, January 2025. ISSN 0378-7788. doi: 10.1016/j.enbuild.2024.115075. URLhttp://dx.doi.org/10.1016/j. enbuild.2024.115075
-
[8]
Drury B. Crawley, Linda K. Lawrie, Frederick C. Winkelmann, W. F. Buhl, Y. Joe Huang, Curtis O. Pedersen, Richard K. Strand, Richard J. Liesen, Daniel E. Fisher, Michael J. Witte, and Jason Glazer. EnergyPlus: Creating a new-generation building energy simulation program. 14 Energy and Buildings, 33(4):319–331, 2001. doi: 10.1016/S0378-7788(00)00114-6. URL...
-
[9]
Will Dabney, Mark Rowland, Marc G. Bellemare, and R´ emi Munos. Distributional reinforce- ment learning with quantile regression. InProceedings of the Thirty-Second AAAI Conference on Artificial Intelligence, pages 2892–2901, 2018. URLhttps://arxiv.org/abs/1710.10044
-
[10]
Farama Foundation. Gymnasium: A standard interface for reinforcement learning environ- ments.https://gymnasium.farama.org, 2023
work page 2023
-
[11]
Ahmad Faruqui and Sanem Sergici. Household response to dynamic pricing of electric- ity: a survey of 15 experiments.Journal of Regulatory Economics, 38(2):193–225, 2010. doi: 10.1007/s11149-010-9127-y. URLhttps://link.springer.com/article/10.1007/ s11149-010-9127-y
-
[12]
The February 2021 cold weather out- ages in Texas and the south central United States
Federal Energy Regulatory Commission (FERC) and North American Elec- tric Reliability Corporation (NERC). The February 2021 cold weather out- ages in Texas and the south central United States. Technical report, FERC and NERC, November 2021. URLhttps://www.ferc.gov/news-events/news/ final-report-february-2021-freeze-underscores-winterization-recommendations
work page 2021
-
[13]
A comprehensive survey on safe reinforcement learning
Javier Garcia and Fernando Fernandez. A comprehensive survey on safe reinforcement learning. Journal of Machine Learning Research, 16(42):1437–1480, 2015. URLhttp://jmlr.org/ papers/v16/garcia15a.html
work page 2015
-
[14]
Girish Ghatikar, Mary Ann Piette, and John H. Dudley. Demand response opportunities and enabling technologies for data centers: Findings from field studies. Technical Report LBNL- 1004492, Lawrence Berkeley National Laboratory, 2012. URLhttps://gridintegration. lbl.gov/publications/demand-response-opportunities-and
work page 2012
-
[15]
Haider Tarish Haider, Ong Hang See, and Wilfried Elmenreich. A review of residen- tial demand response of smart grid.Renewable and Sustainable Energy Reviews, 59:166– 178, 2016. ISSN 1364-0321. doi: https://doi.org/10.1016/j.rser.2016.01.016. URLhttps: //www.sciencedirect.com/science/article/pii/S1364032116000447
-
[16]
Gonzague Henri, Tanguy Levent, Avishai Halev, R´ eda Alami, and Philippe Cordier. pymgrid: An open-source python microgrid simulator for applied artificial intelligence research.CoRR, abs/2011.08004, 2020. URLhttps://arxiv.org/abs/2011.08004
-
[17]
Regime jumps in electricity prices.Energy Economics, 25 (5):425–434, 2003
Ronald Huisman and Ronald Mahieu. Regime jumps in electricity prices.Energy Economics, 25 (5):425–434, 2003. doi: 10.1016/S0140-9883(03)00041-0. URLhttps://www.sciencedirect. com/science/article/abs/pii/S0140988303000410
-
[18]
Kirschen and Goran Strbac.Fundamentals of Power System Economics
Daniel S. Kirschen and Goran Strbac.Fundamentals of Power System Economics. John Wiley & Sons, 1st edition, 2004. ISBN 0-470-84572-4. URLhttps://onlinelibrary.wiley.com/ doi/book/10.1002/0470020598
-
[19]
D.S. Kirschen. Demand-side view of electricity markets.IEEE Transactions on Power Systems, 18(2):520–527, 2003. doi: 10.1109/TPWRS.2003.810692
-
[20]
Learning 15 to run a power network challenge: a retrospective analysis
Antoine Marot, Benjamin Donnot, Gabriel Dulac-Arnold, Adrian Kelly, Aidan O’Sullivan, Jan Viebahn, Mariette Awad, Isabelle Guyon, Patrick Panciatici, and Camilo Romero. Learning 15 to run a power network challenge: a retrospective analysis. In Hugo Jair Escalante and Katja Hofmann, editors,Proceedings of the NeurIPS 2020 Competition and Demonstration Trac...
work page 2020
-
[21]
URLhttps://proceedings.mlr.press/v133/marot21a.html
-
[22]
Mohsen Parsa Moghaddam, Abdolreza Abdollahi, and Masoud Rashidinejad. Flexible de- mand response programs modeling in competitive electricity markets.Applied Energy, 88 (9):3257–3269, 2011. URLhttps://www.sciencedirect.com/science/article/abs/pii/ S0306261911000638
work page 2011
-
[23]
James Nicolaisen, Valentin Petrov, and Leigh Tesfatsion. Market power and efficiency in a computational electricity market with discriminatory double-auction pricing.IEEE Transac- tions on Evolutionary Computation, 5(5):504–523, 2001. URLhttps://www.researchgate. net/publication/3418664
-
[24]
Antonin Raffin, Ashley Hill, Adam Gleave, Anssi Kanervisto, Maximilian Ernestus, and Noah Dormann. Stable-Baselines3: Reliable reinforcement learning implementations.Journal of Ma- chine Learning Research, 22(268):1–8, 2021. URLhttps://jmlr.org/papers/v22/20-1364. html
work page 2021
-
[25]
Tyrrell Rockafellar and Stanislav Uryasev
R. Tyrrell Rockafellar and Stanislav Uryasev. Optimization of conditional value-at-risk.Jour- nal of Risk, 2(3):21–41, 2000. doi: 10.21314/JOR.2000.038. URLhttps://sites.math. washington.edu/~rtr/papers/rtr179-CVaR1.pdf
-
[26]
Richard S. Sutton and Andrew G. Barto.Reinforcement Learning: An Introduction. The MIT Press, Cambridge, MA, 2nd edition, 2018. URLhttp://incompleteideas.net/book/ the-book-2nd.html
work page 2018
-
[27]
Optimizing the CVaR via sampling
Aviv Tamar, Yonatan Glassner, and Shie Mannor. Optimizing the CVaR via sampling. In Proceedings of the AAAI Conference on Artificial Intelligence, volume 29, 2015. URLhttps: //arxiv.org/abs/1404.3862
-
[28]
Jasper van Tilburg, Luciano C. Siebert, and Jochen L. Cremer. Marl-idr: Multi-agent rein- forcement learning for incentive-based residential demand response. In2023 IEEE Belgrade PowerTech, pages 1–8, 2023. doi: 10.1109/PowerTech55446.2023.10202941
-
[29]
V´ azquez-Canteli, J´ erˆ ome K¨ ampf, Gregor Henze, and Zoltan Nagy
Jos´ e R. V´ azquez-Canteli, J´ erˆ ome K¨ ampf, Gregor Henze, and Zoltan Nagy. CityLearn v1.0: An OpenAI Gym environment for demand response with deep reinforcement learn- ing. InProceedings of the 6th ACM International Conference on Systems for Energy-Efficient Buildings, Cities, and Transportation (BuildSys ’19), pages 356–357. ACM, 2019. doi: 10.1145/...
-
[30]
V´ azquez-Canteli and Zolt´ an Nagy
Jos´ e R. V´ azquez-Canteli and Zolt´ an Nagy. Reinforcement learning for demand response: A review of algorithms and modeling techniques.Applied Energy, 235:1072–1089, 2019. ISSN 0306-2619. doi: https://doi.org/10.1016/j.apenergy.2018.11.002. URLhttps://www. sciencedirect.com/science/article/pii/S0306261918317082
-
[31]
Rafa l Weron. Electricity price forecasting: A review of the state-of-the-art with a look into the future.International Journal of Forecasting, 30(4):1030–1081, 2014. doi: 10. 1016/j.ijforecast.2014.08.008. URLhttps://www.sciencedirect.com/science/article/ pii/S0169207014001083. 16
work page 2014
-
[32]
End-use load profiles for the U.S
Eric Wilson, Andrew Parker, Anthony Fontanini, Elaina Present, Janet Reyna, Rajendra Ad- hikari, Matthew Dahlhausen, Janghyun Kim, Amy LeBar, Liang Liu, et al. End-use load profiles for the U.S. building stock. Technical Report NREL/TP-5500-80889, National Renew- able Energy Laboratory, 2022. URLhttps://www.nrel.gov/docs/fy22osti/80889.pdf. 17 A Observati...
work page 2022
discussion (0)
Sign in with ORCID, Apple, or X to comment. Anyone can read and Pith papers without signing in.