Recognition: 2 theorem links
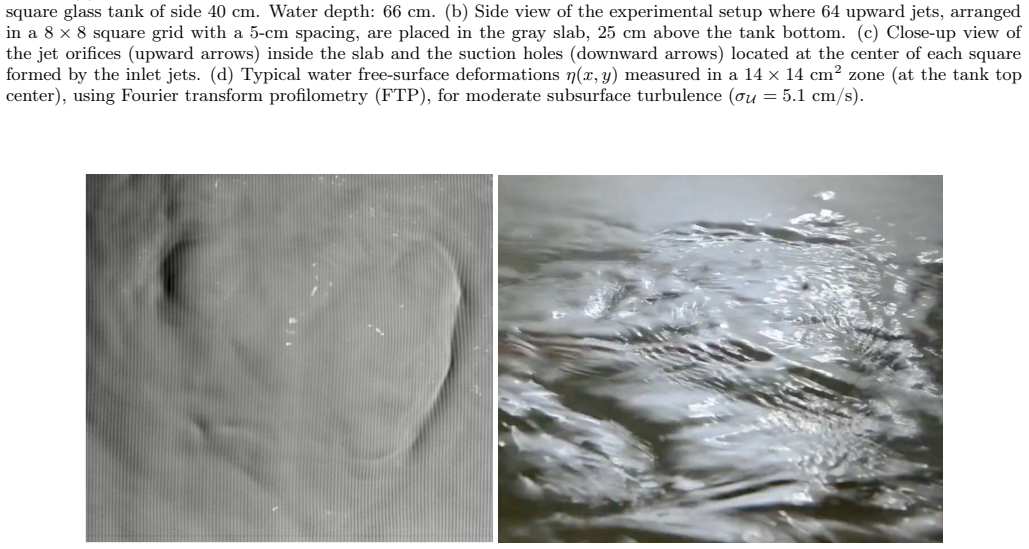
· Lean TheoremFree-surface deformations induced by three-dimensional turbulence
Pith reviewed 2026-05-14 17:56 UTC · model grok-4.3
The pith
Free-surface deformations scale linearly with subsurface turbulent velocity fluctuations.
A machine-rendered reading of the paper's core claim, the machinery that carries it, and where it could break.
Core claim
The root-mean-square amplitude of free-surface deformations grows linearly with the root-mean-square subsurface velocity fluctuations. Wavenumber and frequency spectra of surface elevation both decay as power laws with exponent -2.5, consistent with advection of turbulent structures. A linear transfer function from subsurface pressure to surface height, incorporating wave-turbulent damping, predicts the observed spatiotemporal spectrum shape with exponent -7/3 and establishes that the passive response mechanism dominates over any active wave generation.
What carries the argument
The linear transfer function relating surface elevation to subsurface turbulent pressure fluctuations with wave-turbulent damping.
Load-bearing premise
The surface response remains linear and passive to subsurface pressure fluctuations, valid only when turbulent velocities stay below the surface-breaking threshold.
What would settle it
Measure surface deformation amplitude at turbulent intensities approaching the surface-breaking threshold and test whether the linear scaling with subsurface velocity fluctuations continues without deviation.
Figures


read the original abstract
We report the experimental characterization of free-surface deformations generated by three-dimensional homogeneous and isotropic turbulence. Using Fourier transform profilometry in a jet-forced turbulent tank, we perform spatiotemporal measurements of the surface elevation field over a wide range of turbulence intensities. The standard deviation of surface deformations scales linearly with subsurface velocity fluctuations. The spectra of surface deformations highlight the coexistence of two mechanisms: transient coherent structures (e.g., upwelling) contributing to the low-frequency, large-scale spectral components, and a passive response to subsurface turbulent pressure fluctuations responsible for the power-law spectral scaling. The wavenumber and frequency spectra of surface deformations exhibit similar power-law exponents (-2.5), suggesting the advection of turbulent structures at the free surface. We develop a linear response model based on the transfer function from the free surface to turbulent pressure fluctuations, incorporating wave-turbulent damping. The model successfully predicts the main features of the turbulent surface: spatiotemporal spectrum shape, similar spectrum power-law exponents (-7/3), and dominance of passive response over wave generation. These findings provide new insights into free-surface turbulence in regimes where turbulent velocities remain below the surface-breaking threshold.
Editorial analysis
A structured set of objections, weighed in public.
Referee Report
Summary. The manuscript experimentally characterizes free-surface deformations induced by three-dimensional homogeneous isotropic turbulence in a jet-forced tank using Fourier transform profilometry over a range of turbulence intensities. It reports that the standard deviation of surface elevation scales linearly with subsurface velocity fluctuations. Wavenumber and frequency spectra of surface deformations both exhibit power-law scaling with exponent -2.5, attributed to advection of turbulent structures. A linear response model based on the transfer function from subsurface pressure fluctuations to surface elevation, incorporating wave-turbulent damping, is proposed; this model is said to predict the observed spatiotemporal spectral shape with exponents -7/3 and the dominance of passive response over wave generation below the surface-breaking threshold.
Significance. If the central claims hold after resolution of the scaling inconsistency, the work would deliver valuable experimental data on free-surface turbulence mechanisms, clearly separating contributions from coherent structures and passive pressure response via spatiotemporal spectra. The linear response model with damping provides a predictive framework for spectral features that could inform air-sea interaction models and engineering applications. The wide intensity range and direct spectral comparisons are strengths that would strengthen the field if the model-experiment consistency is established.
major comments (2)
- [Abstract and experimental results] The reported linear scaling of surface deformation standard deviation with subsurface velocity fluctuations (Abstract) is inconsistent with the linear passive response model. Turbulent pressure fluctuations obey δp_rms ∼ ρ u_rms² from the Poisson equation for incompressible flow; a linear transfer function must therefore produce η_rms ∼ u_rms². The observed linear dependence cannot be recovered from the model without introducing u-dependent nonlinearity or damping, which directly violates the linearity assumption invoked for the transfer-function construction and undermines the claim that passive response accounts for the deformations.
- [Linear response model] § on linear response model: the transfer function with wave-turbulent damping is stated to predict the spatiotemporal spectrum shape and -7/3 exponents. It is unclear whether this model was tested against the rms scaling data or only the spectral shape; explicit comparison showing how the single free parameter (damping coefficient) simultaneously reproduces both the linear rms scaling and the spectral exponents is needed to support the dominance of the passive mechanism.
minor comments (1)
- [Abstract] The abstract states that spectra exhibit 'similar power-law exponents (-2.5)' and the model gives '(-7/3)'; specifying whether these are measured fits or theoretical predictions, and reporting the fitting ranges and uncertainties, would improve precision.
Simulated Author's Rebuttal
We thank the referee for the thorough review and valuable feedback on our manuscript. We address each major comment below and will make revisions to improve the clarity and consistency of our claims.
read point-by-point responses
-
Referee: [Abstract and experimental results] The reported linear scaling of surface deformation standard deviation with subsurface velocity fluctuations (Abstract) is inconsistent with the linear passive response model. Turbulent pressure fluctuations obey δp_rms ∼ ρ u_rms² from the Poisson equation for incompressible flow; a linear transfer function must therefore produce η_rms ∼ u_rms². The observed linear dependence cannot be recovered from the model without introducing u-dependent nonlinearity or damping, which directly violates the linearity assumption invoked for the transfer-function construction and undermines the claim that passive response accounts for the deformations.
Authors: We appreciate this observation, which highlights a key point that requires clarification. The linear scaling is an experimental result for the total surface elevation rms, which includes both the passive response to pressure fluctuations and contributions from coherent structures like upwellings that are not captured by the linear transfer function. The passive response model is specifically developed to explain the power-law spectral scaling in the wavenumber and frequency spectra, not necessarily the overall rms scaling. The claim is that the passive mechanism is responsible for the spectral features, while the linear rms may arise from the combined effects. To strengthen the manuscript, we will revise the abstract and discussion sections to explicitly distinguish between the total rms scaling and the model's applicability to spectral shapes. Additionally, we will include an analysis showing the expected rms from the model and discuss why the observed linearity might hold in this regime, perhaps due to the specific range of turbulence intensities studied. revision: yes
-
Referee: [Linear response model] § on linear response model: the transfer function with wave-turbulent damping is stated to predict the spatiotemporal spectrum shape and -7/3 exponents. It is unclear whether this model was tested against the rms scaling data or only the spectral shape; explicit comparison showing how the single free parameter (damping coefficient) simultaneously reproduces both the linear rms scaling and the spectral exponents is needed to support the dominance of the passive mechanism.
Authors: The model was developed and compared primarily to the spectral data to predict the shape and exponents. We agree that an explicit check against the rms scaling using the same damping parameter is necessary to fully support the model's validity. In the revised version, we will add a direct comparison: using the damping coefficient determined from fitting the spectral exponents, we will compute the predicted η_rms from the model and compare it to the experimental linear scaling across the range of u_rms. This will either confirm consistency or highlight the need for additional factors, such as a weak dependence in the damping on turbulence intensity. We believe this addition will address the concern and strengthen the evidence for the passive response dominance in the spectral domain. revision: yes
Circularity Check
No circularity: model derived from standard potential-flow theory; scaling and spectra checked against independent data
full rationale
The linear transfer-function model is constructed from established potential-flow response to pressure fluctuations (with added wave-turbulent damping), not defined in terms of the observed surface statistics. The reported linear rms scaling is presented as an experimental measurement, while the model is invoked only to predict spectral exponents and passive-response dominance; these predictions are compared to measured spectra rather than forced by fitting the same quantities. No self-citation chain, ansatz smuggling, or renaming of inputs as outputs appears in the derivation. The derivation chain therefore remains self-contained against external benchmarks.
Axiom & Free-Parameter Ledger
free parameters (1)
- wave-turbulent damping coefficient
axioms (1)
- domain assumption Surface elevation responds linearly to subsurface pressure fluctuations
Lean theorems connected to this paper
-
IndisputableMonolith/Cost/FunctionalEquation.leanwashburn_uniqueness_aczel unclear?
unclearRelation between the paper passage and the cited Recognition theorem.
We develop a linear response model based on the transfer function from the free surface to turbulent pressure fluctuations, incorporating wave-turbulent damping. The model successfully predicts ... power-law exponents (-7/3)
-
IndisputableMonolith/Foundation/DimensionForcing.leanalexander_duality_circle_linking unclear?
unclearRelation between the paper passage and the cited Recognition theorem.
The standard deviation of surface deformations scales linearly with subsurface velocity fluctuations
What do these tags mean?
- matches
- The paper's claim is directly supported by a theorem in the formal canon.
- supports
- The theorem supports part of the paper's argument, but the paper may add assumptions or extra steps.
- extends
- The paper goes beyond the formal theorem; the theorem is a base layer rather than the whole result.
- uses
- The paper appears to rely on the theorem as machinery.
- contradicts
- The paper's claim conflicts with a theorem or certificate in the canon.
- unclear
- Pith found a possible connection, but the passage is too broad, indirect, or ambiguous to say the theorem truly supports the claim.
Reference graph
Works this paper leans on
-
[1]
O. M. Phillips, On the generation of waves by turbulent wind, J. Fluid Mech.2, 417 (1957)
work page 1957
-
[2]
M. A. C. Teixeira and S. E. Belcher, On the initiation of surface waves by turbulent shear flow, Dyn. Atmos. Oceans41, 1 (2006)
work page 2006
-
[3]
M. Brocchini and D. H. Peregrine, The dynamics of strong turbulence at free surfaces. Part 1. Description, J. Fluid Mech. 449, 225 (2001)
work page 2001
-
[4]
S. Perrard, A. Lozano-Durán, M. Rabaud, M. Benzaquen, and F. Moisy, Turbulent windprint on a liquid surface, J. Fluid Mech.873, 1020 (2019)
work page 2019
-
[5]
L. Deike, Mass transfer at the ocean–atmosphere interface: the role of wave breaking, droplets, and bubbles, Annu. Rev. Fluid Mech.54, 191 (2022)
work page 2022
-
[6]
A. Calado and E. Balaras, Interfacial deformation and energy exchange in free-surface turbulence. J. Fluid Mech.1025, A52 (2025)
work page 2025
-
[7]
P. A. Bullee, S. Weichert, A. Nore, D. Li, Y. Jooss, and R. J. Hearst, The influence of water turbulence on surface deformations and the gas transfer rate across an air–water interface, Exp. Fluids65, 132 (2024)
work page 2024
-
[8]
D. Wüthrich, R. Shi, and H. Chanson, Strong free-surface turbulence in breaking bores: a physical study on the free-surface dynamics and air–water interfacial features, J. Fluid Mech.924, A20 (2021)
work page 2021
- [9]
- [10]
- [11]
-
[12]
R. Savelsberg and W. van de Water, Experiments on free-surface turbulence, J. Fluid Mech.619, 95 (2009)
work page 2009
- [13]
-
[14]
D. J. Ruth and F. Coletti, Structure and energy transfer in homogeneous turbulence below a free surface, J. Fluid Mech. 1001, A46 (2024)
work page 2024
-
[15]
J. C. R. Hunt and J. M. R. Graham, Free-stream turbulence near plane boundaries, J. Fluid Mech.84, 209 (1978)
work page 1978
-
[16]
M. A. C. Teixeira and S. E. Belcher, Dissipation of shear-free turbulence near boundaries, J. Fluid Mech.422, 167 (2000)
work page 2000
-
[17]
J. Magnaudet, High-Reynolds-number turbulence in a shear-free boundary layer: revisiting the Hunt-Graham theory, J. Fluid Mech.484, 167 (2003)
work page 2003
-
[18]
Y. Qi, Y. Li, and F. Coletti, Small-scale dynamics and structure of free-surface turbulence, J. Fluid Mech.1005, A8 (2025)
work page 2025
-
[19]
J. R. Aarnes, O. M. Babiker, A. Xuan, L. Shen, and S. Å. Ellingsen, Vortex structures under dimples and scars in turbulent free-surface flows, J. Fluid Mech.1007, A38 (2025)
work page 2025
- [20]
- [21]
-
[22]
Jamin,Interactions between free-surface waves and hydrodynamic flows, Ph.D
T. Jamin,Interactions between free-surface waves and hydrodynamic flows, Ph.D. thesis, Univ. Paris Diderot, 2016 (in French)
work page 2016
-
[23]
P. Gutiérrez and S. Aumaître, Surface waves propagating on a turbulent flow, Phys. Fluids28, 025107 (2016)
work page 2016
-
[24]
C. Falcón and S. Fauve, Wave-vortex interaction, Phys. Rev. E80, 056213 (2009)
work page 2009
-
[25]
B. K. Smeltzer, O. Rømcke, R. J. Hearst, and S. Å. Ellingsen, Experimental study of the mutual interactions between waves and tailored turbulence, J. Fluid Mech.962, R1 (2023)
work page 2023
-
[26]
M. Takeda and K. Mutoh, Fourier transform profilometry for the automatic measurement of 3D object shapes, Appl. Opt. 22, 3977 (1983)
work page 1983
-
[27]
P. J. Cobelli, A. Maurel, V. Pagneux, and P. Petitjeans, Global measurement of water waves by Fourier transform pro- filometry, Exp. Fluids46, 1037 (2009)
work page 2009
-
[28]
E. Falcon and E. Mordant, Experiments in surface gravity-capillary wave turbulence, Annu. Rev. Fluid Mech.54, 1 (2022)
work page 2022
-
[29]
Industrial titanium dioxide (0.3-µm TiO2) pigment (Anatase) from KronosTM. Product Code: 1002
-
[30]
A. Przadka, B. Cabane, V. Pagneux, A. Maurel, and P. Petitjeans, Fourier transform profilometry for water waves: How to achieve clean water attenuation with diffusive reflection at the water surface?, Exp. Fluids 52, 519 (2012)
work page 2012
-
[31]
See Supplemental Material at [URL] for a movie showing free-surface deformations as scars and waves in response to subsurface moderate turbulence (oblique view)
-
[32]
E. Falcon and G. Ricard, Experimental quasi-1D capillary-wave turbulence, Europhys. Lett. (EPL),135, 64001 (2021)
work page 2021
-
[33]
Gutiérrez,Effects on the free surface of a turbulent flow, Ph.D
P. Gutiérrez,Effects on the free surface of a turbulent flow, Ph.D. thesis, CEA Saclay, France, 2013 (in French)
work page 2013
-
[34]
V. E. Zakharov and N. N. Filonenko, Energy spectrum for stochastic oscillations of the surface of a liquid, Sov. Phys. Dokl. 11, 881 (1967)
work page 1967
-
[35]
V. E. Zakharov, V. Lvov, and G. Falkovich,Kolmogorov-Zakharov Spectra of Turbulence(2nd Ed., Springer, Berlin, 2025)
work page 2025
-
[36]
O. M. Phillips, The equilibrium range in the spectrum of wind-generated waves, J. Fluid Mech.4, 426 (1958)
work page 1958
-
[37]
K. W. Melville, L. Lenain, D. R. Cayan, M. Kahru, J. P. Kleissl, P. F. Linden, and N. M. Statom, The modular aerial sensing system, J. Atmos. Oceanic Technol.33, 1169 (2016)
work page 2016
-
[38]
V. E. Zakharov and N. N. Filonenko, Weak turbulence of capillary waves, J. Appl. Mech. Tech. Phys.8, 37 (1967)
work page 1967
-
[39]
A.S. Monin and A.M. Yaglom,Statistical Fluid Mechanics. Vol. 2.(MIT, Cambridge, MA, 1975)
work page 1975
-
[40]
Y. Tsuji and T. Ishihara, Similarity scaling of pressure fluctuation in turbulence, Phys. Rev. E68, 026309 (2003)
work page 2003
-
[41]
O. Terashima, Y. Sakai, and K. Nagata, Simultaneous measurement of velocity and pressure in a plane jet, Exp. Fluids 53, 1149 (2012)
work page 2012
-
[42]
O. M. Phillips, Spectral and statistical properties of the equilibrium range in wind-generated gravity waves, J. Fluid Mech. 156, 505 (1985)
work page 1985
-
[43]
T. Gotoh and D. Fukayama, Pressure Spectrum in Homogeneous Turbulence, Phys. Rev. Lett.86, 3775 (2001)
work page 2001
- [44]
-
[45]
M. Wilczek and Y. Narita, Wave-number–frequency spectrum for turbulence from a random sweeping hypothesis with mean flow, Phys. Rev. E86, 066308 (2012)
work page 2012
-
[46]
Lamb,Hydrodynamics(6th Ed., Dover, New York, 1932)
H. Lamb,Hydrodynamics(6th Ed., Dover, New York, 1932)
work page 1932
- [47]
-
[48]
P. Clark di Leoni, P. J. Cobelli, and P. D. Mininni, The spatio-temporal spectrum of turbulent flows, Eur. Phys. J. E38, 136 (2015)
work page 2015
-
[49]
E. Falcon, J.-C. Bacri, and C. Laroche, Dissipated power within a turbulent flow forced homogeneously by magnetic particles, Phys. Rev. Fluids 2, 102601 (R) (2017)
work page 2017
-
[50]
A. Cazaubiel, J.-B. Gorce, J.-C. Bacri, M. Berhanu, C. Laroche, and E. Falcon, Three-dimensional turbulence generated homogeneously by magnetic particles, Phys. Rev. Fluids6, L112601 (2021)
work page 2021
-
[51]
J.-B. Gorce and E. Falcon, Statistical equilibrium of large scales in three-dimensional hydrodynamic turbulence, Phys. Rev. Lett.129, 054501 (2022)
work page 2022
discussion (0)
Sign in with ORCID, Apple, or X to comment. Anyone can read and Pith papers without signing in.