Recognition: 2 theorem links
· Lean TheoremNot All Who Wander Are Lost: Early Excess Demographics in the Volume-limited ZTF DR2 SN Ia Sample
Pith reviewed 2026-05-15 01:29 UTC · model grok-4.3
The pith
Early-excess Type Ia supernovae show significantly larger SALT2 stretch and r-band secondary maximum flux than no-excess events.
A machine-rendered reading of the paper's core claim, the machinery that carries it, and where it could break.
Core claim
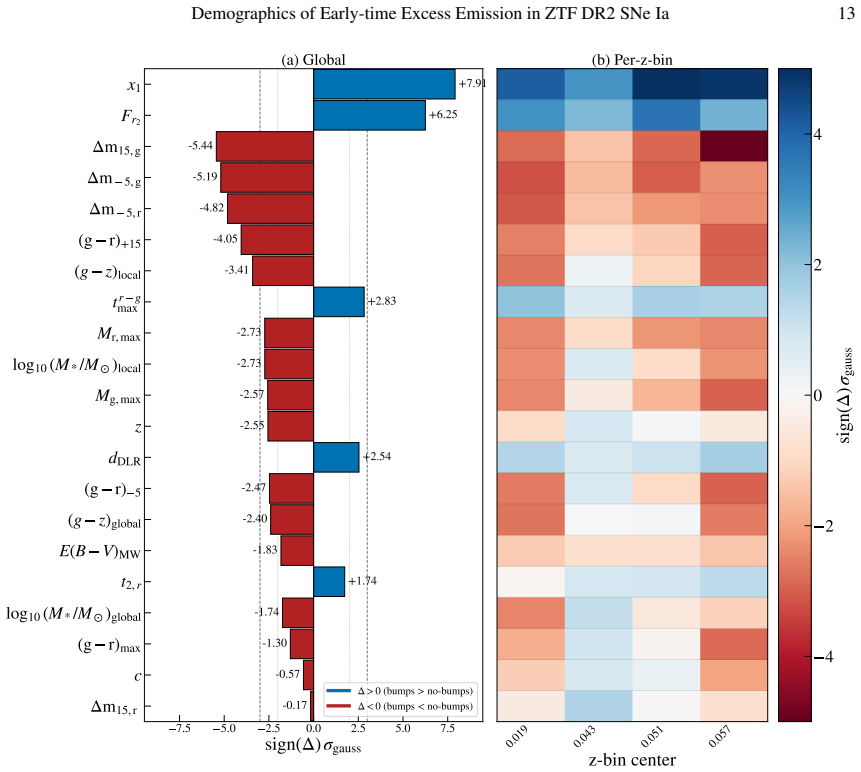
In the volume-limited ZTF DR2 sample of Type Ia supernovae, events identified with early-time flux excesses have larger SALT2 stretch x1 at 7.91 sigma significance and larger r-band secondary-maximum flux Fr2 at 6.25 sigma significance compared to no-excess events, while differences in SALT2 color c remain weak at 0.57 sigma; excess events also favor bluer local (g-z) colors and lower local stellar masses.
What carries the argument
Separation of early-excess and no-excess populations via identification of short-lived flux excesses in ZTF g- and r-band light curves shortly after explosion, followed by two-sample statistical tests on derived SN and host parameters.
If this is right
- Early excesses connect directly to higher-stretch light curves, implying shared underlying explosion physics.
- Host-environment trends suggest progenitor-system influences on whether an early excess appears.
- Color differences remain too weak to serve as a reliable separator between the populations.
- The demographic patterns motivate targeted modeling of early emission in high-stretch supernovae.
Where Pith is reading between the lines
- If the stretch correlation holds, early excesses could serve as an observable flag for one channel among multiple Type Ia progenitor pathways.
- Upcoming wide-field surveys may exploit early excesses to pre-select events for detailed follow-up on secondary maxima.
- The absence of strong color differences implies that dust or viewing-angle effects play only a secondary role in the excess phenomenon.
Load-bearing premise
The conservative coverage and quality requirements applied to ZTF light curves produce unbiased excess and no-excess catalogs that accurately reflect intrinsic population differences.
What would settle it
A new independent sample of similar size and redshift limit showing no statistically significant difference in SALT2 stretch x1 between early-excess and no-excess events under the same selection criteria.
Figures


read the original abstract
Early-time flux excesses in Type Ia supernovae (SNe~Ia) offer a unique insight into their progenitor systems and explosion mechanisms. Although individual early-excess events and larger searches have been reported, demographic studies remain limited by sample size. We present a systematic search for early-time excess emission in a volume-limited sample ($z<0.06$) of SNe~Ia based on the Zwicky Transient Facility Data Release 2 (ZTF DR2). Using ZTF $g$- and $r$-band light curves, we identify candidates showing early-excesses shortly after the explosion time, and we apply conservative coverage and quality requirements to build reliable ``excess'' and ``no-excess'' bump and no-bump catalogs. From an initial sample of 1547 SNe~Ia, our final catalogs contain 42 early-excess and 110 no-excess events. We compare the two populations using SN and host environment parameters from ZTF DR2 and quantify the differences using two-sample statistical tests. We find the strongest differences are in SN light-curve properties: early-excess events have larger SALT2 stretch $x_1$ ($7.91\sigma$) and larger $r$-band secondary-maximum flux $\mathcal{F}_{r_2}$ ($6.25\sigma$), while differences in SALT2 color $c$ are weak ($0.57\sigma$). Early-excess events also favor bluer $(g-z)_{\rm local}$ ($3.41\sigma$) and lower $\log_{10} (M_*/M_\odot)_{\rm local}$ ($2.73\sigma$). Our results connect early excesses with SNe~Ia diversity, and motivate further analyses of upcoming larger samples.
Editorial analysis
A structured set of objections, weighed in public.
Referee Report
Summary. The paper reports a systematic search for early-time flux excesses in a volume-limited (z < 0.06) sample of 1547 Type Ia supernovae from ZTF DR2. After applying conservative coverage and quality cuts to g- and r-band light curves, catalogs of 42 early-excess and 110 no-excess events are constructed. Two-sample statistical tests reveal that early-excess events show significantly larger SALT2 stretch x1 (7.91σ) and r-band secondary-maximum flux Fr2 (6.25σ), with weaker differences in color c (0.57σ) and host properties such as bluer local (g-z) (3.41σ) and lower log stellar mass (2.73σ).
Significance. If the demographic differences are intrinsic, the work provides a statistically meaningful link between early excesses and SN Ia light-curve diversity in a volume-limited sample, using standard two-sample tests on measured parameters. The large initial sample and focus on observable quantities strengthen its potential impact on progenitor studies, though verification of selection robustness is required.
major comments (1)
- [§3] §3 (Sample Selection): The conservative coverage and quality requirements used to define the excess (N=42) and no-excess (N=110) catalogs may preferentially retain high-x1 events, as broader light curves are more likely to meet the minimum pre- and post-peak epoch thresholds for reliable excess detection. This creates a direct selection channel that correlates with the central 7.91σ x1 difference; the manuscript does not report a quantitative test (e.g., selection-function simulation or matched-subsample comparison) to demonstrate that the difference is not partly induced by the cuts.
minor comments (2)
- [§3] The exact numerical thresholds for coverage (e.g., number of epochs) and quality cuts should be stated explicitly in the main text rather than referenced only as 'conservative'.
- [§4] The specific two-sample test (KS, Anderson-Darling, or t-test) and whether uncertainties on x1 and Fr2 are propagated should be stated when reporting the σ values in §4.
Simulated Author's Rebuttal
Thank you for the detailed review of our manuscript. We appreciate the referee's concern regarding potential selection biases in our sample construction. Below we provide a point-by-point response to the major comment.
read point-by-point responses
-
Referee: [§3] §3 (Sample Selection): The conservative coverage and quality requirements used to define the excess (N=42) and no-excess (N=110) catalogs may preferentially retain high-x1 events, as broader light curves are more likely to meet the minimum pre- and post-peak epoch thresholds for reliable excess detection. This creates a direct selection channel that correlates with the central 7.91σ x1 difference; the manuscript does not report a quantitative test (e.g., selection-function simulation or matched-subsample comparison) to demonstrate that the difference is not partly induced by the cuts.
Authors: We agree with the referee that the coverage and quality cuts could introduce a selection bias favoring higher x1 events, since events with broader light curves are more likely to have sufficient pre- and post-peak observations. The manuscript does not include a quantitative assessment of this effect. To address this concern, we will perform a selection-function simulation using mock SN Ia light curves with a range of x1 values, applying the same cuts, and compare the resulting x1 distributions between the simulated excess and no-excess samples. We will also consider a matched-subsample analysis where we select no-excess events with similar coverage properties. These additional tests and their results will be incorporated into the revised manuscript. revision: yes
Circularity Check
No circularity: purely observational sample comparison with standard statistical tests
full rationale
The paper constructs excess and no-excess catalogs by applying coverage/quality cuts to ZTF light curves after explosion-time estimation, then compares the resulting populations on independently measured parameters (SALT2 x1, c, Fr2, host properties) via two-sample tests. No derivation, equation, or prediction reduces to its own inputs by construction. The selection criteria are defined independently of the demographic variables reported as differing (e.g., x1 is not used to define excess). Self-citations, if present, are not load-bearing for any central claim. This is a standard observational demographic analysis whose validity hinges on whether the cuts are unbiased (a separate systematic concern), not on any self-referential reduction.
Axiom & Free-Parameter Ledger
axioms (1)
- standard math Two-sample statistical tests (e.g., Kolmogorov-Smirnov or similar) are appropriate for comparing SN and host parameters between excess and no-excess groups.
Lean theorems connected to this paper
-
IndisputableMonolith/Cost/FunctionalEquation.leanwashburn_uniqueness_aczel unclear?
unclearRelation between the paper passage and the cited Recognition theorem.
We compare the two populations using SN and host environment parameters from ZTF DR2 and quantify the differences using two-sample statistical tests... early-excess events have larger SALT2 stretch x1 (7.91σ)
-
IndisputableMonolith/Foundation/Atomicity.leanatomic_tick unclear?
unclearRelation between the paper passage and the cited Recognition theorem.
We apply conservative coverage and quality requirements to build reliable excess and no-excess catalogs
What do these tags mean?
- matches
- The paper's claim is directly supported by a theorem in the formal canon.
- supports
- The theorem supports part of the paper's argument, but the paper may add assumptions or extra steps.
- extends
- The paper goes beyond the formal theorem; the theorem is a base layer rather than the whole result.
- uses
- The paper appears to rely on the theorem as machinery.
- contradicts
- The paper's claim conflicts with a theorem or certificate in the canon.
- unclear
- Pith found a possible connection, but the passage is too broad, indirect, or ambiguous to say the theorem truly supports the claim.
Reference graph
Works this paper leans on
-
[1]
2025, A&A, 694, A3 6
Amenouche, M., Rosnet, P., Smith, M., et al. 2025, A&A, 694, A3 6
2025
-
[2]
2014, A&A, 568, A22 3
Betoule, M., Kessler, R., Guy, J., et al. 2014, A&A, 568, A22 3
2014
-
[3]
Blondin, S., & Tonry, J. L. 2007, ApJ, 666, 1024 4
2007
-
[4]
2021, ApJ, 909, 26 2
Brout, D., & Scolnic, D. 2021, ApJ, 909, 26 2
2021
-
[5]
2022, ApJ, 938, 110 2
Brout, D., Scolnic, D., Popovic, B., et al. 2022, ApJ, 938, 110 2
2022
-
[6]
A., Yao, Y ., et al
Bulla, M., Miller, A. A., Yao, Y ., et al. 2020, ApJ, 902, 48 19
2020
-
[7]
Burke, J., Howell, D. A., Sand, D. J., & Hosseinzadeh, G. 2022, arXiv e-prints, arXiv:2208.11201 3, 19
-
[8]
J., Wolf, C., & Zahid, H
Childress, M. J., Wolf, C., & Zahid, H. J. 2014, MNRAS, 445, 1898 2
2014
-
[9]
R., et al
Deckers, M., Maguire, K., Magee, M. R., et al. 2022, MNRAS, 512, 1317 2, 3, 6, 19, 21, 22, 23
2022
-
[10]
2025, A&A, 694, A12 4, 5, 20
Deckers, M., Maguire, K., Shingles, L., et al. 2025, A&A, 694, A12 4, 5, 20
2025
-
[11]
2016, A&A, 588, A84 4
Dhawan, S., Leibundgut, B., Spyromilio, J., & Blondin, S. 2016, A&A, 588, A84 4
2016
-
[12]
2022, MNRAS, 510, 2228 2, 3, 20, 21
Dhawan, S., Goobar, A., Smith, M., et al. 2022, MNRAS, 510, 2228 2, 3, 20, 21
2022
-
[13]
J., Rest, A., et al
Dimitriadis, G., Foley, R. J., Rest, A., et al. 2019, ApJ, 870, L1 2 Demographics of Early-time Excess Emission in ZTF DR2 SNe Ia 33
2019
-
[14]
2025, A&A, 694, A10 4, 5, 6, 15
Dimitriadis, G., Burgaz, U., Deckers, M., et al. 2025, A&A, 694, A10 4, 5, 6, 15
2025
-
[15]
H., Frogel, J
Elias, J. H., Frogel, J. A., Hackwell, J. A., & Persson, S. E. 1981, ApJ, 251, L13 4
1981
-
[16]
M., Vallely, P
Fausnaugh, M. M., Vallely, P. J., Kochanek, C. S., et al. 2021, ApJ, 908, 51 3
2021
-
[17]
M., Vallely, P
Fausnaugh, M. M., Vallely, P. J., Tucker, M. A., et al. 2023, ApJ, 956, 108 3
2023
-
[18]
K., Hillebrandt, W., et al
Fink, M., R¨opke, F. K., Hillebrandt, W., et al. 2010, A&A, 514, A53 22
2010
-
[19]
J., Scolnic, D., Rest, A., et al
Foley, R. J., Scolnic, D., Rest, A., et al. 2018, MNRAS, 475, 193 6
2018
-
[20]
R., Kuhlmann, S., Kovacs, E., et al
Gupta, R. R., Kuhlmann, S., Kovacs, E., et al. 2016, AJ, 152, 154 4
2016
-
[21]
2007, A&A, 466, 11 3
Guy, J., Astier, P., Baumont, S., et al. 2007, A&A, 466, 11 3
2007
-
[22]
2010, A&A, 523, A7 3
Guy, J., Sullivan, M., Conley, A., et al. 2010, A&A, 523, A7 3
2010
-
[23]
R., Millman, K
Harris, C. R., Millman, K. J., van der Walt, S. J., et al. 2020, Nature, 585, 357 23
2020
-
[24]
B., Shappee, B
Hoogendam, W. B., Shappee, B. J., Brown, P. J., et al. 2024, ApJ, 966, 139 3
2024
-
[25]
J., Valenti, S., et al
Hosseinzadeh, G., Sand, D. J., Valenti, S., et al. 2017, ApJ, 845, L11 2
2017
-
[26]
Hoyle, F., & Fowler, W. A. 1960, ApJ, 132, 565 2
1960
-
[27]
2025, Research in Astronomy and Astrophysics, 25, 044001 22
Huang, Y ., Liu, J., Wu, H., et al. 2025, Research in Astronomy and Astrophysics, 25, 044001 22
2025
-
[28]
Hunter, J. D. 2007, Computing in Science and Engineering, 9, 90 23 Ivezi´c, ˇZ., Kahn, S. M., Tyson, J. A., et al. 2019, ApJ, 873, 111 22
2007
-
[29]
W., Maguire, K., & Sullivan, M
Jha, S. W., Maguire, K., & Sullivan, M. 2019, Nature Astronomy, 3, 706 2
2019
-
[30]
2018, ApJ, 865, 149 3
Jiang, J.-a., Doi, M., Maeda, K., & Shigeyama, T. 2018, ApJ, 865, 149 3
2018
-
[31]
O., Scolnic, D
Jones, D. O., Scolnic, D. M., Foley, R. J., et al. 2019, ApJ, 881, 19 2
2019
-
[32]
2010, ApJ, 708, 1025 2, 22
Kasen, D. 2010, ApJ, 708, 1025 2, 22
2010
-
[33]
Kasen, D., & Woosley, S. E. 2007, ApJ, 656, 661 3
2007
-
[34]
E., & Raftery, A
Kass, R. E., & Raftery, A. E. 1995, Journal of the American Statistical Association, 90, 773 9
1995
-
[35]
L., Hicken, M., Burke, D
Kelly, P. L., Hicken, M., Burke, D. L., Mandel, K. S., & Kirshner, R. P. 2010, ApJ, 715, 743 2
2010
-
[36]
2023, MNRAS, 519, 3046 2
Kelsey, L., Sullivan, M., Wiseman, P., et al. 2023, MNRAS, 519, 3046 2
2023
-
[37]
1996, PASP, 108, 190 4
Kim, A., Goobar, A., & Perlmutter, S. 1996, PASP, 108, 190 4
1996
-
[38]
2018, ApJ, 854, 24 21
Kim, Y .-L., Smith, M., Sullivan, M., & Lee, Y .-W. 2018, ApJ, 854, 24 21
2018
-
[39]
2016, in ELPUB, 87 23
Kluyver, T., Ragan-Kelley, B., P´erez, F., et al. 2016, in ELPUB, 87 23
2016
-
[40]
C., et al
Lampeitl, H., Smith, M., Nichol, R. C., et al. 2010, ApJ, 722, 566 2, 19 Le Borgne, D., & Rocca-V olmerange, B. 2002, A&A, 386, 446 4
2010
-
[41]
2019, ApJ, 870, 12 2
Li, W., Wang, X., Vink´o, J., et al. 2019, ApJ, 870, 12 2
2019
-
[42]
K., & Han, Z
Liu, Z.-W., R¨opke, F. K., & Han, Z. 2023, Research in Astronomy and Astrophysics, 23, 082001 2
2023
-
[43]
R., Maguire, K., Kotak, R., et al
Magee, M. R., Maguire, K., Kotak, R., et al. 2020, A&A, 634, A37 22
2020
-
[44]
R., Sim, S
Magee, M. R., Sim, S. A., Kotak, R., & Kerzendorf, W. E. 2018, A&A, 614, A115 22
2018
-
[45]
2014, ARA&A, 52, 107 2
Maoz, D., Mannucci, F., & Nelemans, G. 2014, ARA&A, 52, 107 2
2014
-
[46]
A., Yao, Y ., Bulla, M., et al
Miller, A. A., Yao, Y ., Bulla, M., et al. 2020, ApJ, 902, 47 19
2020
-
[47]
J., Mazzali, P
Moriya, T. J., Mazzali, P. A., Ashall, C., & Pian, E. 2023, MNRAS, 522, 6035 2, 22 M¨uller-Bravo, T., & Galbany, L. 2022, The Journal of Open Source Software, 7, 4508 4 34 C. Rojas-Bravo et al
2023
-
[48]
Q., Moon, D.-S., Drout, M
Ni, Y . Q., Moon, D.-S., Drout, M. R., et al. 2025, ApJ, 983, 3 3
2025
-
[49]
2005, A&A, 437, 789 4
Nobili, S., Amanullah, R., Garavini, G., et al. 2005, A&A, 437, 789 4
2005
-
[50]
2002, PASP, 114, 803 4
Nugent, P., Kim, A., & Perlmutter, S. 2002, PASP, 114, 803 4
2002
-
[51]
Olling, R. P., Mushotzky, R., Shaya, E. J., et al. 2015, Nature, 521, 332 3 Padilla Gonzalez, E., Joshi Bhavin, A., Strolger, L. G., et al. 2025, arXiv e-prints, arXiv:2512.20834 2 pandas development team, T. 2020, pandas-dev/pandas: Pandas 23
-
[52]
2019, MNRAS, 483, 5045 4
Papadogiannakis, S., Goobar, A., Amanullah, R., et al. 2019, MNRAS, 483, 5045 4
2019
-
[53]
1999, ApJ, 517, 565 2
Perlmutter, S., Aldering, G., Goldhaber, G., et al. 1999, ApJ, 517, 565 2
1999
-
[54]
Phillips, M. M. 1993, ApJ, 413, L105 2, 3
1993
-
[55]
L., & Morozova, V
Piro, A. L., & Morozova, V . S. 2016, ApJ, 826, 96 2, 22
2016
-
[56]
L., & Nakar, E
Piro, A. L., & Nakar, E. 2014, ApJ, 784, 85 2, 22
2014
-
[57]
L., & Nakar, E
Piro, A. L., & Nakar, E. 2025, ApJ, 993, 63 2
2025
-
[58]
2019, ApJ, 873, 84 2, 22
Polin, A., Nugent, P., & Kasen, D. 2019, ApJ, 873, 84 2, 22
2019
-
[59]
J., Wiseman, P., & Sullivan, M
Ramaiya, S., Vincenzi, M., Jarvis, M. J., Wiseman, P., & Sullivan, M. 2025, MNRAS, 543, 2180 2
2025
-
[60]
G., Filippenko, A
Riess, A. G., Filippenko, A. V ., Challis, P., et al. 1998, AJ, 116, 1009 2
1998
-
[61]
2013, A&A, 560, A66 19, 22
Rigault, M., Copin, Y ., Aldering, G., et al. 2013, A&A, 560, A66 19, 22
2013
-
[62]
2020, A&A, 644, A176 2, 21
Rigault, M., Brinnel, V ., Aldering, G., et al. 2020, A&A, 644, A176 2, 21
2020
-
[63]
2018, A&A, 615, A68 19, 22
Roman, M., Hardin, D., Betoule, M., et al. 2018, A&A, 615, A68 19, 22
2018
-
[64]
M., Garnavich, P
Rose, B. M., Garnavich, P. M., & Berg, M. A. 2019, ApJ, 874, 32 2
2019
-
[65]
J., & Seitenzahl, I
Ruiter, A. J., & Seitenzahl, I. R. 2025, A&A Rev., 33, 1 2
2025
-
[66]
2022, ApJ, 938, 113 6
Scolnic, D., Brout, D., Carr, A., et al. 2022, ApJ, 938, 113 6
2022
-
[67]
2025, A&A, 694, A14 2, 4, 5, 14
Senzel, R., Maguire, K., Burgaz, U., et al. 2025, A&A, 694, A14 2, 4, 5, 14
2025
-
[68]
J., Holoien, T
Shappee, B. J., Holoien, T. W.-S., Drout, M. R., et al. 2019, ApJ, 870, 13 2
2019
-
[69]
2016, MNRAS, 463, 4311 4
Shariff, H., Dhawan, S., Jiao, X., et al. 2016, MNRAS, 463, 4311 4
2016
-
[70]
R., et al
Strateva, I., Ivezi´c, ˇZ., Knapp, G. R., et al. 2001, AJ, 122, 1861 15
2001
-
[71]
J., et al
Sullivan, M., Le Borgne, D., Pritchet, C. J., et al. 2006, ApJ, 648, 868 2, 4
2006
-
[72]
A., et al
Sullivan, M., Conley, A., Howell, D. A., et al. 2010, MNRAS, 406, 782 2
2010
-
[73]
E., et al
Taylor, G., Lidman, C., Tucker, B. E., et al. 2021, MNRAS, 504, 4111 3
2021
-
[74]
Thorp, S., & Mandel, K. S. 2022, MNRAS, 517, 2360 2
2022
-
[75]
2025, MNRAS, 538, 181 2
Toy, M., Wiseman, P., Sullivan, M., et al. 2025, MNRAS, 538, 181 2
2025
-
[76]
A., Shappee, B
Tucker, M. A., Shappee, B. J., Vallely, P. J., et al. 2020, MNRAS, 493, 1044 2
2020
-
[77]
2024, ApJ, 975, 86 2, 6
Vincenzi, M., Brout, D., Armstrong, P., et al. 2024, ApJ, 975, 86 2, 6
2024
-
[78]
E., et al
Virtanen, P., Gommers, R., Oliphant, T. E., et al. 2020, Nature Medicine, 17, 261 23
2020
-
[79]
2012, New Astron
Wang, B., & Han, Z. 2012, New Astron. Rev., 56, 122 2
2012
-
[80]
2024, ApJ, 962, 17 2
Wang, Q., Rest, A., Dimitriadis, G., et al. 2024, ApJ, 962, 17 2
2024
discussion (0)
Sign in with ORCID, Apple, or X to comment. Anyone can read and Pith papers without signing in.