Bayesian characterization of porous media using three-microphone tube method in extended frequency ranges
Pith reviewed 2026-05-20 01:40 UTC · model grok-4.3
The pith
Bayesian inference unwraps phase jumps in three-microphone tube data to extend frequency range for porous media characterization.
A machine-rendered reading of the paper's core claim, the machinery that carries it, and where it could break.
Core claim
The inferred parameters accurately capture the behavior of the transfer function, allowing accurate parameter estimation of the unwrapped propagation coefficient and characteristic impedance of the porous material under test.
What carries the argument
Sequential Bayesian inference applied to transfer functions obtained from multiple microphones distributed along the tube circumference, which isolates cylindrical-mode effects to treat remaining discontinuities as phase-wrapping artifacts.
If this is right
- The valid frequency range for characteristic impedance and propagation coefficient measurement is extended beyond the onset of cylindrical modes.
- Experimentally observed discontinuities in the propagation coefficient are resolved into continuous unwrapped values.
- Inferred parameters match the measured transfer function behavior across the extended broadband range.
- Accurate acoustic characterization of porous materials becomes feasible at frequencies where conventional three-microphone methods break down.
Where Pith is reading between the lines
- The same circumferential-microphone plus sequential-inference approach could apply to other tube-based acoustic tests that encounter higher-order mode interference.
- Testing the method on reference materials with independently known high-frequency properties would provide a direct check on the unwrapping accuracy.
- Coupling the inference with a more detailed model of tube wall effects might further reduce residual discrepancies at the highest frequencies.
Load-bearing premise
That cylindrical-mode contributions can be isolated and modeled well enough from the circumferential signals so that remaining discontinuities are purely phase-wrapping artifacts rather than measurement errors or unmodeled physics.
What would settle it
If independent high-frequency measurements or simulations show that the Bayesian-inferred unwrapped propagation coefficient and impedance fail to reproduce the measured transfer functions above the frequency where cylindrical modes appear.
Figures




read the original abstract
The characteristic impedance and the propagation coefficient are among the most important parameters for evaluating the acoustic performance of porous materials. This work investigates the influence of cylindrical modes in an impermeable tube and applies multiple microphones distributed along the tube circumference within the three-microphone framework to extend the valid frequency range of characteristic impedance measurement. During the extended broadband measurements, discontinuities or phase jumps are observed in the experimentally measured propagation coefficient of the porous material under test. A Bayesian inference is applied in a sequential manner to estimate the unwrapped propagation coefficient and characteristic impedance. The results demonstrate that the inferred parameters accurately capture the behavior of the transfer function, allowing accurate parameter estimation.
Editorial analysis
A structured set of objections, weighed in public.
Referee Report
Summary. The manuscript extends the three-microphone tube method for measuring the characteristic impedance and propagation coefficient of porous media by placing multiple microphones along the tube circumference to isolate and subtract cylindrical-mode contributions. This allows measurements in extended frequency ranges where phase discontinuities appear in the propagation coefficient; the authors apply sequential Bayesian inference to unwrap these jumps and report that the resulting parameters accurately reproduce the observed transfer-function behavior.
Significance. If the unwrapping procedure and cylindrical-mode isolation are shown to be robust, the work would provide a practical route to broadband impedance-tube characterization of porous absorbers, which is relevant for noise-control applications. The sequential Bayesian treatment of phase unwrapping is a potentially useful technical contribution, though its reliability hinges on quantitative validation that is not yet supplied.
major comments (2)
- [Abstract] Abstract: the claim that 'the inferred parameters accurately capture the behavior of the transfer function' is supported only by qualitative demonstration; no quantitative metrics (e.g., RMS residual between posterior predictive and measured transfer functions, or coverage of the raw data by the posterior predictive interval) are reported, leaving the central claim without a clear error budget.
- [Results] Results section (description of sequential unwrapping): the assumption that all post-cylindrical-mode discontinuities are exclusively 2π phase wraps is not tested against residual tube non-idealities, microphone calibration drift, or higher-order modes; a direct comparison with an independent low-frequency reference measurement (where phase wrapping is absent) would be required to confirm that the Bayesian step recovers the physically correct propagation coefficient rather than an artifact of the unwrapping model.
minor comments (2)
- [Methods] The manuscript should supply explicit statements of the priors used in the Bayesian inference and convergence diagnostics (e.g., Gelman-Rubin statistic or effective sample size) to allow reproducibility.
- [Figures] Figure captions and axis labels for the unwrapped propagation coefficient should indicate the frequency range over which cylindrical-mode subtraction was applied and where the Bayesian step begins.
Simulated Author's Rebuttal
We thank the referee for the constructive comments on our manuscript. We respond to each major comment below and indicate the changes planned for the revised version.
read point-by-point responses
-
Referee: [Abstract] Abstract: the claim that 'the inferred parameters accurately capture the behavior of the transfer function' is supported only by qualitative demonstration; no quantitative metrics (e.g., RMS residual between posterior predictive and measured transfer functions, or coverage of the raw data by the posterior predictive interval) are reported, leaving the central claim without a clear error budget.
Authors: We agree that the current demonstration is primarily qualitative. In the revised manuscript we will add quantitative validation metrics, specifically the root-mean-square residual between the posterior predictive transfer functions and the measured data together with the empirical coverage of the measured points by the 95 % posterior predictive intervals. These additions will supply the requested error budget for the central claim. revision: yes
-
Referee: [Results] Results section (description of sequential unwrapping): the assumption that all post-cylindrical-mode discontinuities are exclusively 2π phase wraps is not tested against residual tube non-idealities, microphone calibration drift, or higher-order modes; a direct comparison with an independent low-frequency reference measurement (where phase wrapping is absent) would be required to confirm that the Bayesian step recovers the physically correct propagation coefficient rather than an artifact of the unwrapping model.
Authors: The sequential Bayesian procedure is constructed to detect and remove 2π discontinuities once the cylindrical-mode contributions have been subtracted via the circumferential microphone array. We will enlarge the Results section with an explicit discussion of possible confounding effects from residual tube non-idealities, microphone calibration drift, and higher-order modes, including a brief sensitivity study. We will also add a direct comparison of the unwrapped propagation coefficient against the standard three-microphone result in the low-frequency regime where phase wrapping is absent, thereby confirming consistency with the physically expected values. revision: partial
Circularity Check
Bayesian inference from measured transfer functions is self-contained with no circular reduction
full rationale
The paper applies standard three-microphone tube measurements to obtain transfer functions, then uses sequential Bayesian inference to estimate the unwrapped propagation coefficient and characteristic impedance while accounting for cylindrical modes via circumferential microphones. The central claim that the inferred parameters capture transfer-function behavior is a posterior validation step, not a definitional loop in which the target quantities are constructed from themselves or from a prior fit to the same data. No self-citation load-bearing premise, ansatz smuggled via citation, or uniqueness theorem imported from the authors' prior work appears in the derivation chain. The method relies on external acoustic principles and Bayesian updating whose assumptions do not include the final parameter values, rendering the estimation independent of its outputs.
Axiom & Free-Parameter Ledger
Lean theorems connected to this paper
-
IndisputableMonolith/Cost/FunctionalEquation.leanwashburn_uniqueness_aczel unclear?
unclearRelation between the paper passage and the cited Recognition theorem.
θ = k d = cos^{-1} H_d0 ... The inverse cosine function is value-ambiguous ... Bayesian inference is applied in a sequential manner to estimate the unwrapped propagation coefficient
-
IndisputableMonolith/Foundation/AlphaCoordinateFixation.leanalpha_pin_under_high_calibration unclear?
unclearRelation between the paper passage and the cited Recognition theorem.
posterior P(θ | H_d0, H_M, I) ∝ P(H_d0 | θ, H_M, I) × P(θ | H_M, I) ... priors for later data points assigned Gaussian distributions with mean and variance of preceding posterior
What do these tags mean?
- matches
- The paper's claim is directly supported by a theorem in the formal canon.
- supports
- The theorem supports part of the paper's argument, but the paper may add assumptions or extra steps.
- extends
- The paper goes beyond the formal theorem; the theorem is a base layer rather than the whole result.
- uses
- The paper appears to rely on the theorem as machinery.
- contradicts
- The paper's claim conflicts with a theorem or certificate in the canon.
- unclear
- Pith found a possible connection, but the passage is too broad, indirect, or ambiguous to say the theorem truly supports the claim.
Reference graph
Works this paper leans on
-
[1]
The characteristic impedance and the propagation coefficient are among the most impor- tant parameters for evaluating the acoustic performance of porous materials. This work investigates the influence of cylindrical modes in an impermeable tube and applies multiple microphones distributed along the tube circumference within the three-microphone frame- wor...
work page 2010
-
[2]
represents one of the most widely adopted techniques in the acoustical materials com- munity for experimentally characterizing these acoustic properties. This work applies Bayesian inference to cope with challenges when extending the valid frequency range of tube measurements using averages of multiple micro- phones. During the extended broadband measurem...
work page 1977
-
[3]
to extend the upper limit frequency without reducing the tube diameter and material sizes. Multiple microphones are employed within the three-microphone framework to suppress circumferential modes at high fre- quencies in the impedance tube. This approach expands the valid frequency range of a tube with a diameter of 1.5 inches (38.1 cm) using the three-m...
work page internal anchor Pith review Pith/arXiv arXiv 2023
-
[4]
p(r) =R mn(r) =J m αmn · r a ,(2) whereJ m is the Bessel function ofmth order,mis the cir- cumferential modal number,nis the radial modal num- ber,α mn is the radial and axial wave numbers. With hard tube walls, the boundary condition atr=ais that the radial velocityv r = 0 (Rienstra, 2015). This implies thatα mn follows the boundary condition ∂p ∂r r=a =...
work page 2015
-
[5]
(9) Figure 1 shows the modal distributions in the cross sec- tion of a circular duct
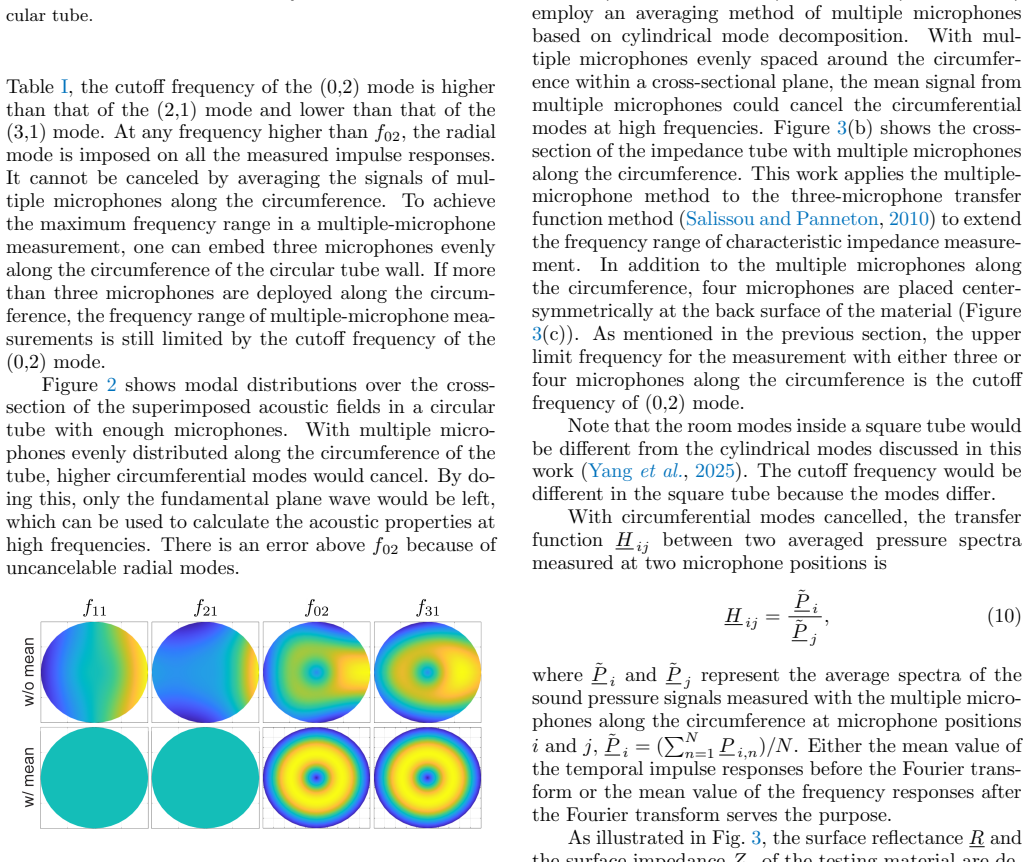
Φm(ϕ) = 1 N N−1X k=0 cos(mϕ+m· 2kπ N ).(8) Solving Equation (8) leads to Φm(ϕ) = ( 1, m= 0, 0, m >0∩m < N. (9) Figure 1 shows the modal distributions in the cross sec- tion of a circular duct. As illustrated, circumferential modes exhibit angular symmetry about the duct axis. By uniformly samplingNangular positions on a circle of constant radius centered ...
work page 2026
-
[6]
is a widely used method for measuring characteristic impedance. Figure 3 shows a sketch of the impedance tube setup for the three- microphone transfer function method. However, the sound wave modes inside the tube limit the traditional three-microphone method (ASTM E1050-19, 2019). The transfer function method assumes that the sound wave propagating along...
work page 2019
-
[7]
to extend the frequency range of characteristic impedance measure- ment. In addition to the multiple microphones along the circumference, four microphones are placed center- symmetrically at the back surface of the material (Figure 3(c)). As mentioned in the previous section, the upper limit frequency for the measurement with either three or four micropho...
work page 2025
-
[8]
by R = H 12 −e −γ0s e γ0s −H 12 e2γ0L,(11) and Z s =Z 0 1 +R 1−R ,(12) whereγ 0 is the propagation coefficient of air in the tube, sis the separation between the microphones Mic 1 and J. Acoust. Soc. Am. / 19 May 2026 JASA/Sample JASA Article 3 FIG
work page 2026
-
[9]
through rotating the rigid backing four times. Mic 2,Lis the distance from the front surface of the porous material to Mic 2, andZ 0 is the characteristic impedance of air. The key to obtaining the propagation coefficient and the characteristic impedance of the porous material under test is to calculate the transfer function Hd0, being the spectral ratio ...
work page 1998
-
[10]
as follows θ =k d= cos −1 H d0 = cos−1 1 +R e γ0(L−s) +R e−γ0(L−s) H 10 , (14) and Z c = jZ s tan(k d),(15) wheredis the thickness of the porous material under test. Equation (15) explicitly indicates that with the ex- perimentally measured surface impedanceZ s via Eq. (12) and the material thicknessdbeing avaiable, the char- acteristic impedanceZ c of th...
work page 2019
-
[11]
to avoid mi- crophone phase mismatches. The impulse responses are windowed to eliminate all unwanted reflections except the direct sound and the direct reflection from the test- ing samples. The three signals measured within each cross-sectional plane at microphone positions 1 and 2 are averaged, and the four signals measured at microphone position 0 are ...
work page 2022
-
[12]
(a) Transfer functions; (b) Propa- gation coefficients
Transfer functions and calculated propagation coeffi- cients for the hypothetical porous material of three different thicknesses,d= 2.75 cm. (a) Transfer functions; (b) Propa- gation coefficients. of mateirals, based on the experimental measurement of porous material of one thickness (d= 2.75 cm). Given the experimental dataH d0, the propagation coefficie...
work page 2026
-
[13]
with the assigned Gaussian prior as the weighting function for all subsequent data points. In this way, information from the posterior distribution is propagated into the prior knowledge at the next data point, thereby improving both the efficiency and accuracy of the estimation during the sampling process. The width of the prior distribution must be sele...
work page 2026
-
[14]
may also contribute to the observed high-frequency rip- ples. J. Acoust. Soc. Am. / 19 May 2026 JASA/Sample JASA Article 7 FIG
work page 2026
-
[15]
The solid black lines are the real parts, while the dashed lines are the imaginary parts
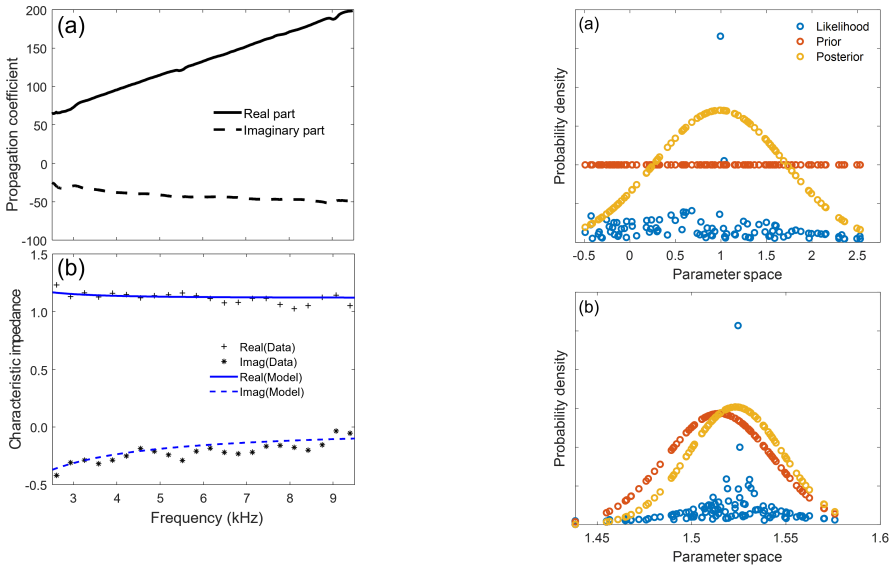
The estimation rresults (a) the propagation coeffi- cient; (b) the characteristic impedance. The solid black lines are the real parts, while the dashed lines are the imaginary parts. Blue lines are calculated from the Johnson-Champoux- Allard model (Champoux and Allard, 1991). One possible solution is to use a square tube in- stead of a circular tube for ...
work page 1991
-
[16]
is employed. A set of Gaussian (or initially a uniform) distributed parameter samples enters into the likelihood to arrive at the posterior samples. In essence, this up- dating process as shown in Fig. 8 is for the extremely sharply peaked likelihood to modify the prior probabil- 8 J. Acoust. Soc. Am. / 19 May 2026 JASA/Sample JASA Article ity/knowledge o...
work page 2026
-
[17]
Sharply peaked likelihood function over the param- eter space of one set of experimental data. The probability indicates that an extremely narrow region is the highest de- gree of confidence that the parameters to be estimated fall into this region. Using experimentally measured transfer function data, Figure 9 (a) shows the sharply peaked likelihood func...
work page 2020
-
[18]
According to cylindrical mode decomposition, mul- tiple impulse responses at Mic 0 are required for the multiple-microphone method. To preserve the rigidity of the back termination, only a single hole is drilled in the metal block, located off-center. During the measure- ments, the metal block is rotated by 90 ◦ in four suc- cessive orientations to acquir...
work page 2026
-
[19]
New empirical equa- tions for sound propagation in rigid frame fibrous materials,
will similarly encounter discontinuity prob- lems within broad frequency ranges, to determine the propagation coefficient and the characteristic impedance of porous media under test. There the necessary steps require inversion of cosine and sine functions as well. Any transfer function method involving the inversion of trigonometric functions can benefit ...
-
[20]
Transfer func- tion method” (Geneva). Iwase, T., Izumi, Y., and Kawabata, R. (1998). “A new mea- suring method for sound propagation constant by using sound tube without any air spaces back of a test material,” inINTER- NOISE Proc., Institute of Noise Control Engineering, Vol. 1998, pp. 1265–1268. Johnson, D. L., Koplik, J., and Dashen, R. (1987). “Theory...
discussion (0)
Sign in with ORCID, Apple, or X to comment. Anyone can read and Pith papers without signing in.