Cluster Analysis with Resampling for Validation and Exploration (CARVE)
Pith reviewed 2026-06-28 21:09 UTC · model grok-4.3
The pith
CARVE uses resampling to assess clustering stability and generalizability, recovering near-optimal solutions where geometric validation indices fail on biomedical data.
A machine-rendered reading of the paper's core claim, the machinery that carries it, and where it could break.
Core claim
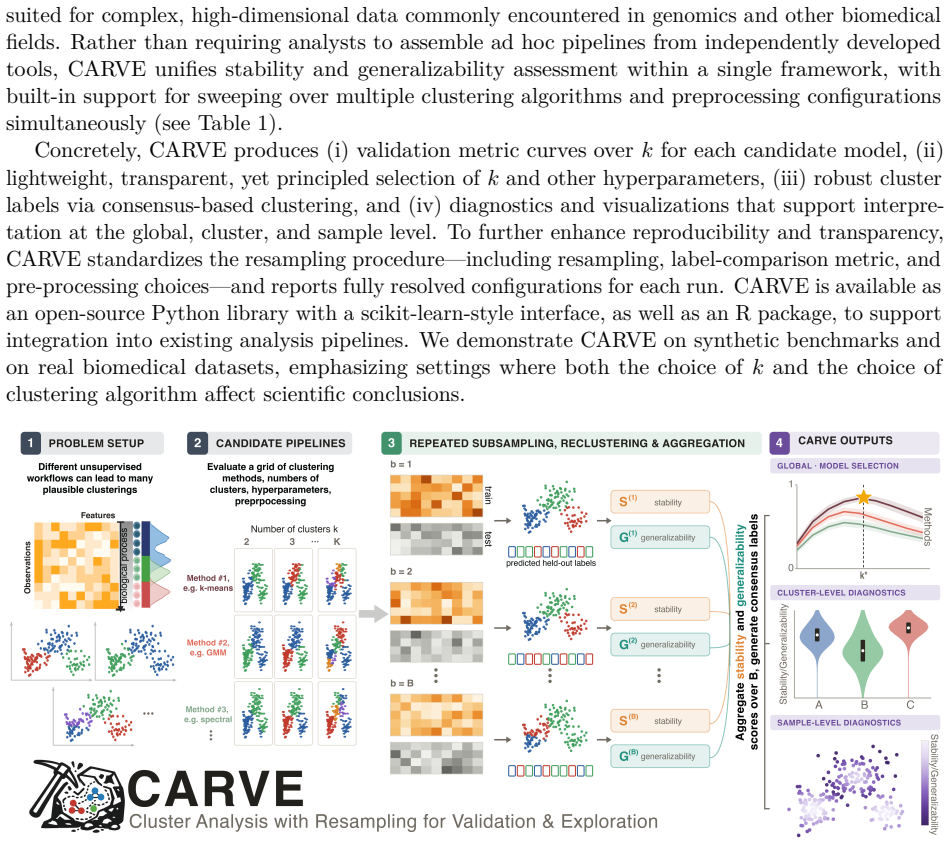
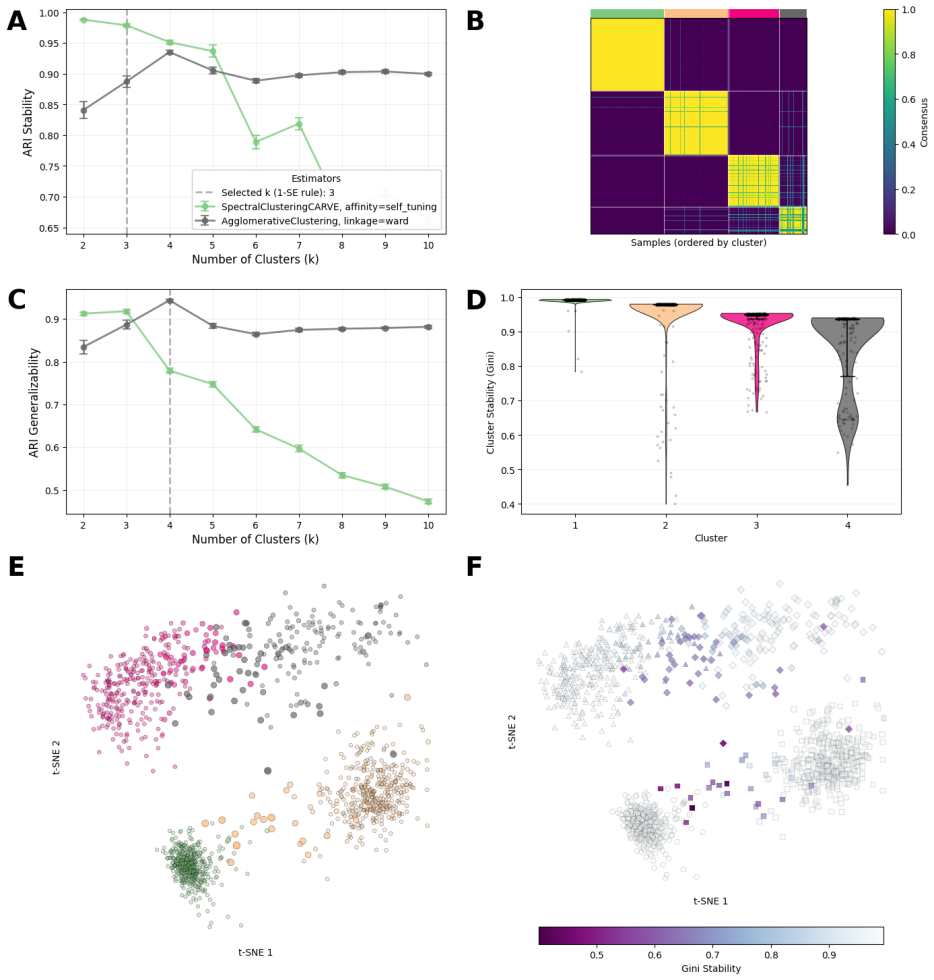
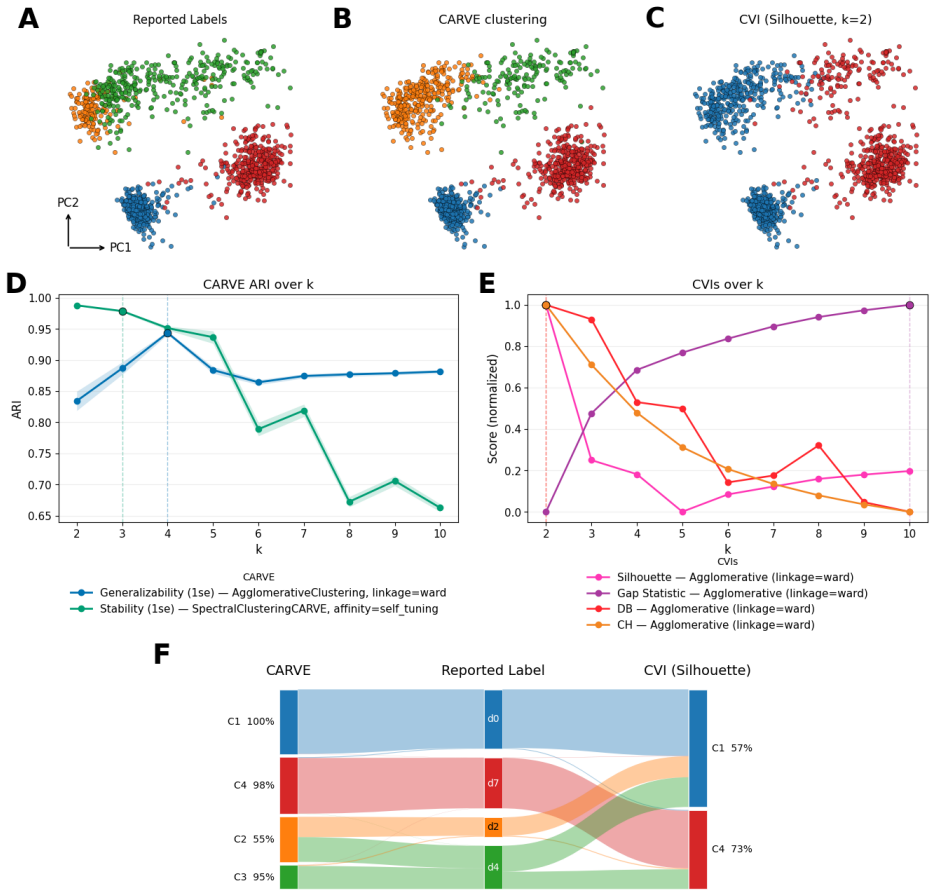
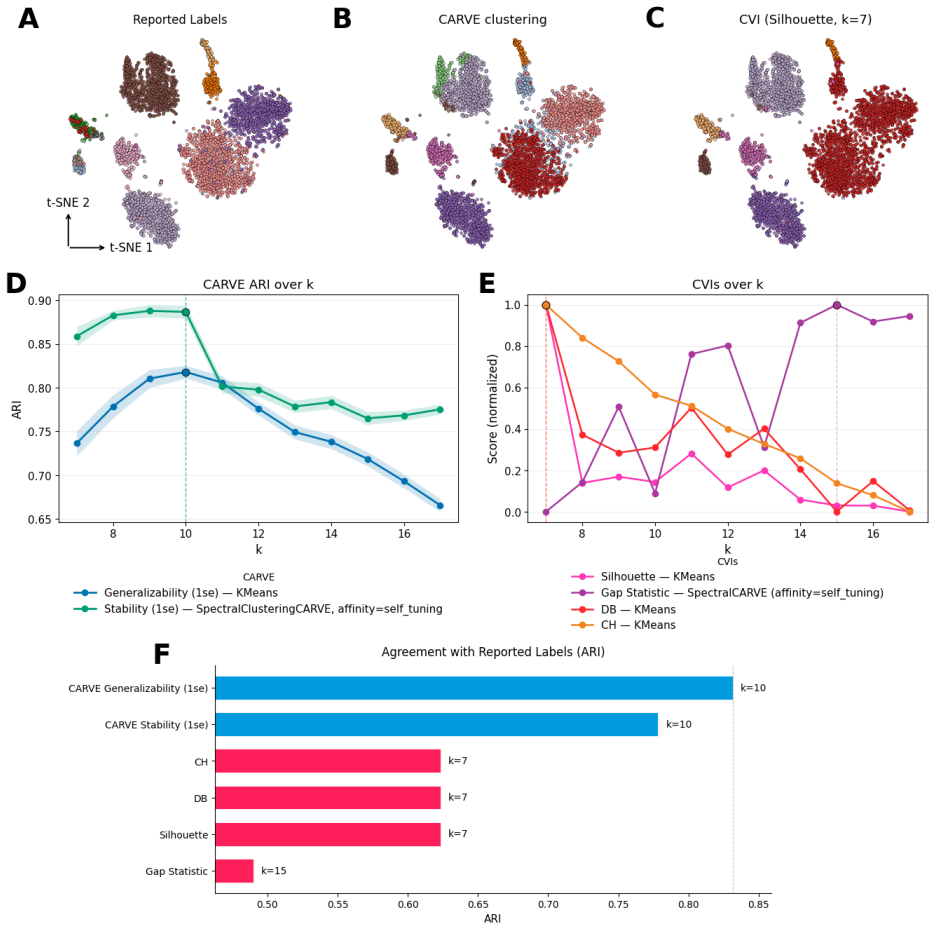
CARVE evaluates multiple clustering algorithms and hyperparameters through resampling procedures that quantify stability and generalizability, returning diagnostics at the global, cluster, and sample level together with principled selection rules and consensus-based cluster labels. Across six synthetic benchmarks this approach consistently recovers near-optimal clusterings. On experimental genomics and proteomics datasets it recovers finer biological structure when classical clustering validation indices collapse entirely.
What carries the argument
Resampling-based quantification of clustering stability and generalizability, applied jointly across algorithms and hyperparameters to produce multi-level diagnostics and selection rules.
If this is right
- CARVE recovers near-optimal clusterings across six synthetic benchmarks where classical indices degrade substantially.
- CARVE recovers finer biological structure on experimental genomics and proteomics data where classical CVIs collapse entirely.
- The package supplies principled selection rules and consensus-based cluster labels in addition to multi-level diagnostics.
- CARVE provides a scikit-learn-compatible Python API and an R interface compatible with Seurat workflows.
Where Pith is reading between the lines
- The same resampling stability logic could be tested on clustering tasks outside biomedicine, such as image segmentation or customer segmentation, to check whether geometric indices also underperform there.
- CARVE's emphasis on generalizability might be used to guide the development of new clustering algorithms that directly optimize for stability across resamples rather than geometric separation.
- Integration of CARVE diagnostics into automated pipelines could reduce the number of irreproducible clustering claims in large-scale omics studies.
Load-bearing premise
Stability and generalizability measured via resampling provide a more valid assessment of clustering quality than geometric indices for heavy-tailed, high-dimensional, nonlinear biomedical data.
What would settle it
A head-to-head test on the same genomics or proteomics datasets in which a classical geometric index selects a clustering that matches known biological labels more closely than the clustering selected by CARVE's resampling stability criteria.
Figures


read the original abstract
Clustering is widely used across the sciences as the foundation for downstream data-driven scientific discoveries. However, clustering results are highly sensitive to the choice of algorithm, preprocessing, and the number of clusters $k$, producing scientific claims that are often not reproducible. The current state of the art for validating clustering solutions consists of clustering validation indices (CVIs) such as Silhouette, Davies-Bouldin, and Calinski-Harabasz, which rely on geometric assumptions that break down on the heavy-tailed, high-dimensional, and nonlinearly structured data encountered in biomedical research. Resampling-based alternatives - grounded in the ideas of clustering stability and generalizability - have been proposed but remain scattered across specialized tools with no unified, accessible software. We fill this gap with CARVE (Cluster Analysis with Resampling for Validation and Exploration), an open-source Python and R package that jointly evaluates multiple clustering algorithms and hyperparameters, returning stability and generalizability diagnostics at the global, cluster, and sample level together with principled selection rules and consensus-based cluster labels. Across six synthetic benchmarks CARVE consistently recovers near-optimal clusterings where classical indices degrade substantially. On experimental genomics and proteomics data sets, CARVE recovers finer biological structure when classical CVIs collapse entirely. CARVE is available with a scikit-learn-compatible Python API and an analogous R interface compatible with Seurat workflows.
Editorial analysis
A structured set of objections, weighed in public.
Referee Report
Summary. The manuscript introduces CARVE, an open-source Python/R package implementing resampling-based diagnostics (stability and generalizability) for validating and selecting clusterings. It argues that geometric CVIs fail on heavy-tailed, high-dimensional biomedical data and presents empirical evidence that CARVE recovers near-optimal solutions on six synthetic benchmarks and finer biological structure on genomics/proteomics datasets where CVIs collapse.
Significance. If the resampling framework and selection rules prove robust, the unified, accessible implementation with scikit-learn and Seurat compatibility would address a practical gap in reproducible clustering for biomedical research. The open-source release and multi-level diagnostics (global, cluster, sample) are constructive contributions.
major comments (1)
- [Real-data experiments] Real-data experiments (genomics/proteomics section): the central claim that CARVE 'recovers finer biological structure' when CVIs collapse rests on qualitative post-hoc interpretation rather than quantitative external anchors (known subtype labels, pathway enrichment p-values, or agreement with orthogonal assays). This prevents a rigorous, measurable comparison to the synthetic benchmarks (where ground truth exists) and leaves the performance advantage over CVIs unquantified.
minor comments (1)
- [Abstract] Abstract: the number and identity of the six synthetic benchmarks, the specific genomics/proteomics datasets, and the range of k values tested are not stated, hindering immediate assessment of scope.
Simulated Author's Rebuttal
We thank the referee for the detailed and constructive review. We address the single major comment below.
read point-by-point responses
-
Referee: [Real-data experiments] Real-data experiments (genomics/proteomics section): the central claim that CARVE 'recovers finer biological structure' when CVIs collapse rests on qualitative post-hoc interpretation rather than quantitative external anchors (known subtype labels, pathway enrichment p-values, or agreement with orthogonal assays). This prevents a rigorous, measurable comparison to the synthetic benchmarks (where ground truth exists) and leaves the performance advantage over CVIs unquantified.
Authors: We agree that the genomics/proteomics results are presented via qualitative biological interpretation rather than quantitative external validation metrics. The synthetic benchmarks supply the controlled quantitative comparison against ground truth; the real-data section is intended to illustrate behavior on the heavy-tailed, high-dimensional data where CVIs are known to fail. In the revised manuscript we will add quantitative anchors where the chosen datasets permit them (e.g., adjusted Rand index against known cell-type or subtype labels when available, or hypergeometric pathway-enrichment p-values for the proteomics clusters) and will report these alongside the existing qualitative descriptions. This will allow a clearer, measurable contrast with the synthetic results while preserving the exploratory nature of the real-data analysis. revision: yes
Circularity Check
No circularity; empirical method presentation with no derivations or self-referential reductions
full rationale
The paper introduces the CARVE software package for resampling-based clustering validation and exploration. Its central claims rest on empirical performance comparisons across synthetic benchmarks and real genomics/proteomics datasets, with no equations, first-principles derivations, fitted parameters renamed as predictions, or load-bearing self-citations present in the abstract or described structure. The method builds on prior ideas of stability and generalizability but evaluates them through independent benchmarks rather than reducing any result to its own inputs by construction. This is a standard non-circular contribution of an applied methodological tool.
Axiom & Free-Parameter Ledger
Reference graph
Works this paper leans on
-
[1]
Interpretable machine learning for discovery: Statistical challenges and opportunities.Annual Review of Statistics and Its Application, 11, 2023
Genevera I Allen, Luqin Gan, and Lili Zheng. Interpretable machine learning for discovery: Statistical challenges and opportunities.Annual Review of Statistics and Its Application, 11, 2023
2023
-
[2]
Clustering approaches to identifying gene expression patterns from dna microarray data.Molecules and cells, 25(2):279–288, 2008
Jin Hwan Do and Dong-Kug Choi. Clustering approaches to identifying gene expression patterns from dna microarray data.Molecules and cells, 25(2):279–288, 2008
2008
-
[3]
Clustering algorithms: their application to gene expression data.Bioinformatics and Biology insights, 10:BBI–S38316, 2016
Jelili Oyelade, Itunuoluwa Isewon, Funke Oladipupo, Olufemi Aromolaran, Efosa Uwoghiren, Faridah Ameh, Moses Achas, and Ezekiel Adebiyi. Clustering algorithms: their application to gene expression data.Bioinformatics and Biology insights, 10:BBI–S38316, 2016
2016
-
[4]
Optimizing gene expression analysis using clustering algorithms
Thulasi Bikku, J Ramu, J Chandra Sekhar, V Krishna Pratap, and Jeevana Jyothi Pujari. Optimizing gene expression analysis using clustering algorithms. InInternational Conference on Computer & Communication Technologies, pages 163–171. Springer, 2023
2023
-
[5]
Model-based cognitive neuroscience approaches to computational psychiatry: clustering and classification.Clinical Psychological Science, 3(3):378–399, 2015
Thomas V Wiecki, Jeffrey Poland, and Michael J Frank. Model-based cognitive neuroscience approaches to computational psychiatry: clustering and classification.Clinical Psychological Science, 3(3):378–399, 2015
2015
-
[6]
Huaiqiang Sun, Su Lui, Li Yao, Wei Deng, Yuan Xiao, Wenjing Zhang, Xiaoqi Huang, Junmei Hu, Feng Bi, Tao Li, et al. Two patterns of white matter abnormalities in medication-naive patients with first-episode schizophrenia revealed by diffusion tensor imaging and cluster analysis.JAMA psychiatry, 72(7):678–686, 2015
2015
-
[7]
The application of unsupervised clustering methods to alzheimer’s disease.Frontiers in computational neuroscience, 13:31, 2019
Hany Alashwal, Mohamed El Halaby, Jacob J Crouse, Areeg Abdalla, and Ahmed A Moustafa. The application of unsupervised clustering methods to alzheimer’s disease.Frontiers in computational neuroscience, 13:31, 2019
2019
-
[8]
Image clustering: An unsupervised approach to categorize visual data in social science research.Sociological Methods & Research, 53(3):1534–1587, 2024
Han Zhang and Yilang Peng. Image clustering: An unsupervised approach to categorize visual data in social science research.Sociological Methods & Research, 53(3):1534–1587, 2024
2024
-
[9]
Social media analysis using optimized k-means clustering
Ahmed Alsayat and Hoda El-Sayed. Social media analysis using optimized k-means clustering. In2016 IEEE 14th international conference on software engineering research, management and applications (SERA), pages 61–66. IEEE, 2016
2016
-
[10]
Machine learning for social science: An agnostic approach.Annual Review of Political Science, 24(1):395–419, 2021
Justin Grimmer, Margaret E Roberts, and Brandon M Stewart. Machine learning for social science: An agnostic approach.Annual Review of Political Science, 24(1):395–419, 2021
2021
-
[11]
Michał Wielechowski, Denys Cherevyk, Katarzyna Czech, Pavel Kotyza, Łukasz Grzęda, and Lubos Smutka. Interdependence between human capital determinants and economic development: K-means regional clustering approach for czechia and poland.Entrepreneurial Business and Economics Review, 9(4):173–194, 2021
2021
-
[12]
Environmental and economic clustering of indonesian provinces: insights from k-means analysis.Leuser Journal of Environmental Studies, 2(1):41–51, 2024
Teuku Rizky Noviandy, Irsan Hardi, Zahriah Zahriah, Rahmi Sofyan, Novi Reandy Sasmita, Iin Shabrina Hilal, and Ghalieb Mutig Idroes. Environmental and economic clustering of indonesian provinces: insights from k-means analysis.Leuser Journal of Environmental Studies, 2(1):41–51, 2024
2024
-
[13]
Cluster analysis of the european union gender equality and economic development.Business, Management and Economics Engineering, 19(2):373–388, 2021
Oksana Vinska and Volodymyr Tokar. Cluster analysis of the european union gender equality and economic development.Business, Management and Economics Engineering, 19(2):373–388, 2021. 29
2021
-
[14]
Unsupervised classification of sdss galaxy spectra.Astronomy & Astrophysics, 649:A53, 2021
Didier Fraix-Burnet, Charles Bouveyron, and J Moultaka. Unsupervised classification of sdss galaxy spectra.Astronomy & Astrophysics, 649:A53, 2021
2021
-
[15]
Using chemical tagging to redefine the interface of the galactic disc and halo.Monthly Notices of the Royal Astronomical Society, 453(1):758–774, 2015
Keith Hawkins, Paula Jofre, Thomas Masseron, and Gerry Gilmore. Using chemical tagging to redefine the interface of the galactic disc and halo.Monthly Notices of the Royal Astronomical Society, 453(1):758–774, 2015
2015
-
[16]
Hierarchical clustering in astronomy.Astronomy and computing, 41:100662, 2022
Heng Yu and Xiaolan Hou. Hierarchical clustering in astronomy.Astronomy and computing, 41:100662, 2022
2022
-
[17]
Integration of cluster analysis and rock physics for the identification of potential hydrocarbon reservoir.Natural Resources Research, 30(2):1395–1409, 2021
Amjad Ali, Chen Sheng-Chang, and Munawar Shah. Integration of cluster analysis and rock physics for the identification of potential hydrocarbon reservoir.Natural Resources Research, 30(2):1395–1409, 2021
2021
-
[18]
Unsupervised clustering for collider physics.Physical Review D, 103(9):092007, 2021
Vinicius Mikuni and Florencia Canelli. Unsupervised clustering for collider physics.Physical Review D, 103(9):092007, 2021
2021
-
[19]
LucasHFrancisco, CamilaMAraújo, MCSilva, UlissesFKaneko, JairoFonsecaJr, GuilhermeA Calligaris, Audrey D Grockowiak, Danusa do Carmo, Ricardo D dos Reis, and Narcizo M Souza- Neto. Physics-informed unsupervised clustering approach to the identification of high-pressure elusive phases from spatially resolved x-ray diffraction large datasets.Photon Science, 2026
2026
-
[20]
Least squares quantization in pcm.IEEE transactions on information theory, 28(2):129–137, 1982
Stuart Lloyd. Least squares quantization in pcm.IEEE transactions on information theory, 28(2):129–137, 1982
1982
-
[21]
Luqin Gan, Tarek M Zikry, and Genevera I Allen. Are machine learning interpretations reliable? a stability study on global interpretations.arXiv preprint arXiv:2505.15728, 2025
-
[22]
Tang, Tarek M
Andersen Chang, Tiffany M. Tang, Tarek M. Zikry, and Genevera I. Allen. Unsupervised machine learning for scientific discovery: Workflow and best practices.arXiv preprint, 2025
2025
-
[23]
Perspectives on rigor and reproducibility in single cell genomics.PLoS Genetics, 18(5):e1010210, 2022
Greg Gibson. Perspectives on rigor and reproducibility in single cell genomics.PLoS Genetics, 18(5):e1010210, 2022
2022
-
[24]
Cluster headache: comparing clustering tools for 10x single cell sequencing data.bioRxiv, page 203752, 2017
Saskia Freytag, Ingrid Lonnstedt, Milica Ng, and Melanie Bahlo. Cluster headache: comparing clustering tools for 10x single cell sequencing data.bioRxiv, page 203752, 2017
2017
-
[25]
Single cell rna-sequencing: replicability of cell types.Current opinion in neurobiology, 56:69–77, 2019
Megan Crow and Jesse Gillis. Single cell rna-sequencing: replicability of cell types.Current opinion in neurobiology, 56:69–77, 2019
2019
-
[26]
The specious art of single-cell genomics.PLOS Computational Biology, 19(8):e1011288, 2023
Tara Chari and Lior Pachter. The specious art of single-cell genomics.PLOS Computational Biology, 19(8):e1011288, 2023
2023
-
[27]
John Wiley & Sons, 2009
Leonard Kaufman and Peter J Rousseeuw.Finding groups in data: an introduction to cluster analysis. John Wiley & Sons, 2009
2009
-
[28]
Hierarchical grouping to optimize an objective function.Journal of the American Statistical Association, 58(301):236–244, 1963
Joe H Ward Jr. Hierarchical grouping to optimize an objective function.Journal of the American Statistical Association, 58(301):236–244, 1963
1963
-
[29]
A tutorial on spectral clustering.Statistics and computing, 17(4):395–416, 2007
Ulrike Von Luxburg. A tutorial on spectral clustering.Statistics and computing, 17(4):395–416, 2007. 30
2007
-
[30]
A density-based algorithm for discovering clusters in large spatial databases with noise
Martin Ester, Hans-Peter Kriegel, Jörg Sander, and Xiaowei Xu. A density-based algorithm for discovering clusters in large spatial databases with noise. InProceedings of the 2nd International Conference on Knowledge Discovery and Data Mining (KDD), pages 226–231, 1996
1996
-
[31]
Density-based clustering based on hierarchical density estimates.Advances in Knowledge Discovery and Data Mining, pages 160–172, 2013
Ricardo JGB Campello, Davoud Moulavi, and Jörg Sander. Density-based clustering based on hierarchical density estimates.Advances in Knowledge Discovery and Data Mining, pages 160–172, 2013
2013
-
[32]
Springer, 2006
Christopher M Bishop and Nasser M Nasrabadi.Pattern recognition and machine learning, volume 4. Springer, 2006
2006
-
[33]
From louvain to leiden: guaranteeing well-connected communities.Scientific Reports, 9(1):5233, 2019
Vincent A Traag, Ludo Waltman, and Nees Jan Van Eck. From louvain to leiden: guaranteeing well-connected communities.Scientific Reports, 9(1):5233, 2019
2019
-
[34]
Visualizing data using t-SNE.Journal of Machine Learning Research, 9:2579–2605, 2008
Laurens Van der Maaten and Geoffrey Hinton. Visualizing data using t-SNE.Journal of Machine Learning Research, 9:2579–2605, 2008
2008
-
[35]
Data-driven phenotypic dissection of aml reveals progenitor-like cells that correlate with prognosis.Cell, 162(1):184–197, 2015
Jacob H Levine, Erin F Simonds, Sean C Bendall, Kara L Davis, El-ad D Amir, Michelle D Tadmor, Oren Litvin, Harris G Fienberg, Astraea Jager, Eli R Zunder, et al. Data-driven phenotypic dissection of aml reveals progenitor-like cells that correlate with prognosis.Cell, 162(1):184–197, 2015
2015
-
[36]
Analysis of a complex of statistical variables into principal components
Harold Hotelling. Analysis of a complex of statistical variables into principal components. Journal of Educational Psychology, 24(6):417–441, 1933
1933
-
[37]
Droplet barcoding for single-cell transcriptomics applied to embryonic stem cells.Cell, 161(5):1187–1201, 2015
Allon M Klein, Linas Mazutis, Ilke Akartuna, Naren Tallapragada, Adrian Veres, Victor Li, Leonid Peshkin, David A Weitz, and Marc W Kirschner. Droplet barcoding for single-cell transcriptomics applied to embryonic stem cells.Cell, 161(5):1187–1201, 2015
2015
-
[38]
Silhouettes: a graphical aid to the interpretation and validation of cluster analysis.Journal of computational and applied mathematics, 20:53–65, 1987
Peter J Rousseeuw. Silhouettes: a graphical aid to the interpretation and validation of cluster analysis.Journal of computational and applied mathematics, 20:53–65, 1987
1987
-
[39]
A cluster separation measure.IEEE transactions on pattern analysis and machine intelligence, n.a.(2):224–227, 2009
David L Davies and Donald W Bouldin. A cluster separation measure.IEEE transactions on pattern analysis and machine intelligence, n.a.(2):224–227, 2009
2009
-
[40]
A dendrite method for cluster analysis.Communications in Statistics-theory and Methods, 3(1):1–27, 1974
Tadeusz Caliński and Jerzy Harabasz. A dendrite method for cluster analysis.Communications in Statistics-theory and Methods, 3(1):1–27, 1974
1974
-
[41]
Estimating the number of clusters in a data set via the gap statistic.Journal of the royal statistical society: series b (statistical methodology), 63(2):411–423, 2001
Robert Tibshirani, Guenther Walther, and Trevor Hastie. Estimating the number of clusters in a data set via the gap statistic.Journal of the royal statistical society: series b (statistical methodology), 63(2):411–423, 2001
2001
-
[42]
Clustering: Science or art? InProceedings of ICML workshop on unsupervised and transfer learning, pages 65–79
Ulrike Von Luxburg, Robert C Williamson, and Isabelle Guyon. Clustering: Science or art? InProceedings of ICML workshop on unsupervised and transfer learning, pages 65–79. JMLR Workshop and Conference Proceedings, 2012
2012
-
[43]
A prediction-based resampling method for estimating the number of clusters in a dataset.Genome biology, 3:1–21, 2002
Sandrine Dudoit and Jane Fridlyand. A prediction-based resampling method for estimating the number of clusters in a dataset.Genome biology, 3:1–21, 2002
2002
-
[44]
Clustering deviation index (cdi): a robust and accurate internal measure for evaluating scrna-seq data clustering.Genome Biology, 23(1):269, 2022
Jiyuan Fang, Cliburn Chan, Kouros Owzar, Liuyang Wang, Diyuan Qin, Qi-Jing Li, and Jichun Xie. Clustering deviation index (cdi): a robust and accurate internal measure for evaluating scrna-seq data clustering.Genome Biology, 23(1):269, 2022. 31
2022
-
[45]
Shortcomings of silhouette in single-cell integration benchmarking.Nature Biotechnology, pages 1–5, 2025
Pia Rautenstrauch and Uwe Ohler. Shortcomings of silhouette in single-cell integration benchmarking.Nature Biotechnology, pages 1–5, 2025
2025
-
[46]
An extensive comparative study of cluster validity indices.Pattern recognition, 46(1):243–256, 2013
Olatz Arbelaitz, Ibai Gurrutxaga, Javier Muguerza, Jesús M Pérez, and Iñigo Perona. An extensive comparative study of cluster validity indices.Pattern recognition, 46(1):243–256, 2013
2013
-
[47]
Are cluster validity measures (in) valid? Information Sciences, 581:620–636, 2021
Marek Gagolewski, Maciej Bartoszuk, and Anna Cena. Are cluster validity measures (in) valid? Information Sciences, 581:620–636, 2021
2021
-
[48]
Relative clustering validity criteria: A comparative overview.Statistical analysis and data mining: the ASA data science journal, 3(4):209–235, 2010
Lucas Vendramin, Ricardo JGB Campello, and Eduardo R Hruschka. Relative clustering validity criteria: A comparative overview.Statistical analysis and data mining: the ASA data science journal, 3(4):209–235, 2010
2010
-
[49]
Benchmarking validity indices for evolutionary k-means clustering performance.Scientific Reports, 15(1):21842, 2025
Abiodun M Ikotun, Faustin Habyarimana, and Absalom E Ezugwu. Benchmarking validity indices for evolutionary k-means clustering performance.Scientific Reports, 15(1):21842, 2025
2025
-
[50]
Consensusclustering: aresampling- based method for class discovery and visualization of gene expression microarray data.Machine learning, 52:91–118, 2003
StefanoMonti, PabloTamayo, JillMesirov, andToddGolub. Consensusclustering: aresampling- based method for class discovery and visualization of gene expression microarray data.Machine learning, 52:91–118, 2003
2003
-
[51]
A stability based method for discovering structure in clustered data
Asa Ben-Hur, Andre Elisseeff, and Isabelle Guyon. A stability based method for discovering structure in clustered data. InBiocomputing 2002, pages 6–17. World Scientific, 2001
2002
-
[52]
Bagging to improve the accuracy of a clustering procedure
Sandrine Dudoit and Jane Fridlyand. Bagging to improve the accuracy of a clustering procedure. Bioinformatics, 19(9):1090–1099, 2003
2003
-
[53]
Bootstrapping cluster analysis: assessing the reliability of conclusions from microarray experiments.Proceedings of the national academy of sciences, 98(16):8961–8965, 2001
M Kathleen Kerr and Gary A Churchill. Bootstrapping cluster analysis: assessing the reliability of conclusions from microarray experiments.Proceedings of the national academy of sciences, 98(16):8961–8965, 2001
2001
-
[54]
Resampling method for unsupervised estimation of cluster validity.Neural computation, 13(11):2573–2593, 2001
Erel Levine and Eytan Domany. Resampling method for unsupervised estimation of cluster validity.Neural computation, 13(11):2573–2593, 2001
2001
-
[55]
Selection of the number of clusters via the bootstrap method
Yixin Fang and Junhui Wang. Selection of the number of clusters via the bootstrap method. Computational Statistics & Data Analysis, 56(3):468–477, 2012
2012
-
[56]
Bootstrap technique in cluster analysis.Pattern Recognition, 20(5):547–568, 1987
Anil K Jain and JV Moreau. Bootstrap technique in cluster analysis.Pattern Recognition, 20(5):547–568, 1987
1987
-
[57]
Stability analysis in k-means clustering.British Journal of Mathematical and Statistical Psychology, 61(2):255–273, 2008
Douglas Steinley. Stability analysis in k-means clustering.British Journal of Mathematical and Statistical Psychology, 61(2):255–273, 2008
2008
-
[58]
Bootstrapping estimates of stability for clusters, observations and model selection.Computational Statistics, 34:349–372, 2019
Han Yu, Brian Chapman, Arianna Di Florio, Ellen Eischen, David Gotz, Mathews Jacob, and Rachael Hageman Blair. Bootstrapping estimates of stability for clusters, observations and model selection.Computational Statistics, 34:349–372, 2019
2019
-
[59]
Optimal transport, mean partition, and uncertainty assessment in cluster analysis.Statistical Analysis and Data Mining: The ASA Data Science Journal, 12(5):359–377, 2019
Jia Li, Beomseok Seo, and Lin Lin. Optimal transport, mean partition, and uncertainty assessment in cluster analysis.Statistical Analysis and Data Mining: The ASA Data Science Journal, 12(5):359–377, 2019
2019
-
[60]
Cluster-wise assessment of cluster stability.Computational Statistics & Data Analysis, 52(1):258–271, 2007
Christian Hennig. Cluster-wise assessment of cluster stability.Computational Statistics & Data Analysis, 52(1):258–271, 2007. 32
2007
-
[61]
Stability estimation for unsupervised clustering: A review.Wiley Interdisciplinary Reviews: Computational Statistics, 14(6):e1575, 2022
Tianmou Liu, Han Yu, and Rachael Hageman Blair. Stability estimation for unsupervised clustering: A review.Wiley Interdisciplinary Reviews: Computational Statistics, 14(6):e1575, 2022
2022
-
[62]
Stability-based validation of clustering solutions.Neural computation, 16(6):1299–1323, 2004
Tilman Lange, Volker Roth, Mikio L Braun, and Joachim M Buhmann. Stability-based validation of clustering solutions.Neural computation, 16(6):1299–1323, 2004
2004
-
[63]
Cluster validation by prediction strength.Journal of Computational and Graphical Statistics, 14(3):511–528, 2005
Robert Tibshirani and Guenther Walther. Cluster validation by prediction strength.Journal of Computational and Graphical Statistics, 14(3):511–528, 2005
2005
-
[64]
A new cluster validation index based on stability analysis
Adane Nega Tarekegn, Bjørnar Tessem, and Fazle Rabbi. A new cluster validation index based on stability analysis. InICPRAM, page n.a., 2025
2025
-
[65]
Validation of cluster analysis results on validation data: A systematic framework.Wiley Interdisciplinary Reviews: Data Mining and Knowledge Discovery, 12(3):e1444, 2022
Theresa Ullmann, Christian Hennig, and Anne-Laure Boulesteix. Validation of cluster analysis results on validation data: A systematic framework.Wiley Interdisciplinary Reviews: Data Mining and Knowledge Discovery, 12(3):e1444, 2022
2022
-
[66]
Computational cluster validation in post-genomic data analysis.Bioinformatics, 21(15):3201–3212, 2005
Julia Handl, Joshua Knowles, and Douglas B Kell. Computational cluster validation in post-genomic data analysis.Bioinformatics, 21(15):3201–3212, 2005
2005
-
[67]
Investigating cluster vali- dation metrics for optimal number of clusters determination.Intelligent Decision Technologies, 15(4):809–824, 2021
Aikaterini Karanikola, Charalampos M Liapis, and Sotiris Kotsiantis. Investigating cluster vali- dation metrics for optimal number of clusters determination.Intelligent Decision Technologies, 15(4):809–824, 2021
2021
-
[68]
From a-to-z review of clustering validation indices.Neurocomputing, 601:128198, 2024
Bryar A Hassan, Noor Bahjat Tayfor, Alla A Hassan, Aram M Ahmed, Tarik A Rashid, and Naz N Abdalla. From a-to-z review of clustering validation indices.Neurocomputing, 601:128198, 2024
2024
-
[69]
Clustering evaluation in high-dimensional data
Nenad Tomašev and Miloš Radovanović. Clustering evaluation in high-dimensional data. In Unsupervised learning algorithms, pages 71–107. Springer, 2016
2016
-
[70]
Ikotun et al
A.M. Ikotun et al. Cluster validity indices for automatic clustering: A comprehensive review. Heliyon, 11(8):e41953, 2025
2025
-
[71]
On clustering validation techniques
Maria Halkidi, Yannis Batistakis, and Michalis Vazirgiannis. On clustering validation techniques. Journal of Intelligent Information Systems, 17(2):107–145, 2001
2001
-
[72]
Extended multivariate comparison of 68 cluster validity indices
Roberto Todeschini, Davide Ballabio, Veronica Termopoli, and Viviana Consonni. Extended multivariate comparison of 68 cluster validity indices. a review.Chemometrics and Intelligent Laboratory Systems, 251:105117, 2024
2024
-
[73]
Clustering stability: an overview.Foundations and Trends®in Machine Learning, 2(3):235–274, 2010
Ulrike Von Luxburg et al. Clustering stability: an overview.Foundations and Trends®in Machine Learning, 2(3):235–274, 2010
2010
-
[74]
A white paper on good research practices in benchmarking: The case of cluster analysis.Wiley Interdisciplinary Reviews: Data Mining and Knowledge Discovery, 13(6):e1511, 2023
Iven Van Mechelen, Anne-Laure Boulesteix, Rainer Dangl, Nema Dean, Christian Hennig, Friedrich Leisch, Douglas Steinley, and Matthijs J Warrens. A white paper on good research practices in benchmarking: The case of cluster analysis.Wiley Interdisciplinary Reviews: Data Mining and Knowledge Discovery, 13(6):e1511, 2023
2023
-
[75]
Nbclust: an r package for determining the relevant number of clusters in a data set.Journal of statistical software, 61:1–36, 2014
Malika Charrad, Nadia Ghazzali, Véronique Boiteau, and Azam Niknafs. Nbclust: an r package for determining the relevant number of clusters in a data set.Journal of statistical software, 61:1–36, 2014. 33
2014
-
[76]
Veridical data science
Bin Yu. Veridical data science. InProceedings of the 13th international conference on web search and data mining, pages 4–5, 2020
2020
-
[77]
clvalid: An r package for cluster validation.Journal of statistical Software, 25:1–22, 2008
Guy Brock, Vasyl Pihur, Susmita Datta, and Somnath Datta. clvalid: An r package for cluster validation.Journal of statistical Software, 25:1–22, 2008
2008
-
[78]
Valworkbench: An open source java library for cluster validation, with applications to microarray data analysis.Computer methods and programs in biomedicine, 118(2):207–217, 2015
Raffaele Giancarlo, Davide Scaturro, and Filippo Utro. Valworkbench: An open source java library for cluster validation, with applications to microarray data analysis.Computer methods and programs in biomedicine, 118(2):207–217, 2015
2015
-
[79]
reval: A python package to determine best clustering solutions with stability-based relative clustering validation.Patterns, 2(4), 2021
Isotta Landi, Veronica Mandelli, and Michael V Lombardo. reval: A python package to determine best clustering solutions with stability-based relative clustering validation.Patterns, 2(4), 2021
2021
-
[80]
Package ’fpc’.Flexible procedures for clustering, 1176, 2015
Christian Hennig and MASS Imports. Package ’fpc’.Flexible procedures for clustering, 1176, 2015
2015
discussion (0)
Sign in with ORCID, Apple, or X to comment. Anyone can read and Pith papers without signing in.