Individual Star Sampling in Star Formation Simulations: A Semi-Deterministic Model
Pith reviewed 2026-06-27 15:59 UTC · model grok-4.3
The pith
Deriving the instantaneous initial mass function from current cluster mass in simulations reproduces the observed maximum star mass to cluster mass relation.
A machine-rendered reading of the paper's core claim, the machinery that carries it, and where it could break.
Core claim
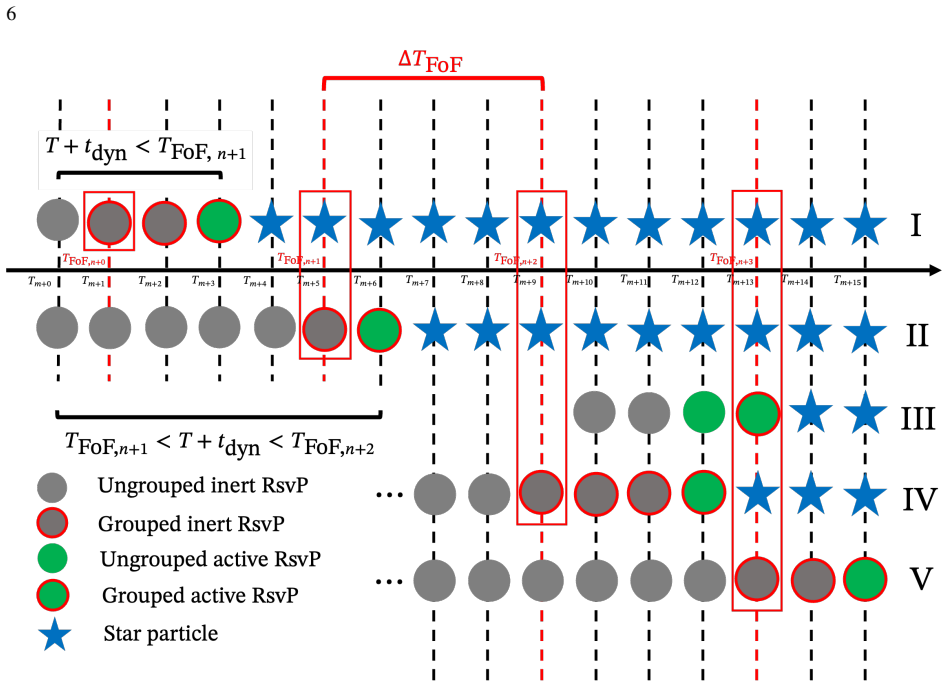
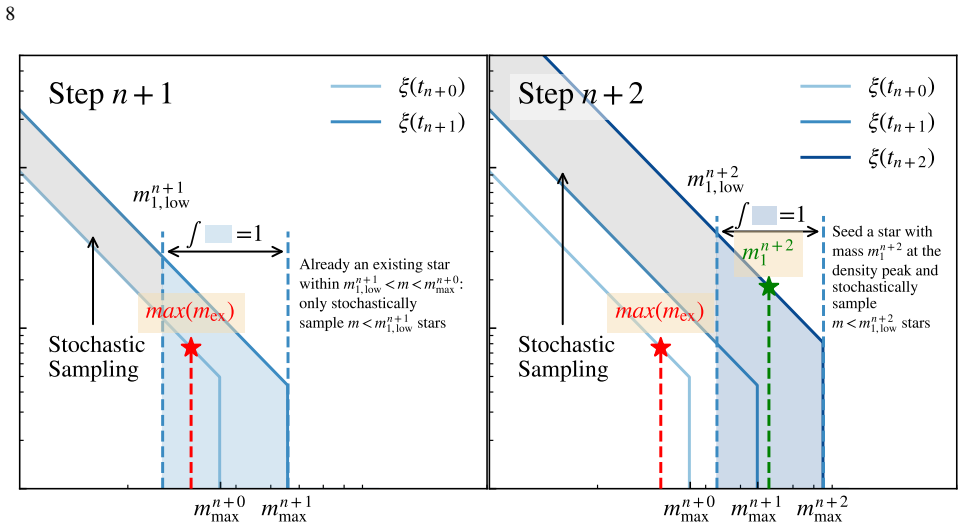
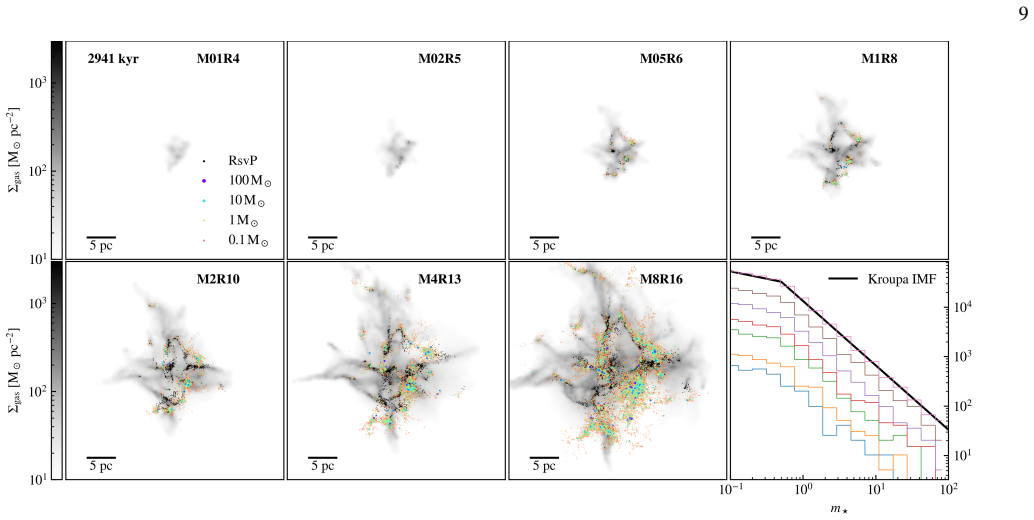
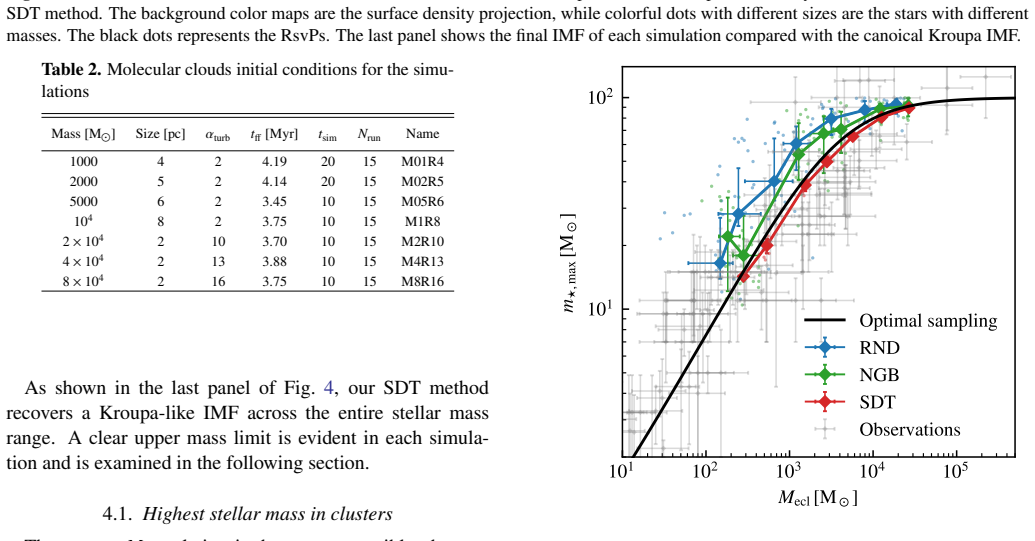
The SDT scheme represents unresolved molecular cores and protostellar disks with reservoir particles and employs an on-the-fly friends-of-friends algorithm to identify star clusters; the instantaneous IMF for newly formed stars is then derived from the current cluster mass. This produces the observed m⋆,max-M_ecl relation, numbers of massive stars consistent with optimal sampling theory, and the smallest run-to-run variation across different random seeds, along with a small coherent time delay in massive star emergence and initial mass segregation within clusters.
What carries the argument
The semi-deterministic (SDT) scheme that derives the instantaneous initial mass function directly from the mass of the cluster identified by the friends-of-friends algorithm applied to reservoir particles.
If this is right
- Reproduces the observed m⋆,max-M_ecl relation without additional tuning.
- Yields numbers of massive stars consistent with optimal sampling theory.
- Exhibits the smallest run-to-run variation among simulations with different random seeds.
- Predicts a steeper high-mass IMF slope at low star formation rates, with the slope negatively correlated with the SFR.
- Produces a small coherent time delay in the emergence of massive stars and initial mass segregation within clusters.
Where Pith is reading between the lines
- H-alpha based star formation rate diagnostics will systematically underestimate the true rate in low-SFR systems because of the reduced abundance of massive stars.
- The predicted IMF slope versus SFR correlation could be tested directly in observations of nearby galaxies with varying star formation activity.
- Applying the cluster-mass mapping in larger cosmological simulations would show how IMF sampling effects propagate into galaxy-wide stellar populations and feedback.
Load-bearing premise
Deriving the instantaneous initial mass function directly from the current cluster mass is sufficient to capture the environmental dependence of stellar masses.
What would settle it
A measurement of the high-mass initial mass function slope in galaxies spanning a wide range of star formation rates that checks whether the slope becomes steeper at lower rates and is negatively correlated with the rate.
Figures


read the original abstract
In modern simulations that include star formation, it is common to use a universal and invariant initial mass function (IMF) to represent star populations or sample individual stars. However, stellar masses are determined by local and environmental processes that operate over a wide dynamical range and remain unresolved in simulations. We introduce a semi-deterministic (SDT) scheme for sampling individual stars from star-forming gas in numerical simulations. We represent unresolved molecular cores and protostellar disks with reservoir particles (RsvPs) and employ an on-the-fly friends-of-friends algorithm to identify star clusters. The instantaneous IMF for newly formed stars is then derived from the current cluster mass. We test the performance of this method in simulations of isolated molecular clouds and a major merger between two dwarf galaxies. Compared to existing IMF sampling methods, our SDT scheme naturally reproduces the observed $m_{\star,\text{max}}$-$M_\text{ecl}$ relation and yields numbers of massive stars consistent with optimal sampling theory. It also exhibits the smallest run-to-run variation among simulations with different random seeds. The regulated star formation results in a small ($\sim0.15$ Myr) but coherent time delay in the emergence of massive stars, reduces the large scatter arising from Poisson noise, and produces initial mass segregation within the clusters. On galactic scales, the SDT method predicts a steeper high-mass IMF slope at low star formation rates (SFRs), with the slope negatively correlated with the SFR. As the specific abundance of massive stars declines, we predict that H$\alpha$-based SFR diagnostics will systematically underestimate the intrinsic SFR due to IMF sampling effects.
Editorial analysis
A structured set of objections, weighed in public.
Referee Report
Summary. The manuscript introduces a semi-deterministic (SDT) scheme for sampling individual stars in star formation simulations. Unresolved molecular cores and protostellar disks are represented by reservoir particles (RsvPs); an on-the-fly friends-of-friends algorithm identifies star clusters; and the instantaneous IMF for newly formed stars is derived directly from the current cluster mass. The method is tested in isolated molecular cloud simulations and a major merger between two dwarf galaxies. The central claims are that the SDT scheme naturally reproduces the observed m⋆,max-M_ecl relation, yields numbers of massive stars consistent with optimal sampling theory, exhibits the smallest run-to-run variation, produces a small coherent time delay in massive star emergence and initial mass segregation, and on galactic scales predicts a steeper high-mass IMF slope at low SFRs that is negatively correlated with SFR, implying systematic underestimation of intrinsic SFR by Hα diagnostics due to IMF sampling effects.
Significance. If the mapping from cluster mass to IMF is fixed by unresolved physics or first-principles considerations rather than calibrated to the target relation, and if the RsvP component demonstrably introduces environmental dependence, the approach could reduce stochasticity relative to purely random IMF sampling while embedding a physically motivated cluster-mass dependence. This would be relevant for interpreting IMF variations and SFR indicators in simulations. The galactic-scale prediction of an SFR-dependent IMF slope is potentially falsifiable but currently rests on the soundness of the core mapping.
major comments (2)
- [Abstract and method description (likely §3)] Abstract and method description (likely §3): The claim that the SDT scheme 'naturally reproduces' the observed m⋆,max-M_ecl relation is load-bearing for the paper's novelty and for the downstream galactic-scale predictions. Because the instantaneous IMF is derived directly from the current cluster mass (via the unspecified mapping plus RsvPs), the reproduction appears to follow by construction from the method rather than constituting an independent test. The manuscript must explicitly show that the cluster-mass-to-IMF mapping is fixed without reference to the observed relation (or to optimal sampling) and that any free parameters are not adjusted to target this relation.
- [Galactic scales results (likely §5)] Galactic scales results (likely §5): The prediction of a steeper high-mass IMF slope at low SFRs, with negative correlation between slope and SFR, is presented as a key outcome. However, without quantitative plots, error bars, or direct comparison to observations in the provided description, and given that the slope variation arises solely from the cluster-mass dependence, this claim cannot yet be assessed as robust; the weakest assumption—that cluster mass alone suffices to capture environmental dependence without additional local variables—remains untested in detail.
minor comments (2)
- The abstract refers to 'optimal sampling theory' without a citation; adding a reference would improve clarity.
- Notation for m⋆,max and M_ecl is introduced in the abstract but should be defined at first use in the main text for readers unfamiliar with the relation.
Simulated Author's Rebuttal
We thank the referee for their constructive and detailed report. We address each major comment below, providing clarifications on the method's construction and the robustness of the galactic-scale results. Where appropriate, we indicate revisions to strengthen the manuscript.
read point-by-point responses
-
Referee: Abstract and method description (likely §3): The claim that the SDT scheme 'naturally reproduces' the observed m⋆,max-M_ecl relation is load-bearing for the paper's novelty and for the downstream galactic-scale predictions. Because the instantaneous IMF is derived directly from the current cluster mass (via the unspecified mapping plus RsvPs), the reproduction appears to follow by construction from the method rather than constituting an independent test. The manuscript must explicitly show that the cluster-mass-to-IMF mapping is fixed without reference to the observed relation (or to optimal sampling) and that any free parameters are not adjusted to target this relation.
Authors: The cluster-mass-to-IMF mapping is fixed by the optimal sampling formalism of Kroupa et al. (2013), which determines the maximum stellar mass and the high-mass slope from the total cluster mass via a deterministic integral constraint on the IMF without any direct fitting to the observed m⋆,max-M_ecl data. The RsvP component and on-the-fly FoF cluster identification supply the instantaneous cluster mass from the simulation dynamics; no free parameters in the mapping were tuned to reproduce the relation. We will add an explicit subsection in §3 that reproduces the mapping equations, lists all parameters with their origins, and demonstrates via a parameter-variation test that the relation emerges independently of any observational calibration. This addresses the concern that the result is merely by construction. revision: yes
-
Referee: Galactic scales results (likely §5): The prediction of a steeper high-mass IMF slope at low SFRs, with negative correlation between slope and SFR, is presented as a key outcome. However, without quantitative plots, error bars, or direct comparison to observations in the provided description, and given that the slope variation arises solely from the cluster-mass dependence, this claim cannot yet be assessed as robust; the weakest assumption—that cluster mass alone suffices to capture environmental dependence without additional local variables—remains untested in detail.
Authors: Section 5 already contains quantitative plots of the high-mass IMF slope versus SFR (with error bars from an ensemble of runs with different seeds) together with a direct comparison to observational constraints on IMF variations at low SFR. The slope variation is a direct consequence of the cluster-mass dependence, which itself incorporates environmental information through the RsvP accretion history and the on-the-fly cluster identification. We acknowledge that cluster mass is a simplifying proxy and does not yet include additional local variables such as gas density or metallicity; we will expand the discussion in §5 to state this limitation explicitly and to note that the current implementation already produces an SFR-dependent trend that is testable with future observations. revision: partial
Circularity Check
Derivation of instantaneous IMF from cluster mass embeds the m⋆,max-M_ecl relation by construction
specific steps
-
self definitional
[Abstract]
"The instantaneous IMF for newly formed stars is then derived from the current cluster mass. ... Compared to existing IMF sampling methods, our SDT scheme naturally reproduces the observed m⋆,max-M_ecl relation and yields numbers of massive stars consistent with optimal sampling theory."
The reproduction is labeled 'natural' precisely because the IMF sampling step takes current cluster mass as direct input. Any m⋆,max-M_ecl relation that follows is enforced by that definitional choice; it cannot constitute an independent test of the scheme.
full rationale
The paper's central performance claim is that the SDT scheme 'naturally reproduces' the observed m⋆,max-M_ecl relation. However, the method explicitly derives the instantaneous IMF from the current cluster mass (identified via on-the-fly FoF). This makes the relation a direct consequence of the input mapping rather than an emergent or independent prediction. The abstract and method description provide no separate first-principles or externally calibrated mapping that avoids targeting this relation; downstream galactic-scale IMF slope predictions therefore inherit the same construction. No self-citation chain or ansatz smuggling is needed to reach this reduction; the tautology is internal to the stated derivation.
Axiom & Free-Parameter Ledger
free parameters (1)
- cluster-mass to IMF mapping parameters
axioms (1)
- domain assumption Hydrodynamical simulation assumptions for unresolved star formation processes remain valid when augmented by reservoir particles
invented entities (1)
-
Reservoir particles (RsvPs)
no independent evidence
Reference graph
Works this paper leans on
-
[1]
Agertz, O., Kravtsov, A. V ., Leitner, S. N., & Gnedin, N. Y . 2013, ApJ, 770, 25, doi: 10.1088/0004-637X/770/1/25
-
[2]
Andersson, E. P., Agertz, O., & Renaud, F. 2020, MNRAS, 494, 3328, doi: 10.1093/mnras/staa889
-
[3]
P., Agertz, O., Renaud, F., & Teyssier, R
Andersson, E. P., Agertz, O., Renaud, F., & Teyssier, R. 2023, MNRAS, 521, 2196, doi: 10.1093/mnras/stad692
-
[4]
P., Mac Low, M.-M., Agertz, O., Renaud, F., & Li, H
Andersson, E. P., Mac Low, M.-M., Agertz, O., Renaud, F., & Li, H. 2024, A&A, 681, A28, doi: 10.1051/0004-6361/202347792
-
[5]
Andersson, E. P., Rey, M. P., Pontzen, A., et al. 2025, ApJ, 978, 129, doi: 10.3847/1538-4357/ad99d6
-
[6]
Applebaum, E., Brooks, A. M., Quinn, T. R., & Christensen, C. R. 2020, MNRAS, 492, 8, doi: 10.1093/mnras/stz3331
-
[7]
1987, Galactic dynamics
Binney, J., & Tremaine, S. 1987, Galactic dynamics
1987
-
[8]
Cameron, A. J., Katz, H., Witten, C., et al. 2024, MNRAS, 534, 523, doi: 10.1093/mnras/stae1547 Ch´avez, R., Gonz´alez-L´opezlira, R. A., & Bruzual, G. 2025, MNRAS, 538, 2989, doi: 10.1093/mnras/staf413
-
[9]
2024, A&A, 691, A231, doi: 10.1051/0004-6361/202450699
Deng, Y ., Li, H., Liu, B., et al. 2024, A&A, 691, A231, doi: 10.1051/0004-6361/202450699
-
[10]
2025, A&A, 704, A240, doi: 10.1051/0004-6361/202556854
Deng, Y ., Li, H., Marinacci, F., et al. 2025, A&A, 704, A240, doi: 10.1051/0004-6361/202556854
-
[11]
Deshmukh, S., Linden, S. T., Calzetti, D., et al. 2024, ApJL, 974, L24, doi: 10.3847/2041-8213/ad7ba9
-
[12]
2020, MNRAS, 499, 748, doi: 10.1093/mnras/staa2560
Dinnbier, F., & Walch, S. 2020, MNRAS, 499, 748, doi: 10.1093/mnras/staa2560
-
[13]
Eldridge, J. J., Langer, N., & Tout, C. A. 2011, MNRAS, 414, 3501, doi: 10.1111/j.1365-2966.2011.18650.x
-
[14]
Eldridge, J. J., Stanway, E. R., Xiao, L., et al. 2017, PASA, 34, e058, doi: 10.1017/pasa.2017.51
work page internal anchor Pith review doi:10.1017/pasa.2017.51 2017
-
[15]
Elmegreen, B. G. 2000, ApJ, 539, 342, doi: 10.1086/309204
-
[16]
Fujii, M. S., & Portegies Zwart, S. 2015, MNRAS, 449, 726, doi: 10.1093/mnras/stv293
-
[17]
Fujii, M. S., Saitoh, T. R., Wang, L., & Hirai, Y . 2021, PASJ, 73, 1057, doi: 10.1093/pasj/psab037
-
[18]
Fumagalli, M., da Silva, R. L., & Krumholz, M. R. 2011, ApJL, 741, L26, doi: 10.1088/2041-8205/741/2/L26
-
[19]
2026a, arXiv e-prints, arXiv:2601.20998, doi: 10.48550/arXiv.2601.20998
Gjergo, E., Zhang, Z., & Kroupa, P. 2026a, arXiv e-prints, arXiv:2601.20998, doi: 10.48550/arXiv.2601.20998
-
[20]
2026b, Research in Astronomy and Astrophysics, 26, 025003, doi: 10.1088/1674-4527/ae1f79 Grudi´c, M
Gjergo, E., Zhang, Z.-Y ., Kroupa, P., et al. 2026b, Research in Astronomy and Astrophysics, 26, 025003, doi: 10.1088/1674-4527/ae1f79 Grudi´c, M. Y ., Guszejnov, D., Hopkins, P. F., Offner, S. S. R., &
-
[21]
Faucher-Gigu`ere, C.-A. 2021, MNRAS, 506, 2199, doi: 10.1093/mnras/stab1347 Grudi´c, M. Y ., Hopkins, P. F., Faucher-Gigu`ere, C.-A., et al. 2018, MNRAS, 475, 3511, doi: 10.1093/mnras/sty035
-
[22]
Grudic, M. Y ., Offner, S. S. R., Guszejnov, D., Faucher-Gigu`ere, C.-A., & Hopkins, P. F. 2023, The Open Journal of Astrophysics, 6, 48, doi: 10.21105/astro.2307.00052
-
[23]
Y ., & Guszejnov, D
Grudi, M. Y ., & Guszejnov, D. 2021, MakeCloud, 1.0 https://github.com/mikegrudic/MakeCloud
2021
-
[24]
2024, ApJ, 970, 136, doi: 10.3847/1538-4357/ad4da2
Guo, Z., Zhang, Z.-Y ., Yan, Z., et al. 2024, ApJ, 970, 136, doi: 10.3847/1538-4357/ad4da2
-
[25]
P., Hu, C.-Y ., & Sternberg, A
Gurman, A., Steinwandel, U. P., Hu, C.-Y ., & Sternberg, A. 2025, ApJ, 984, 142, doi: 10.3847/1538-4357/adc814
-
[26]
2021, MNRAS, 502, 3646, doi: 10.1093/mnras/stab278
Faucher-Gigu`ere, C.-A. 2021, MNRAS, 502, 3646, doi: 10.1093/mnras/stab278
-
[27]
Guszejnov, D., Markey, C., Offner, S. S. R., et al. 2022, MNRAS, 515, 167, doi: 10.1093/mnras/stac1737
-
[28]
A., Pakmor, R., Naab, T., & Springel, V
Gutcke, T. A., Pakmor, R., Naab, T., & Springel, V . 2021, MNRAS, 501, 5597, doi: 10.1093/mnras/staa3875
-
[29]
Gutcke, T. A., Pfrommer, C., Bryan, G. L., et al. 2022, ApJ, 941, 120, doi: 10.3847/1538-4357/aca1b4
-
[30]
Hirai, Y ., Fujii, M. S., & Saitoh, T. R. 2021, PASJ, 73, 1036, doi: 10.1093/pasj/psab038
-
[31]
Hislop, J. M., Naab, T., Steinwandel, U. P., et al. 2022, MNRAS, 509, 5938, doi: 10.1093/mnras/stab3347 20
-
[32]
F., Narayanan, D., & Murray, N
Hopkins, P. F., Narayanan, D., & Murray, N. 2013, MNRAS, 432, 2647, doi: 10.1093/mnras/stt723
-
[33]
F., Wetzel, A., Kereˇs, D., et al
Hopkins, P. F., Wetzel, A., Kereˇs, D., et al. 2018, MNRAS, 480, 800, doi: 10.1093/mnras/sty1690
work page internal anchor Pith review doi:10.1093/mnras/sty1690 2018
-
[34]
Hu, C.-Y ., Naab, T., Glover, S. C. O., Walch, S., & Clark, P. C. 2017, MNRAS, 471, 2151, doi: 10.1093/mnras/stx1773
-
[35]
2026, MNRAS, 545, staf2158, doi: 10.1093/mnras/staf2158
Jeon, M., & Go, M. 2026, MNRAS, 545, staf2158, doi: 10.1093/mnras/staf2158
-
[36]
Jeon, M., & Ko, M. 2024, arXiv e-prints, arXiv:2411.17862, doi: 10.48550/arXiv.2411.17862
work page internal anchor Pith review Pith/arXiv arXiv doi:10.48550/arxiv.2411.17862 2024
-
[37]
Jo, Y ., Kim, S., Kim, J.-h., & Bryan, G. L. 2024, ApJ, 974, 193, doi: 10.3847/1538-4357/ad6b16
-
[38]
2019, MNRAS, 485, 117, doi: 10.1093/mnras/stz287
Kannan, R., V ogelsberger, M., Marinacci, F., et al. 2019, MNRAS, 485, 117, doi: 10.1093/mnras/stz287
-
[39]
Kennicutt, R. C., & Evans, N. J. 2012, ARA&A, 50, 531, doi: 10.1146/annurev-astro-081811-125610
work page internal anchor Pith review doi:10.1146/annurev-astro-081811-125610 2012
-
[40]
Kennicutt, Jr., R. C. 1998, ARA&A, 36, 189, doi: 10.1146/annurev.astro.36.1.189
work page internal anchor Pith review doi:10.1146/annurev.astro.36.1.189 1998
-
[41]
Kim, J.-G., Ostriker, E. C., & Filippova, N. 2021, ApJ, 911, 128, doi: 10.3847/1538-4357/abe934
-
[42]
Kim, J.-h., Krumholz, M. R., Wise, J. H., et al. 2013, ApJ, 779, 8, doi: 10.1088/0004-637X/779/1/8
-
[43]
Kirk, H., & Myers, P. C. 2011, ApJ, 727, 64, doi: 10.1088/0004-637X/727/2/64
-
[44]
Kroupa, P. 2001, MNRAS, 322, 231, doi: 10.1046/j.1365-8711.2001.04022.x
-
[45]
2002, Science, 295, 82, doi: 10.1126/science.1067524
Kroupa, P. 2002, Science, 295, 82, doi: 10.1126/science.1067524
-
[46]
2003, ApJ, 598, 1076, doi: 10.1086/379105
Kroupa, P., & Weidner, C. 2003, ApJ, 598, 1076, doi: 10.1086/379105
-
[47]
2013, in
Kroupa, P., Weidner, C., Pflamm-Altenburg, J., et al. 2013, in
2013
-
[48]
V olume 5: Galactic Structure and Stellar Populations, ed
Planets, Stars and Stellar Systems. V olume 5: Galactic Structure and Stellar Populations, ed. T. D. Oswalt & G. Gilmore, V ol. 5, 115, doi: 10.1007/978-94-007-5612-0 4
-
[49]
Krumholz, M. R., McKee, C. F., & Bland-Hawthorn, J. 2019, ARA&A, 57, 227, doi: 10.1146/annurev-astro-091918-104430
-
[50]
2020, MNRAS, 495, 3276, doi: 10.1093/mnras/staa585 Lah´en, N., Naab, T., Johansson, P
Lacchin, E., Matteucci, F., Vincenzo, F., & Palla, M. 2020, MNRAS, 495, 3276, doi: 10.1093/mnras/staa585 Lah´en, N., Naab, T., Johansson, P. H., et al. 2020, ApJ, 891, 2, doi: 10.3847/1538-4357/ab7190 Lah´en, N., Naab, T., & Kauffmann, G. 2022, MNRAS, 514, 4560, doi: 10.1093/mnras/stac1594 Lah´en, N., Rantala, A., Naab, T., et al. 2025a, MNRAS, 538, 2129,...
-
[51]
Lane, H. B., Grudi´c, M. Y ., Guszejnov, D., et al. 2022, MNRAS, 510, 4767, doi: 10.1093/mnras/stab3739
-
[52]
Larson, R. B. 2003, in Astronomical Society of the Pacific Conference Series, V ol. 287, Galactic Star Formation Across the Stellar Mass Spectrum, ed. J. M. De Buizer & N. S. van der Bliek, 65–80, doi: 10.48550/arXiv.astro-ph/0205466
work page internal anchor Pith review Pith/arXiv arXiv doi:10.48550/arxiv.astro-ph/0205466 2003
-
[53]
C., Gil de Paz, A., Tremonti, C., et al
Lee, J. C., Gil de Paz, A., Tremonti, C., et al. 2009, ApJ, 706, 599, doi: 10.1088/0004-637X/706/1/599
-
[54]
Li, H., V ogelsberger, M., Marinacci, F., & Gnedin, O. Y . 2019, MNRAS, 487, 364, doi: 10.1093/mnras/stz1271
-
[55]
2019, MNRAS, 489, 4233, doi: 10.1093/mnras/stz2391
Springel, V . 2019, MNRAS, 489, 4233, doi: 10.1093/mnras/stz2391
-
[56]
Marks, M., Kroupa, P., Dabringhausen, J., & Pawlowski, M. S. 2012, MNRAS, 422, 2246, doi: 10.1111/j.1365-2966.2012.20767.x
-
[57]
2013, ApJ, 778, 149, doi: 10.1088/0004-637X/778/2/149
McWilliam, A., Wallerstein, G., & Mottini, M. 2013, ApJ, 778, 149, doi: 10.1088/0004-637X/778/2/149
-
[58]
2021, Nature Astronomy, 5, 1247, doi: 10.1038/s41550-021-01493-y
Mucciarelli, A., Massari, D., Minelli, A., et al. 2021, Nature Astronomy, 5, 1247, doi: 10.1038/s41550-021-01493-y
-
[59]
Naab, T., & Ostriker, J. P. 2017, ARA&A, 55, 59, doi: 10.1146/annurev-astro-081913-040019
-
[60]
2016, A&A, 590, A107, doi: 10.1051/0004-6361/201628233
Oh, S., & Kroupa, P. 2016, A&A, 590, A107, doi: 10.1051/0004-6361/201628233
-
[61]
2013, MNRAS, 432, 176, doi: 10.1093/mnras/stt428
Pakmor, R., & Springel, V . 2013, MNRAS, 432, 176, doi: 10.1093/mnras/stt428
-
[62]
2016, MNRAS, 455, 1134, doi: 10.1093/mnras/stv2380
Pakmor, R., Springel, V ., Bauer, A., et al. 2016, MNRAS, 455, 1134, doi: 10.1093/mnras/stv2380
-
[63]
M., 2011, @doi [ ] 10.1111/j.1365-2966.2010.17821.x , 411, 1917
Pflamm-Altenburg, J., & Kroupa, P. 2010, MNRAS, 404, 1564, doi: 10.1111/j.1365-2966.2010.16376.x
-
[64]
Polak, B., Mac Low, M.-M., Klessen, R. S., et al. 2024, A&A, 690, A94, doi: 10.1051/0004-6361/202348840
-
[65]
Rautio, R. P. V ., Watkins, A. E., Salo, H., et al. 2024, A&A, 681, A76, doi: 10.1051/0004-6361/202347729
-
[66]
2015, MNRAS, 446, 4220, doi: 10.1093/mnras/stu2427
Romano, D., Bellazzini, M., Starkenburg, E., & Leaman, R. 2015, MNRAS, 446, 4220, doi: 10.1093/mnras/stu2427
-
[67]
Salpeter, E. E. 1955, ApJ, 121, 161, doi: 10.1086/145971
-
[68]
Schinnerer, E., & Leroy, A. K. 2024, ARA&A, 62, 369, doi: 10.1146/annurev-astro-071221-052651
-
[69]
2015, A&A, 582, A93, doi: 10.1051/0004-6361/201425296
Schulz, C., Pflamm-Altenburg, J., & Kroupa, P. 2015, A&A, 582, A93, doi: 10.1051/0004-6361/201425296
-
[70]
Smith, J. D., Jaffa, S. E., & Krause, M. G. H. 2023, MNRAS, 525, 6182, doi: 10.1093/mnras/stad2689
-
[71]
Smith, M. C. 2021, MNRAS, 502, 5417, doi: 10.1093/mnras/stab291
-
[72]
Smith, M. C. 2026, arXiv e-prints, arXiv:2604.00100, doi: 10.48550/arXiv.2604.00100
work page internal anchor Pith review Pith/arXiv arXiv doi:10.48550/arxiv.2604.00100 2026
-
[73]
Sormani, M. C., Treß, R. G., Klessen, R. S., & Glover, S. C. O. 2017, MNRAS, 466, 407, doi: 10.1093/mnras/stw3205
-
[74]
doi:10.1111/j.1365-2966.2009.15868.x , eprint =
Springel, V . 2010, MNRAS, 401, 791, doi: 10.1111/j.1365-2966.2009.15715.x 21
-
[75]
Springel, V ., White, S. D. M., Tormen, G., & Kauffmann, G. 2001, MNRAS, 328, 726, doi: 10.1046/j.1365-8711.2001.04912.x
-
[76]
Stephens, I. W., Gouliermis, D., Looney, L. W., et al. 2017, ApJ, 834, 94, doi: 10.3847/1538-4357/834/1/94
-
[77]
2023, MNRAS, 526, 1713, doi: 10.1093/mnras/stad2787
Steyrleithner, P., & Hensler, G. 2023, MNRAS, 526, 1713, doi: 10.1093/mnras/stad2787
-
[78]
Su, K.-Y ., Hopkins, P. F., Hayward, C. C., et al. 2018, MNRAS, 480, 1666, doi: 10.1093/mnras/sty1928
-
[79]
2020, MNRAS, 493, 3398, doi: 10.1093/mnras/staa480
Wang, L., Nitadori, K., & Makino, J. 2020, MNRAS, 493, 3398, doi: 10.1093/mnras/staa480
-
[80]
Watts, A. B., Meurer, G. R., Lagos, C. D. P., et al. 2018, MNRAS, 477, 5554, doi: 10.1093/mnras/sty1006
discussion (0)
Sign in with ORCID, Apple, or X to comment. Anyone can read and Pith papers without signing in.