Evaluating the Sensitivity of the Age Inferences of Red Giant Stars to Machine Learning Methodology
Pith reviewed 2026-06-25 22:42 UTC · model grok-4.3
The pith
Ages for red giant stars inferred by machine learning stay mostly stable when model architecture or hyperparameters change, but shift when the training set changes.
A machine-rendered reading of the paper's core claim, the machinery that carries it, and where it could break.
Core claim
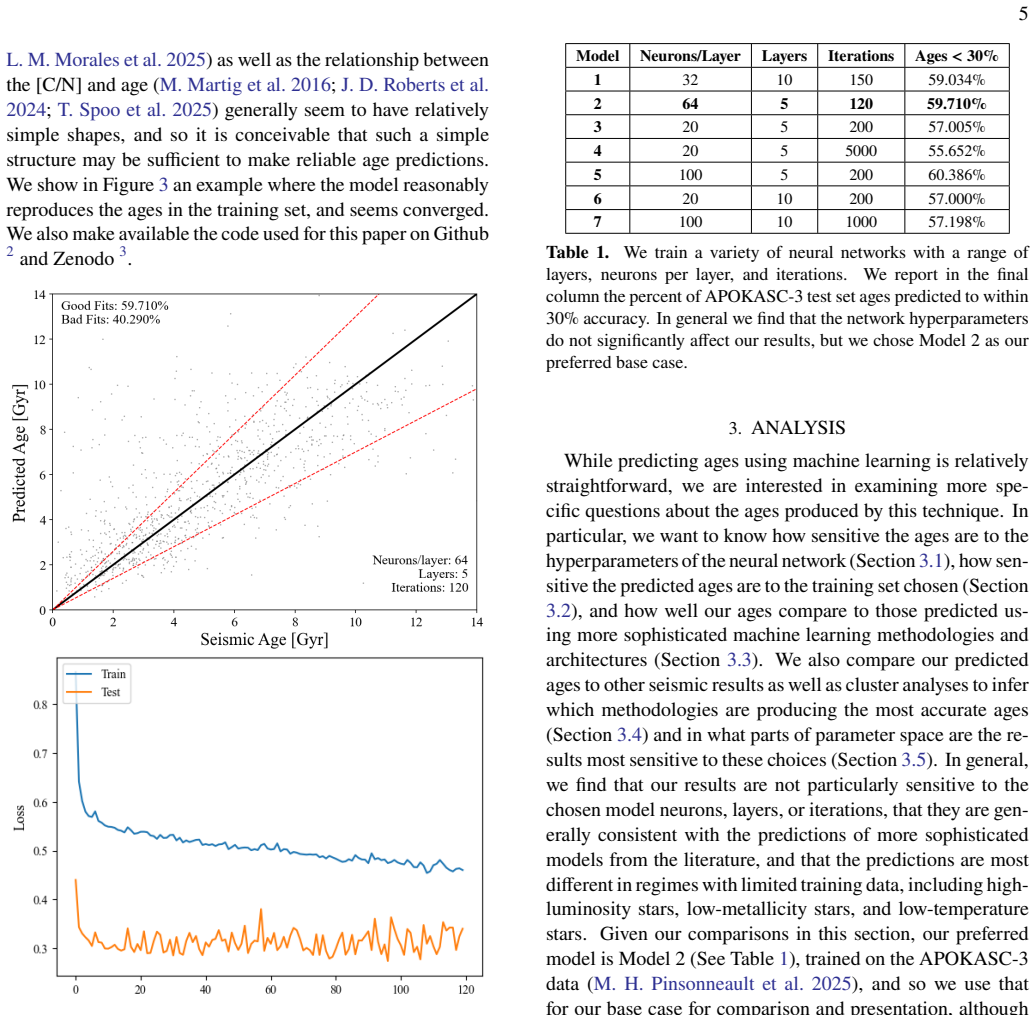
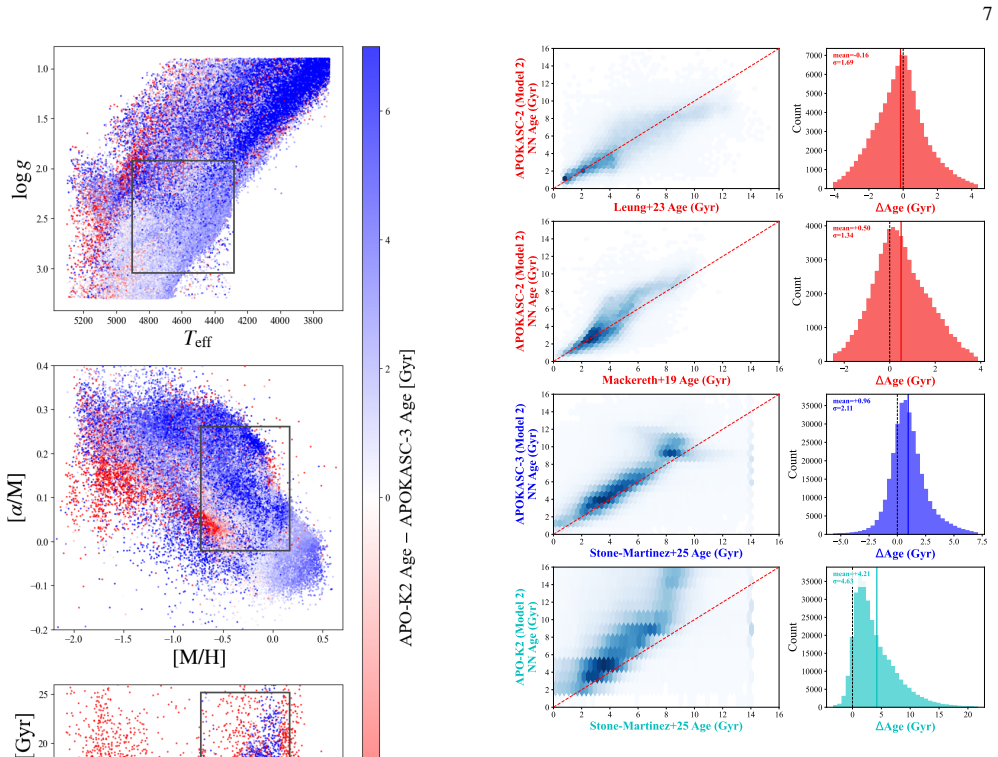
The resulting ages are generally insensitive to the neural network hyperparameters or the machine learning architecture, but are somewhat sensitive to the training set chosen. Ages for the oldest, coolest, and lowest metallicity stars in the sample are most sensitive to the methodology used and the training set chosen.
What carries the argument
Sensitivity tests that vary neural-network hyperparameters, model architecture, and training-set selection on Milky Way Mapper Data Release 19 stars with known ages.
If this is right
- Even simple neural-network models are sufficient for accurate age inference from spectroscopic data.
- Expanding the size and diversity of available training sets will be the main route to reliable ages for the full galactic population.
- Catalogs of ages for the oldest, coolest, and lowest-metallicity stars should carry extra uncertainty flags tied to training-set choice.
Where Pith is reading between the lines
- If label quality varies across training sets, then part of the reported sensitivity may actually trace back to label errors rather than model choices.
- Age maps of the Milky Way could be made more robust by reporting an ensemble of ages drawn from multiple training sets instead of a single value.
- Future work might test whether weighting training stars by temperature or metallicity reduces the sensitivity observed in the oldest objects.
Load-bearing premise
Changes seen when swapping training sets are assumed to measure methodological sensitivity rather than differences in the quality or biases of the known-age labels themselves.
What would settle it
Retraining the same models on an independent catalog of stars whose ages were measured by a completely different method (for example, asteroseismology) and checking whether the oldest stars still show large age shifts would test the claim.
Figures


read the original abstract
Stellar ages are vital for understanding the formation of our galaxy, but they are among the most challenging parameters to measure. Many authors address this by using machine learning models trained on stars of known age. Here we used data for 351,995 stars from Milky Way Mapper Data Release 19 to explore the sensitivity of the inferred ages to 1) neural network hyperparameters, 2) machine learning architecture, and 3) training set. We find that the resulting ages are generally insensitive to the neural network hyperparameters or the machine learning architecture, but are somewhat sensitive to the training set chosen. We also find that ages for the oldest, coolest, and lowest metallicity stars in the sample are most sensitive to the methodology used and the training set chosen. In general, our analysis suggests that even simple neural network models are sufficient for accurate age inference, but future work expanding the available training sets will be an important component of predicting reliable ages for the full galactic population.
Editorial analysis
A structured set of objections, weighed in public.
Referee Report
Summary. The manuscript reports an empirical sensitivity analysis of machine-learning-based age inferences for 351,995 red giant stars from Milky Way Mapper DR19. The central claims are that the resulting ages are generally insensitive to neural-network hyperparameters and architecture choices, but are somewhat sensitive to the training set selected, with the oldest, coolest, and lowest-metallicity stars showing the largest variations; the authors conclude that even simple networks suffice and that expanding training sets is the priority for reliable galactic ages.
Significance. If the results are robust, the work provides a practical benchmark showing that model architecture is not the dominant uncertainty source in ML age inference, directing community effort toward training-set expansion and label quality. This has direct implications for large-scale galactic archaeology catalogs that rely on such ages.
major comments (1)
- [Abstract; training-set experiments section] Abstract and the section describing the training-set experiments: the headline claim that ages are 'somewhat sensitive to the training set chosen' (while insensitive to hyperparameters/architecture) is load-bearing for the interpretation that this sensitivity is a methodological property. The analysis assumes that differences across training sets primarily reflect statistical coverage or selection rather than systematic differences in the accuracy, bias, or selection function of the 'known ages' used as regression targets. Without explicit cross-set label-consistency checks (e.g., direct comparison of label distributions, metallicity-dependent offsets, or propagated uncertainties), the observed sensitivity cannot be unambiguously attributed to the ML pipeline rather than inconsistent supervision.
Simulated Author's Rebuttal
We thank the referee for their constructive and detailed review. The major comment identifies a potential ambiguity in attributing training-set sensitivity to the ML pipeline. We address this point directly below and will incorporate clarifications and additional checks in the revised manuscript.
read point-by-point responses
-
Referee: [Abstract; training-set experiments section] Abstract and the section describing the training-set experiments: the headline claim that ages are 'somewhat sensitive to the training set chosen' (while insensitive to hyperparameters/architecture) is load-bearing for the interpretation that this sensitivity is a methodological property. The analysis assumes that differences across training sets primarily reflect statistical coverage or selection rather than systematic differences in the accuracy, bias, or selection function of the 'known ages' used as regression targets. Without explicit cross-set label-consistency checks (e.g., direct comparison of label distributions, metallicity-dependent offsets, or propagated uncertainties), the observed sensitivity cannot be unambiguously attributed to the ML pipeline rather than inconsistent supervision.
Authors: We appreciate the referee's emphasis on unambiguous attribution. All training sets were constructed as subsets or selection variants drawn from the identical parent catalog of 351,995 MWM DR19 red giants whose ages were determined by the same underlying method; the labels are therefore drawn from a single, internally consistent source. Observed differences thus arise from variations in statistical coverage, parameter-space sampling, and selection functions rather than from label systematics between independent sources. That said, we agree that explicit verification strengthens the claim. In the revision we will add (i) direct comparisons of the age, [Fe/H], and Teff distributions across the training sets and (ii) checks for metallicity-dependent offsets between the label values themselves. These additions will be placed in the training-set experiments section and referenced in the abstract. We note that full propagation of label uncertainties would require additional external data not available in the current catalog; we will instead discuss this as a limitation and a target for future work. revision: yes
Circularity Check
Empirical sensitivity study contains no derivation chain or self-referential steps
full rationale
The paper performs an empirical comparison of neural network age inferences across hyperparameter choices, architectures, and training sets on a fixed dataset of 351995 stars. No equations, first-principles derivations, fitted parameters renamed as predictions, or uniqueness theorems appear in the provided text. All reported sensitivities are direct observational outcomes of retraining and evaluating models; none reduce by construction to the inputs via self-definition or self-citation. The central claim (ages somewhat sensitive to training set) is a measured difference between runs and does not invoke any load-bearing self-citation or ansatz. This is a standard empirical ablation study whose results stand or fall on the data and code rather than on any circular logical step.
Axiom & Free-Parameter Ledger
axioms (1)
- domain assumption Machine learning models trained on stars with known ages can produce usable age inferences for other stars
Reference graph
Works this paper leans on
-
[1]
Abadi, M., Agarwal, A., Barham, P., et al. 2015, https://www.tensorflow.org/ Abdurro’uf, Accetta, K., Aerts, C., et al. 2022, ApJS, 259, 35, doi: 10.3847/1538-4365/ac4414
-
[2]
Abolfathi, B., Aguado, D. S., Aguilar, G., et al. 2018, ApJS, 235, 42, doi: 10.3847/1538-4365/aa9e8a
-
[3]
Agarap, A. F. 2018, arXiv e-prints, arXiv:1803.08375, doi: 10.48550/arXiv.1803.08375
work page internal anchor Pith review Pith/arXiv arXiv doi:10.48550/arxiv.1803.08375 2018
-
[4]
Almeida, A., Anderson, S. F., Argudo-Fern´andez, M., et al. 2023, ApJS, 267, 44, doi: 10.3847/1538-4365/acda98
-
[5]
2023, A&A, 678, A158, doi: 10.1051/0004-6361/202346666
Anders, F., Gispert, P., Ratcliffe, B., et al. 2023, A&A, 678, A158, doi: 10.1051/0004-6361/202346666
-
[6]
2023, The Astrophysical Journal Supplement Series, 267, 8, doi: 10.3847/1538-4365/acd53e
Andrae, R., Rix, H.-W., & Chandra, V. 2023, The Astrophysical Journal Supplement Series, 267, 8, doi: 10.3847/1538-4365/acd53e
-
[7]
Andrews, B. H., Weinberg, D. H., Sch¨onrich, R., & Johnson, J. A. 2017, ApJ, 835, 224, doi: 10.3847/1538-4357/835/2/224 Astropy Collaboration. 2013, Astronomy & Astrophysics, 558, A33, doi: 10.1051/0004-6361/201322068 Astropy Collaboration. 2018, The Astronomical Journal, 156, 123, doi: 10.3847/1538-3881/aabc4f Astropy Collaboration, Price-Whelan, A. M., ...
-
[8]
2020, AJ, 160, 18, doi: 10.3847/1538-3881/ab91bf
Auge, C., Huber, D., Heinze, A., et al. 2020, AJ, 160, 18, doi: 10.3847/1538-3881/ab91bf
-
[9]
Barnes, S. A. 2007, ApJ, 669, 1167, doi: 10.1086/519295
-
[10]
2018, ARA&A, 56, 83, doi: 10.1146/annurev-astro-081817-051839
Bastian, N., & Lardo, C. 2018, ARA&A, 56, 83, doi: 10.1146/annurev-astro-081817-051839
-
[11]
Beaton, R. L., Werner, S., Mitschang, A. W., et al. 2022, Research Notes of the American Astronomical Society, 6, 125, doi: 10.3847/2515-5172/ac7808
-
[12]
C., Kazantzidis, S., Weinberg, D
Bird, J. C., Kazantzidis, S., Weinberg, D. H., et al. 2013, ApJ, 773, 43, doi: 10.1088/0004-637X/773/1/43 15
-
[13]
2026, A&A, 708, A215, doi: 10.1051/0004-6361/202558436
Boin, T., Casamiquela, L., Haywood, M., et al. 2026, A&A, 708, A215, doi: 10.1051/0004-6361/202558436
-
[14]
Bowen, I. S., & Vaughan, A. H., J. 1973, ApOpt, 12, 1430, doi: 10.1364/AO.12.001430
-
[15]
Bressan, A., Marigo, P., Girardi, L., et al. 2012, MNRAS, 427, 127, doi: 10.1111/j.1365-2966.2012.21948.x
-
[16]
2021, Monthly Notices of the Royal Astronomical Society, 506, 150, doi: 10.1093/mnras/stab1242
Buder, S., Sharma, S., Kos, J., et al. 2021, Monthly Notices of the Royal Astronomical Society, 506, 150, doi: 10.1093/mnras/stab1242
-
[17]
Buder, S., Kos, J., Wang, X. E., et al. 2025, PASA, 42, e051, doi: 10.1017/pasa.2025.26
-
[18]
Bufanda, E., Tayar, J., Huber, D., Hasselquist, S., & Lane, R. R. 2023, ApJ, 959, 123, doi: 10.3847/1538-4357/acf9a5
-
[19]
2020, A&A, 640, A1, doi: 10.1051/0004-6361/202038192
Cantat-Gaudin, T., Anders, F., Castro-Ginard, A., et al. 2020, A&A, 640, A1, doi: 10.1051/0004-6361/202038192
-
[20]
2021, A&A, 654, A151, doi: 10.1051/0004-6361/202141779
Casamiquela, L., Castro-Ginard, A., Anders, F., & Soubiran, C. 2021, A&A, 654, A151, doi: 10.1051/0004-6361/202141779
-
[21]
2001, ApJ, 554, 1044, doi: 10.1086/321427
Chiappini, C., Matteucci, F., & Romano, D. 2001, ApJ, 554, 1044, doi: 10.1086/321427
-
[22]
MESA Isochrones and Stellar Tracks (MIST). I: Solar-Scaled Models
Choi, J., Dotter, A., Conroy, C., et al. 2016, ApJ, 823, 102, doi: 10.3847/0004-637X/823/2/102
work page internal anchor Pith review doi:10.3847/0004-637x/823/2/102 2016
-
[23]
2018, ApJ, 860, 131, doi: 10.3847/1538-4357/aac435 Ciuc˘a, I., Kawata, D., Ting, Y.-S., et al
Choi, J., Dotter, A., Conroy, C., & Ting, Y.-S. 2018, ApJ, 860, 131, doi: 10.3847/1538-4357/aac435 Ciuc˘a, I., Kawata, D., Ting, Y.-S., et al. 2024, MNRAS, 528, L122, doi: 10.1093/mnrasl/slad033
-
[24]
Cohen, J. G. 1978, ApJ, 223, 487, doi: 10.1086/156284
-
[25]
2012, ApJ, 757, 190, doi: 10.1088/0004-637X/757/2/190
Corsaro, E., Stello, D., Huber, D., et al. 2012, ApJ, 757, 190, doi: 10.1088/0004-637X/757/2/190
-
[26]
Research in Astronomy and Astrophysics , year = 2012, month = sep, volume =
Cui, X.-Q., Zhao, Y.-H., Chu, Y.-Q., et al. 2012, Research in Astronomy and Astrophysics, 12, 1197, doi: 10.1088/1674-4527/12/9/003
-
[27]
Curtis, J. L., Ag¨ ueros, M. A., Matt, S. P., et al. 2020, ApJ, 904, 140, doi: 10.3847/1538-4357/abbf58
-
[28]
M., Badenes, C., Tayar, J., et al
Daher, C. M., Badenes, C., Tayar, J., et al. 2022, MNRAS, 512, 2051, doi: 10.1093/mnras/stac590 de Jong, R. S., Agertz, O., Berbel, A. A., et al. 2019, The Messenger, 175, 3, doi: 10.18727/0722-6691/5117
-
[29]
El-Badry, K., Rix, H.-W., & Heintz, T. M. 2021, MNRAS, 506, 2269, doi: 10.1093/mnras/stab323
-
[30]
Elsworth, Y., Hekker, S., Johnson, J. A., et al. 2019, MNRAS, 489, 4641, doi: 10.1093/mnras/stz2356
-
[31]
K., Feltzing, S., Sahlholdt, C., & Casagrande, L
Feuillet, D. K., Feltzing, S., Sahlholdt, C., & Casagrande, L. 2020, arXiv e-prints, arXiv:2003.11039. https://arxiv.org/abs/2003.11039
arXiv 2020
-
[32]
Frazer, P., Griffith, E. J., Hogg, D. W., Sinha, A., & Tayar, J. 2025, arXiv e-prints, arXiv:2510.26927, doi: 10.48550/arXiv.2510.26927
-
[33]
2002, ARA&A, 40, 487, doi: 10.1146/annurev.astro.40.060401.093840
Freeman, K., & Bland-Hawthorn, J. 2002, ARA&A, 40, 487, doi: 10.1146/annurev.astro.40.060401.093840
-
[34]
Frinchaboy, P. M., Thompson, B., Jackson, K. M., et al. 2013, ApJL, 777, L1, doi: 10.1088/2041-8205/777/1/L1 Gaia Collaboration, Brown, A. G. A., Vallenari, A., et al. 2018, A&A, 616, A1, doi: 10.1051/0004-6361/201833051 Gaia Collaboration, Vallenari, A., Brown, A. G. A., et al. 2023, A&A, 674, A1, doi: 10.1051/0004-6361/202243940 Garc´ıa P´erez, A. E., A...
-
[35]
Garraffo, C., Protopapas, P., Drake, J. J., Becker, I., & Cargile, P. 2021, arXiv e-prints, arXiv:2106.07655. https://arxiv.org/abs/2106.07655
arXiv 2021
-
[36]
Girardi, L. 1999, MNRAS, 308, 818, doi: 10.1046/j.1365-8711.1999.02746.x
- [37]
-
[38]
G., Sneden, C., Carretta, E., & Bragaglia, A
Gratton, R. G., Sneden, C., Carretta, E., & Bragaglia, A. 2000, A&A, 354, 169
2000
-
[39]
Griffith, E., Weinberg, D. H., Johnson, J. A., et al. 2021, ApJ, 909, 77, doi: 10.3847/1538-4357/abd6be
-
[40]
2006, Mem
Grundahl, F., Kjeldsen, H., Frandsen, S., et al. 2006, Mem. Soc. Astron. Italiana, 77, 458
2006
-
[41]
Gunn, J. E., Siegmund, W. A., Mannery, E. J., et al. 2006, AJ, 131, 2332, doi: 10.1086/500975
-
[42]
Hasselquist, S., Holtzman, J. A., Shetrone, M., et al. 2019, ApJ, 871, 181, doi: 10.3847/1538-4357/aaf859
-
[43]
Hayden, M. R., Bovy, J., Holtzman, J. A., et al. 2015, ApJ, 808, 132, doi: 10.1088/0004-637X/808/2/132
-
[44]
R., Sharma, S., Bland-Hawthorn, J., et al
Hayden, M. R., Sharma, S., Bland-Hawthorn, J., et al. 2022, MNRAS, 517, 5325, doi: 10.1093/mnras/stac2787
-
[45]
Helmi, A., Babusiaux, C., Koppelman, H. H., et al. 2018, Nature, 563, 85, doi: 10.1038/s41586-018-0625-x
-
[46]
2025, ApJS, 280, 14, doi: 10.3847/1538-4365/ade2e9
Hey, D., Tonry, J., Shappee, B., & Huber, D. 2025, ApJS, 280, 14, doi: 10.3847/1538-4365/ade2e9
-
[47]
Hey, D. R., Huber, D., Shappee, B. J., et al. 2023, AJ, 166, 249, doi: 10.3847/1538-3881/ad01bf
-
[48]
2024, ApJ, 973, 154, doi: 10.3847/1538-4357/ad6320
Hon, M., Li, Y., & Ong, J. 2024, ApJ, 973, 154, doi: 10.3847/1538-4357/ad6320
-
[49]
Hon, M., Huber, D., Kuszlewicz, J. S., et al. 2021, ApJ, 919, 131, doi: 10.3847/1538-4357/ac14b1
-
[50]
Horta, D., & Schiavon, R. P. 2024, Ap&SS, 369, 107, doi: 10.1007/s10509-024-04370-y
-
[51]
W., Kalup, C., Stello, D., & De Silva, G
Howell, M., Campbell, S. W., Kalup, C., Stello, D., & De Silva, G. M. 2025, MNRAS, 536, 1389, doi: 10.1093/mnras/stae2686
-
[52]
Howell, M., Campbell, S. W., Stello, D., & De Silva, G. M. 2022, MNRAS, 515, 3184, doi: 10.1093/mnras/stac1918
-
[53]
Howell, M., Campbell, S. W., Stello, D., & De Silva, G. M. 2024, MNRAS, 527, 7974, doi: 10.1093/mnras/stad3565
-
[54]
TESS Asteroseismology of Red Giants in the Old Metal-Rich Open Clusters NGC 188 & NGC 6791
Howell, M., Johnson, J. A., Pinsonneault, M. H., et al. 2026, arXiv e-prints, arXiv:2604.27828, doi: 10.48550/arXiv.2604.27828 16
work page internal anchor Pith review Pith/arXiv arXiv doi:10.48550/arxiv.2604.27828 2026
-
[55]
Hunt, E. L., & Reffert, S. 2023, Astronomy & Astrophysics, 673, A114, doi: 10.1051/0004-6361/202346285
-
[56]
Hunter, J. D. 2007, Computing in Science and Engineering, 9, 90, doi: 10.1109/MCSE.2007.55
-
[57]
Jin, S., Trager, S. C., Dalton, G. B., et al. 2024, MNRAS, 530, 2688, doi: 10.1093/mnras/stad557
-
[58]
Johnson, J. W., Weinberg, D. H., Vincenzo, F., et al. 2021, MNRAS, 508, 4484, doi: 10.1093/mnras/stab2718
-
[59]
Johnson, J. W., Weinberg, D. H., Blanc, G. A., et al. 2025, ApJ, 988, 8, doi: 10.3847/1538-4357/addbe5
-
[60]
2018, ApJ, 864, 99, doi: 10.3847/1538-4357/aad464
Joyce, M., & Chaboyer, B. 2018, ApJ, 864, 99, doi: 10.3847/1538-4357/aad464
-
[61]
Joyce, M., Johnson, C. I., Marchetti, T., et al. 2023, ApJ, 946, 28, doi: 10.3847/1538-4357/acb692
- [62]
-
[63]
N., Guhathakurta, P., Zhang, A
Kirby, E. N., Guhathakurta, P., Zhang, A. J., et al. 2016, ApJ, 819, 135, doi: 10.3847/0004-637X/819/2/135
-
[64]
Kjeldsen, H., & Bedding, T. R. 1995, A&A, 293, 87
1995
-
[65]
A., Rix, H.-W., Aerts, C., et al
Kollmeier, J. A., Rix, H.-W., Aerts, C., et al. 2026, AJ, 171, 52, doi: 10.3847/1538-3881/ae0576
-
[66]
Leung, H. W., & Bovy, J. 2019, MNRAS, 483, 3255, doi: 10.1093/mnras/sty3217
-
[67]
Leung, H. W., Bovy, J., Mackereth, J. T., & Miglio, A. 2023, MNRAS, 522, 4577, doi: 10.1093/mnras/stad1272
-
[68]
Li, Y., Bedding, T. R., Murphy, S. J., et al. 2022, Nature Astronomy, 6, 673, doi: 10.1038/s41550-022-01648-5
-
[69]
Li, Y., Bedding, T. R., Huber, D., et al. 2024, ApJ, 974, 77, doi: 10.3847/1538-4357/ad6c3e
-
[70]
Li, Y., Huber, D., Ong, J. M. J., et al. 2025, ApJ, 984, 125, doi: 10.3847/1538-4357/adc737
-
[71]
LSST Science Book, Version 2.0
Lian, J., Zasowski, G., Hasselquist, S., et al. 2022, MNRAS, 511, 5639, doi: 10.1093/mnras/stac479 LSST Science Collaboration, Abell, P. A., Allison, J., et al. 2009, arXiv e-prints, arXiv:0912.0201, doi: 10.48550/arXiv.0912.0201
work page internal anchor Pith review Pith/arXiv arXiv doi:10.1093/mnras/stac479 2022
-
[72]
Lu, Y., Pinsonneault, M. H., Ting, Y.-S., et al. 2026, AJ, 171, 38, doi: 10.3847/1538-3881/ae196b
-
[73]
Lu, Y. L., Angus, R., Curtis, J. L., David, T. J., & Kiman, R. 2021, AJ, 161, 189, doi: 10.3847/1538-3881/abe4d6
-
[74]
Mackereth, J. T., Bovy, J., Leung, H. W., et al. 2019, MNRAS, 489, 176, doi: 10.1093/mnras/stz1521
-
[75]
2025, arXiv e-prints, arXiv:2512.20923, doi: 10.48550/arXiv.2512.20923
Mankowski, C., Tayar, J., & Martin, C. 2025, arXiv e-prints, arXiv:2512.20923, doi: 10.48550/arXiv.2512.20923
-
[76]
2016, MNRAS, 456, 3655, doi: 10.1093/mnras/stv2830 M´esz´aros, S., Jofr´e, P., Johnson, J
Martig, M., Fouesneau, M., Rix, H.-W., et al. 2016, MNRAS, 456, 3655, doi: 10.1093/mnras/stv2830 M´esz´aros, S., Jofr´e, P., Johnson, J. A., et al. 2025, AJ, 170, 96, doi: 10.3847/1538-3881/ade4b9
-
[77]
Miglio, A., Chiappini, C., Mackereth, J. T., et al. 2021a, A&A, 645, A85, doi: 10.1051/0004-6361/202038307
-
[78]
2021b, Experimental Astronomy, 51, 963, doi: 10.1007/s10686-021-09711-1
Miglio, A., Girardi, L., Grundahl, F., et al. 2021b, Experimental Astronomy, 51, 963, doi: 10.1007/s10686-021-09711-1
-
[79]
Miller, N., Joyce, M., Johnson, C. I., et al. 2025, arXiv e-prints, arXiv:2512.08090, doi: 10.48550/arXiv.2512.08090
-
[80]
Morales, L. M., Tayar, J., & Claytor, Z. R. 2025, arXiv e-prints, arXiv:2504.17600, doi: 10.48550/arXiv.2504.17600
discussion (0)
Sign in with ORCID, Apple, or X to comment. Anyone can read and Pith papers without signing in.