Two years of shock interaction tracing three phases of evolution: the explosion of a Type IIn supernova, SN 2019vxm
Pith reviewed 2026-06-25 19:10 UTC · model grok-4.3
The pith
Observations of SN 2019vxm show three sequential phases of shock interaction with circumstellar material over more than two years.
A machine-rendered reading of the paper's core claim, the machinery that carries it, and where it could break.
Core claim
SN 2019vxm's light curve and spectra are shaped by ongoing shock interaction with a massive circumstellar shell, progressing through an early interaction-dominated stage, an intermediate stage with photon scattering that creates symmetric line wings, and a dust-affected late stage where red-wing flux is suppressed, while the broad H-alpha feature consistently indicates at least 3.88 solar masses of ejecta and the total energy output reaches 5x10^50 erg.
What carries the argument
Light-curve modeling that yields a circumstellar mass independent of density profile, combined with time-series spectroscopy that separates interaction, scattering, and dust signatures through line-profile evolution.
If this is right
- The circumstellar mass estimate remains valid across different assumed density profiles for the surrounding material.
- The broad H-alpha component supplies a lower bound on ejecta mass that holds even while interaction is active.
- Late infrared excess can be produced by dust at 1500 K located at distances around 4x10^16 cm without requiring nebular emission.
- Interaction can keep the inner ejecta dense or obscured long enough to prevent nebular lines from appearing for years.
Where Pith is reading between the lines
- Similar long-lived interacting events may commonly require progenitors that lose several solar masses shortly before core collapse.
- The three-phase sequence could serve as a template for interpreting other slowly evolving Type IIn supernovae monitored over multiple years.
- The lack of nebular lines at late times suggests that interaction may mask the true inner ejecta structure in many such objects.
Load-bearing premise
The circumstellar mass derived from light-curve modeling is truly independent of the chosen density profile and the broad H-alpha width reliably gives the minimum ejecta mass without major contamination from ongoing interaction or scattering.
What would settle it
A late-time spectrum after two years that shows clear nebular emission lines, or an independent mass measurement for the circumstellar material that lies outside the 3-8 solar-mass range.
Figures


read the original abstract
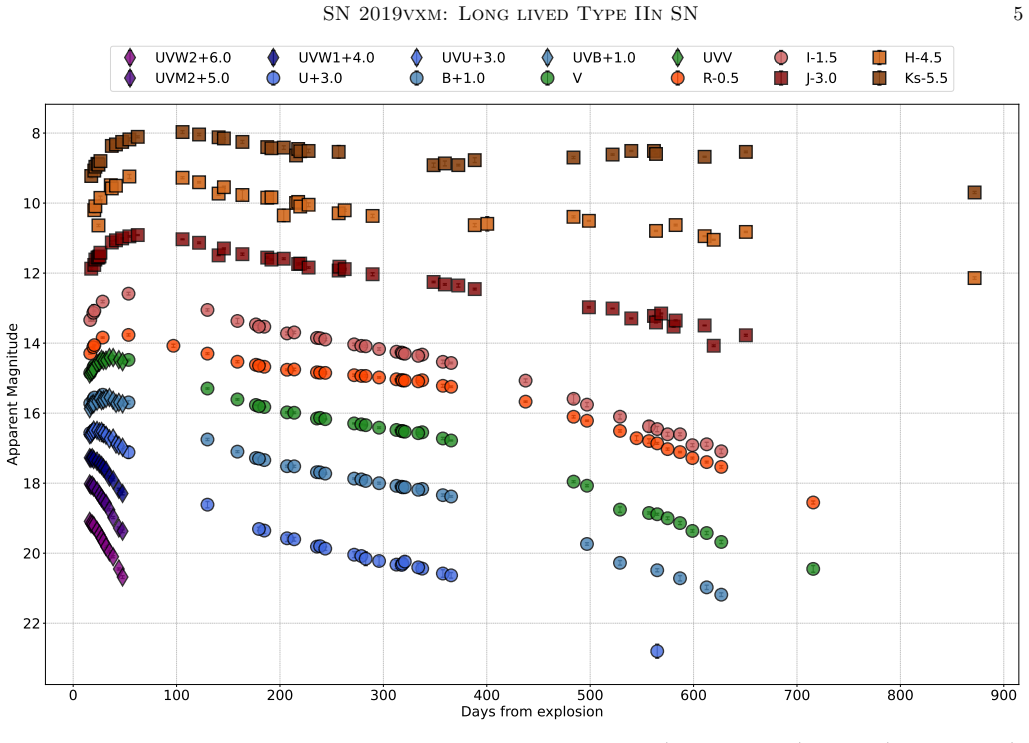
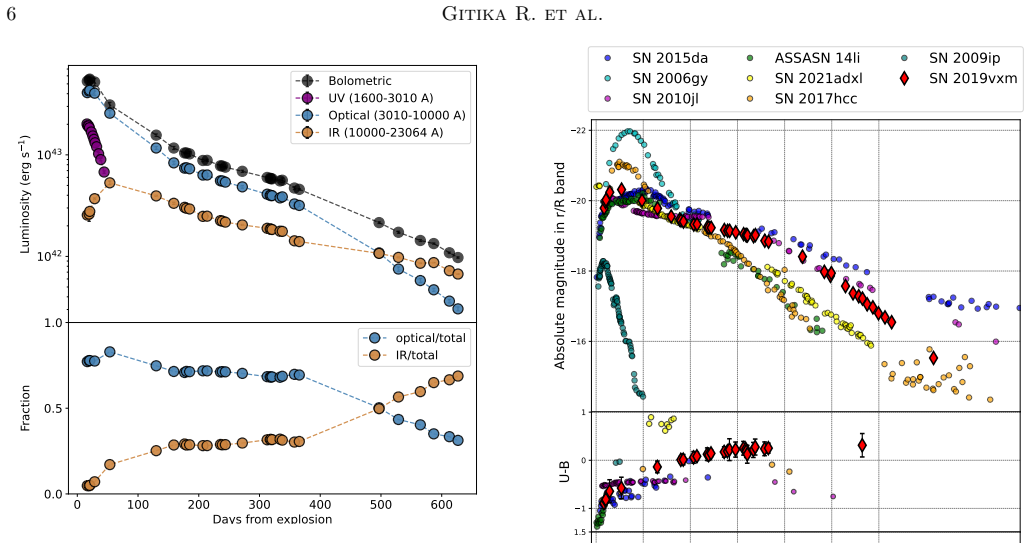
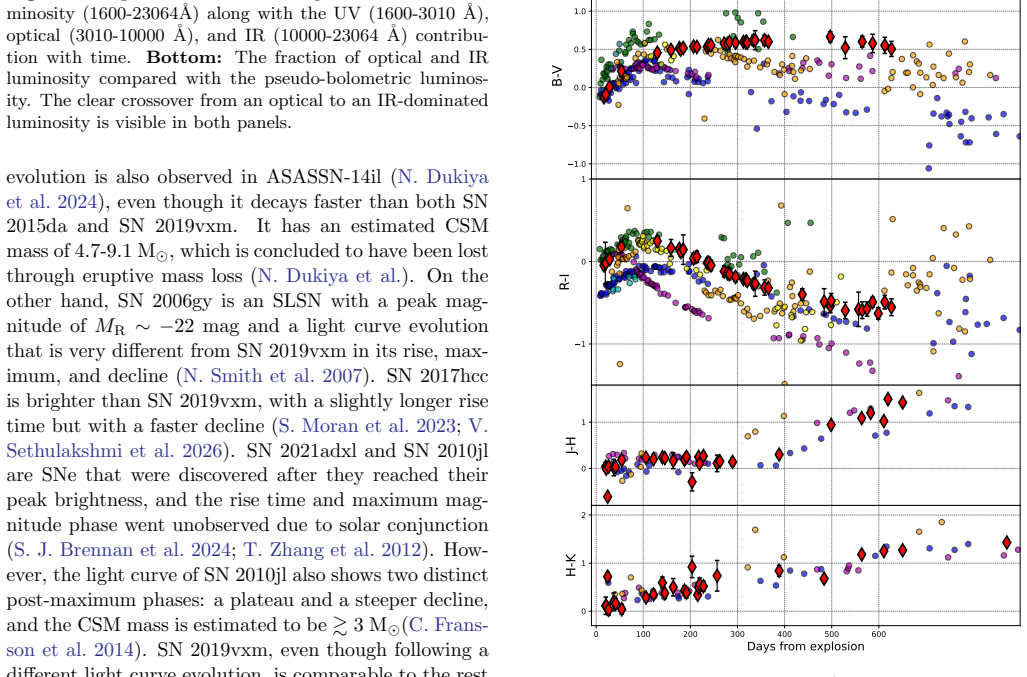
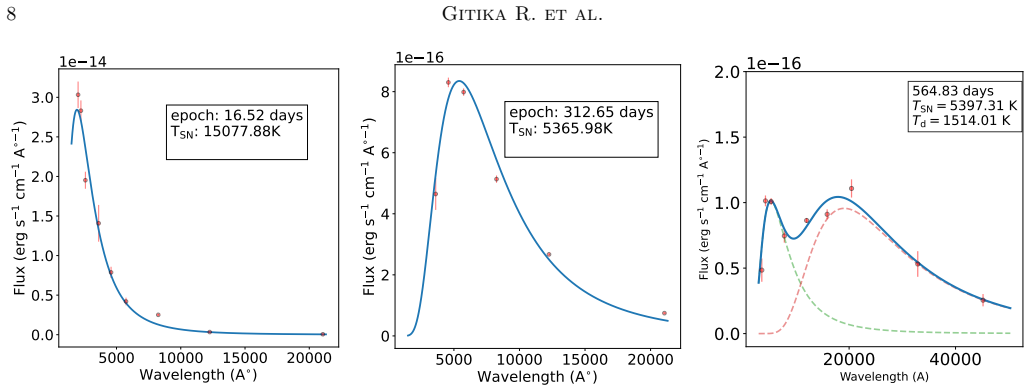
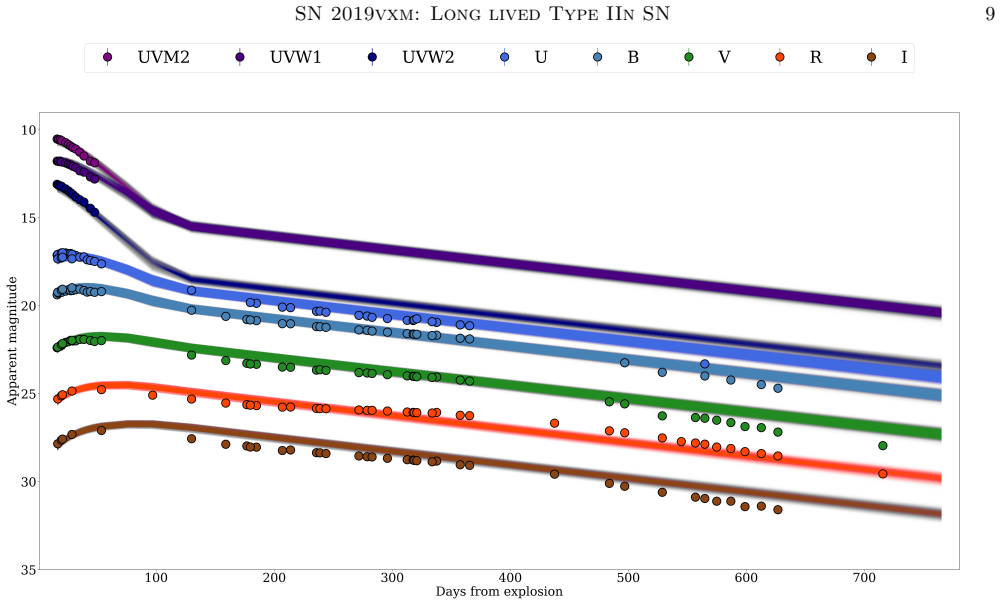
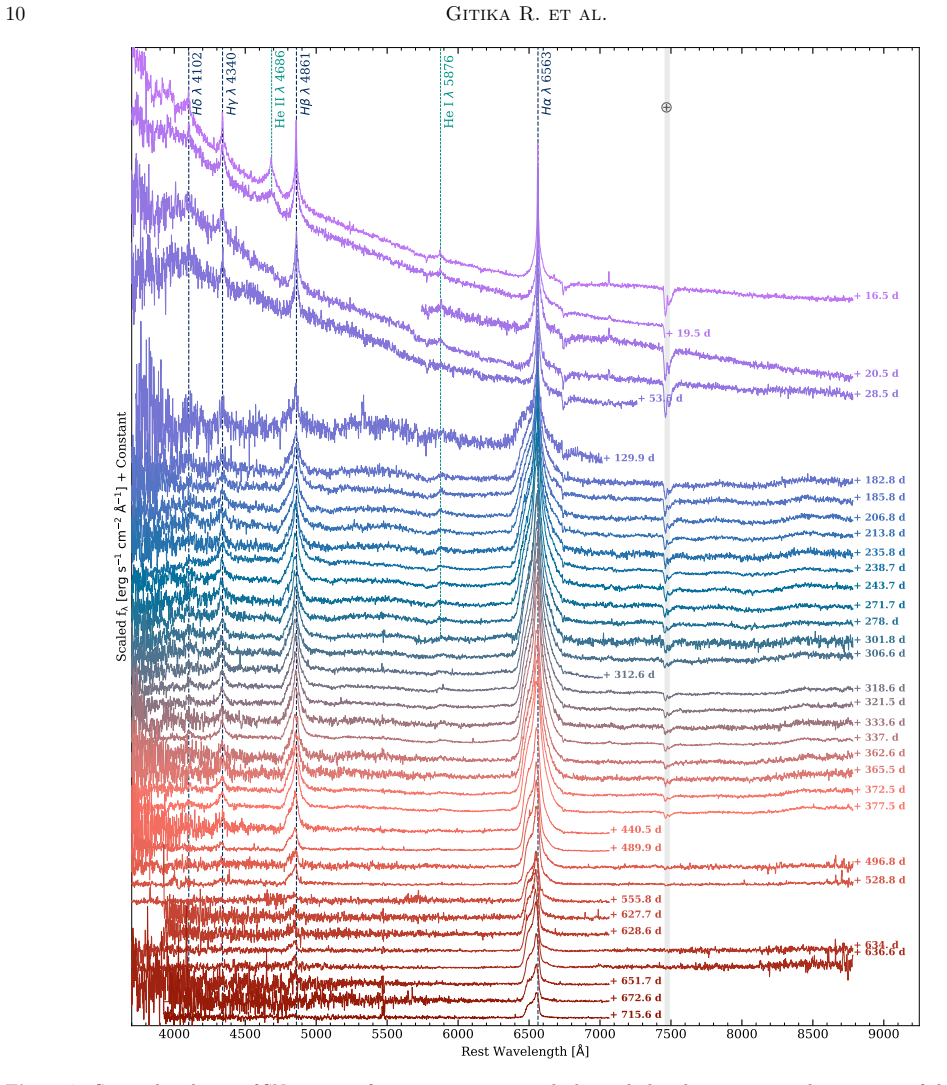
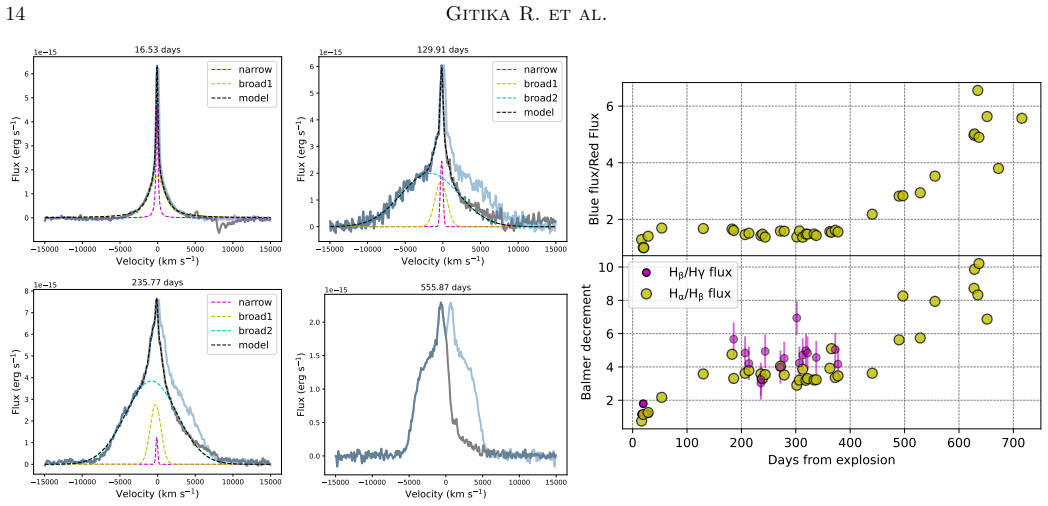
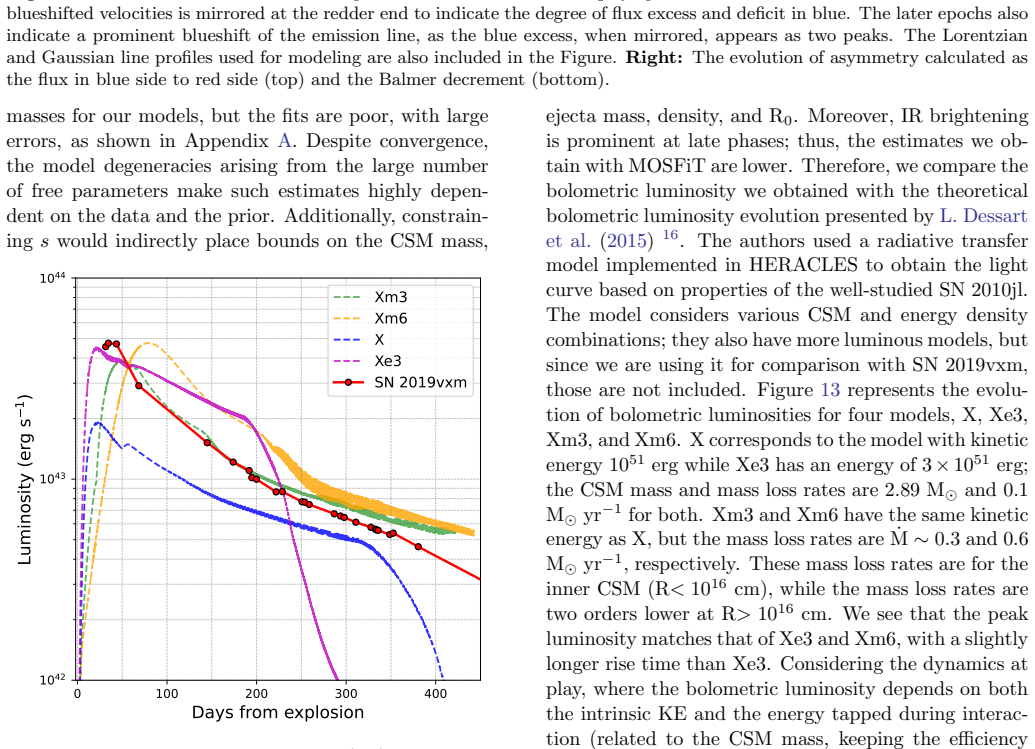
We present multi-wavelength photometric and optical spectroscopic observations of the long-lived interacting supernova SN 2019vxm, spanning more than two years after the explosion. SN 2019vxm is a slowly rising (rise time ~ 45.9 days in the R-band), slowly declining supernova reaching an R-band peak absolute magnitude of ~-20.3 mag. The SN light curve post-maximum shows a shallow decline, followed by a secondary, steeper decline in the optical (0.01 mag/day), with late-time IR brightening. The total radiated luminosity is 5x10^50 erg, placing it among the energetic class of its type. We estimated a CSM mass of 3-8 M_sun through light-curve modeling (independent of the CSM density profile) and by comparison with theoretical models. We estimate a minimum ejecta mass of ~ 3.88 M_sun from the broad H-alpha component, consistent with the ejecta mass obtained from the light curve models. The solely interaction-dominated initial epochs are later accompanied by photon-scattering signatures, leading to asymmetric line profiles with symmetric wings. The late phase, characterized by enhanced brightness at longer wavelengths and a stronger asymmetric line profile with the red side flux strongly suppressed, indicates the influence of pre-existing or newly formed dust with temperatures ~ 1500 K at ~4x10^16 cm. Even in the late phases, no nebular lines are present in the spectra, indicating dense or obscured ejecta.
Editorial analysis
A structured set of objections, weighed in public.
Referee Report
Summary. The manuscript presents multi-wavelength photometric and spectroscopic observations of the Type IIn supernova SN 2019vxm spanning more than two years post-explosion. It identifies three distinct phases of shock interaction evolution, reports a total radiated luminosity of 5×10^50 erg, estimates a CSM mass of 3-8 M_⊙ via light-curve modeling claimed to be independent of the density profile (and by comparison with theoretical models), derives a minimum ejecta mass of ~3.88 M_⊙ from the broad Hα component, and notes late-time IR brightening consistent with dust at ~1500 K at ~4×10^16 cm with no nebular lines present.
Significance. If the mass estimates and phase sequence hold, the work supplies a detailed, long-baseline case study of an energetic, long-lived Type IIn event that traces the transition from interaction-dominated to dust-influenced phases. The multi-epoch data and consistency check between CSM and ejecta masses add to the observational sample used to constrain progenitor mass-loss histories.
major comments (1)
- [Abstract / light-curve modeling] Abstract and light-curve modeling section: The assertion that the CSM mass of 3-8 M_⊙ is obtained independently of the density profile (ρ ∝ r^{-s}) is load-bearing for the three-phase evolutionary claim and the ejecta-mass consistency check. Standard semi-analytic interaction models couple the observed 45.9-day rise time, shallow-then-steep decline, and total radiated energy to both mass and s; the radiated energy alone does not yield mass without an efficiency or velocity factor that itself depends on s. The manuscript must show explicitly whether s is fixed, marginalized, or eliminated by the fitting procedure, as this directly affects the robustness of the reported mass range.
minor comments (2)
- Clarify in the text or a table how the broad Hα component is isolated from ongoing interaction or scattering contributions when deriving the ~3.88 M_⊙ minimum ejecta mass.
- Add explicit references or citations for the theoretical models used to cross-check the CSM mass estimate.
Simulated Author's Rebuttal
We thank the referee for the careful and constructive review. We address the single major comment below and will revise the manuscript accordingly to strengthen the presentation of the light-curve modeling.
read point-by-point responses
-
Referee: [Abstract / light-curve modeling] Abstract and light-curve modeling section: The assertion that the CSM mass of 3-8 M_⊙ is obtained independently of the density profile (ρ ∝ r^{-s}) is load-bearing for the three-phase evolutionary claim and the ejecta-mass consistency check. Standard semi-analytic interaction models couple the observed 45.9-day rise time, shallow-then-steep decline, and total radiated energy to both mass and s; the radiated energy alone does not yield mass without an efficiency or velocity factor that itself depends on s. The manuscript must show explicitly whether s is fixed, marginalized, or eliminated by the fitting procedure, as this directly affects the robustness of the reported mass range.
Authors: We agree that the claim of independence from the density-profile index s requires explicit demonstration rather than assertion. Our CSM mass range of 3–8 M_⊙ was obtained by (i) fitting the multi-band light curve with the semi-analytic interaction model of Chugai et al. (or equivalent) while allowing s to vary between 0 and 2 and (ii) cross-checking the resulting mass against published grids of interacting-SN models that span a range of density profiles. The mass interval remained stable across the explored s values, which is why we described the result as “independent of the CSM density profile.” Nevertheless, the referee is correct that the manuscript does not presently display the fitting procedure, the explored parameter space, or any marginalized posteriors. We will therefore add a dedicated subsection (or appendix) that (a) states the exact model employed, (b) shows the χ² or likelihood surfaces in the (M_CSM, s) plane, and (c) reports the mass range obtained when s is fixed versus when it is marginalized. This revision will make the robustness of the 3–8 M_⊙ interval transparent and will also clarify how the same modeling yields the ejecta-mass consistency check. revision: yes
Circularity Check
No circularity: masses derived from new data via standard modeling
full rationale
The paper applies light-curve modeling and H-alpha line-width analysis directly to its own multi-epoch photometry and spectra of SN 2019vxm. The CSM mass (3-8 M_sun) and minimum ejecta mass (~3.88 M_sun) are outputs of fitting observed rise time, decline phases, and line profiles; they do not reduce by the paper's equations to any prior fitted quantities or self-citations. The independence claim for the density-profile result is presented as a modeling outcome rather than a definitional identity. No load-bearing step matches any enumerated circularity pattern.
Axiom & Free-Parameter Ledger
free parameters (2)
- CSM mass =
3-8 M_sun
- Ejecta mass lower limit =
~3.88 M_sun
axioms (2)
- domain assumption Initial epochs are solely interaction-dominated
- domain assumption Late-time IR excess traces pre-existing or newly formed dust at ~1500 K
Reference graph
Works this paper leans on
-
[1]
2014, in Society of Photo-Optical Instrumentation Engineers (SPIE) Conference Series, Vol
Akitaya, H., Moritani, Y., Ui, T., et al. 2014, in Society of Photo-Optical Instrumentation Engineers (SPIE) Conference Series, Vol. 9147, Ground-based and Airborne Instrumentation for Astronomy V, ed. S. K. Ramsay, I. S. McLean, & H. Takami, 91474O, doi: 10.1117/12.2054577
-
[2]
E., Smith, N., McCully, C., et al
Andrews, J. E., Smith, N., McCully, C., et al. 2017, MNRAS, 471, 4047, doi: 10.1093/mnras/stx1844
-
[3]
Anupama, G. C., Sahu, D. K., Gurugubelli, U. K., et al. 2009, MNRAS, 392, 894, doi: 10.1111/j.1365-2966.2008.14129.x
-
[4]
2025, ApJ, 983, 101, doi: 10.3847/1538-4357/adc00a
Baer-Way, R., Chandra, P., Modjaz, M., et al. 2025, ApJ, 983, 101, doi: 10.3847/1538-4357/adc00a
-
[5]
M., Krafton, K., Wesson, R., et al
Bevan, A. M., Krafton, K., Wesson, R., et al. 2020, ApJ, 894, 111, doi: 10.3847/1538-4357/ab86a2
-
[6]
J., Schulze, S., Lunnan, R., et al
Brennan, S. J., Schulze, S., Lunnan, R., et al. 2024, A&A, 690, A259, doi: 10.1051/0004-6361/202349036
-
[7]
Chatzopoulos, E., Wheeler, J. C., & Vinko, J. 2012, ApJ, 746, 121, doi: 10.1088/0004-637X/746/2/121
-
[8]
Chatzopoulos, E., Wheeler, J. C., Vinko, J., Horvath, Z. L., & Nagy, A. 2013, ApJ, 773, 76, doi: 10.1088/0004-637X/773/1/76
-
[9]
Chevalier, R. A. 1976, ApJ, 207, 872, doi: 10.1086/154557
-
[10]
Chugai, N. N. 1997, Ap&SS, 252, 225, doi: 10.1023/A:1000847125928
-
[11]
Chugai, N. N. 2001, MNRAS, 326, 1448, doi: 10.1111/j.1365-2966.2001.04717.x
-
[12]
Chugai, N. N., & Danziger, I. J. 1994, MNRAS, 268, 173, doi: 10.1093/mnras/268.1.173
-
[13]
2023, A&A, 670, A48, doi: 10.1051/0004-6361/202244867
Cold, C., & Hjorth, J. 2023, A&A, 670, A48, doi: 10.1051/0004-6361/202244867
-
[14]
M., Skrutskie, M
Cutri, R. M., Skrutskie, M. F., van Dyk, S., et al. 2003, VizieR Online Data Catalog: 2MASS All-Sky Catalog of Point Sources (Cutri+ 2003),, VizieR On-line Data Catalog: II/246. Originally published in: University of Massachusetts and Infrared Processing and Analysis Center, (IPAC/California Institute of Technology) (2003)
2003
-
[15]
Das, K. K., Kasliwal, M. M., Sollerman, J., et al. 2026, PASP, 138, 024204, doi: 10.1088/1538-3873/ae33f5
-
[16]
2024, arXiv e-prints, arXiv:2405.04259, doi: 10.48550/arXiv.2405.04259
Dessart, L. 2024, arXiv e-prints, arXiv:2405.04259, doi: 10.48550/arXiv.2405.04259
-
[17]
Dessart, L., Audit, E., & Hillier, D. J. 2015, MNRAS, 449, 4304, doi: 10.1093/mnras/stv609
-
[18]
Draine, B. T., & Salpeter, E. E. 1979, ApJ, 231, 438, doi: 10.1086/157206
-
[19]
Drake, S. A., & Ulrich, R. K. 1980, ApJS, 42, 351, doi: 10.1086/190654
-
[20]
2024, The Astrophysical Journal, 976, 86, doi: 10.3847/1538-4357/ad7e11
Dukiya, N., Gangopadhyay, A., Misra, K., et al. 2024, The Astrophysical Journal, 976, 86, doi: 10.3847/1538-4357/ad7e11
-
[21]
Dwek, E., Sarangi, A., Arendt, R. G., et al. 2021, ApJ, 917, 84, doi: 10.3847/1538-4357/ac09ea
-
[22]
2026, A&A, 706, A169, doi: 10.1051/0004-6361/202557572
Ercolino, A., Jin, H., Langer, N., et al. 2026, A&A, 706, A169, doi: 10.1051/0004-6361/202557572
-
[23]
Evans, A., Banerjee, D. P. K., Gehrz, R. D., et al. 2017, MNRAS, 466, 4221, doi: 10.1093/mnras/stw3334
-
[24]
2024, ApJ, 977, 152, doi: 10.3847/1538-4357/ad8cd3
Farias, D., Gall, C., Narayan, G., et al. 2024, ApJ, 977, 152, doi: 10.3847/1538-4357/ad8cd3
-
[25]
Filippenko, A. V. 1997, ARA&A, 35, 309, doi: 10.1146/annurev.astro.35.1.309 SN 2019vxm: Long lived Type IIn SN25
-
[26]
Fitzpatrick, E. L., & Massa, D. 2007, ApJ, 663, 320, doi: 10.1086/518158
-
[27]
J., Berger, E., Fox, O., et al
Foley, R. J., Berger, E., Fox, O., et al. 2011, ApJ, 732, 32, doi: 10.1088/0004-637X/732/1/32
-
[28]
J., Smith, N., Ganeshalingam, M., et al
Foley, R. J., Smith, N., Ganeshalingam, M., et al. 2007, ApJL, 657, L105, doi: 10.1086/513145
-
[29]
Fox, O., Skrutskie, M. F., Chevalier, R. A., et al. 2009, ApJ, 691, 650, doi: 10.1088/0004-637X/691/1/650
-
[30]
Fox, O. D., & Smith, N. 2019, MNRAS, 488, 3772, doi: 10.1093/mnras/stz1925
-
[31]
Fox, O. D., Chevalier, R. A., Skrutskie, M. F., et al. 2011, ApJ, 741, 7, doi: 10.1088/0004-637X/741/1/7
-
[32]
Fransson, C., Ergon, M., Challis, P. J., et al. 2014, ApJ, 797, 118, doi: 10.1088/0004-637X/797/2/118
-
[33]
2020, Royal Society Open Science, 7, 200467, doi: 10.1098/rsos.200467
Fraser, M. 2020, Royal Society Open Science, 7, 200467, doi: 10.1098/rsos.200467
-
[34]
Gal-Yam, A., & Leonard, D. C. 2009, Nature, 458, 865, doi: 10.1038/nature07934
-
[35]
2004, ApJ, 611, 1005, doi: 10.1086/422091
Gehrels, N., Chincarini, G., Giommi, P., et al. 2004, ApJ, 611, 1005, doi: 10.1086/422091
-
[36]
Guillochon, J., Nicholl, M., Villar, V. A., et al. 2018, ApJS, 236, 6, doi: 10.3847/1538-4365/aab761
-
[37]
2024, arXiv e-prints, arXiv:2411.07287, doi: 10.48550/arXiv.2411.07287 Ivezi´ c,ˇZ., Kahn, S
Hiramatsu, D., Berger, E., Gomez, S., et al. 2024, arXiv e-prints, arXiv:2411.07287, doi: 10.48550/arXiv.2411.07287
-
[38]
Hiramatsu, D., Howell, D. A., Moriya, T. J., et al. 2021, ApJ, 913, 55, doi: 10.3847/1538-4357/abf6d6
-
[39]
Case B calculations for H I and He II
Hummer, D. G., & Storey, P. J. 1987, MNRAS, 224, 801, doi: 10.1093/mnras/224.3.801
-
[40]
Khatami, D. K., & Kasen, D. N. 2024, ApJ, 972, 140, doi: 10.3847/1538-4357/ad60c0
-
[41]
Lamers, H. J. G. L. M., & Cassinelli, J. P. 1999, Introduction to Stellar Winds
1999
-
[42]
Landolt, A. U. 1992, AJ, 104, 340, doi: 10.1086/116242
-
[43]
G., Ridden-Harper, R., Rest, S., et al
Lane, Z. G., Ridden-Harper, R., Rest, S., et al. 2026, The Astrophysical Journal, 1003, 19, doi: 10.3847/1538-4357/ae6245
-
[44]
2019, Transient Name Server Classification Report, 2019-2506, 1
Leadbeater, R. 2019, Transient Name Server Classification Report, 2019-2506, 1
2019
-
[45]
2026, arXiv e-prints, arXiv:2605.23637
Lelkes, K., Moln´ ar, L., Vink´ o, J., et al. 2026, arXiv e-prints, arXiv:2605.23637. https://arxiv.org/abs/2605.23637
Pith/arXiv arXiv 2026
-
[46]
2022, ApJ, 933, 238, doi: 10.3847/1538-4357/ac771a
Margalit, B. 2022, ApJ, 933, 238, doi: 10.3847/1538-4357/ac771a
-
[47]
Mauerhan, J. C., Smith, N., Filippenko, A. V., et al. 2013, MNRAS, 430, 1801, doi: 10.1093/mnras/stt009
-
[48]
2023, A&A, 669, A51, doi: 10.1051/0004-6361/202244565
Moran, S., Fraser, M., Kotak, R., et al. 2023, A&A, 669, A51, doi: 10.1051/0004-6361/202244565
-
[49]
2020, A&A, 637, A73, doi: 10.1051/0004-6361/201936097
Nyholm, A., Sollerman, J., Tartaglia, L., et al. 2020, A&A, 637, A73, doi: 10.1051/0004-6361/201936097
-
[50]
Ofek, E. O., Sullivan, M., Shaviv, N. J., et al. 2014, ApJ, 789, 104, doi: 10.1088/0004-637X/789/2/104
-
[51]
Osterbrock, D. E. 1989, Astrophysics of gaseous nebulae and active galactic nuclei
1989
-
[52]
2013, The Astrophysical Journal, 767, 1, doi: 10.1088/0004-637x/767/1/1
Pastorello, A., Cappellaro, E., Inserra, C., et al. 2013, ApJ, 767, 1, doi: 10.1088/0004-637X/767/1/1
-
[53]
Prabhu, T. P. 2014, Proceedings of the Indian National Science Academy Part A, 80, 887, doi: 10.16943/ptinsa/2014/v80i4/55174
-
[54]
, archivePrefix = "arXiv", eprint =
Quataert, E., & Shiode, J. 2012, MNRAS, 423, L92, doi: 10.1111/j.1745-3933.2012.01264.x
-
[55]
Ransome, C. L., & Villar, V. A. 2025, ApJ, 987, 13, doi: 10.3847/1538-4357/adce03
-
[56]
M., Nagao, T., Maeda, K., et al
Reynolds, T. M., Nagao, T., Maeda, K., et al. 2025, A&A, 702, A213, doi: 10.1051/0004-6361/202553793
-
[57]
Roming, P. W. A., Kennedy, T. E., Mason, K. O., et al. 2005, SSRv, 120, 95, doi: 10.1007/s11214-005-5095-4
work page internal anchor Pith review doi:10.1007/s11214-005-5095-4 2005
-
[58]
doi:10.1126/science.1223344 , eprint =
Sana, H., de Mink, S. E., de Koter, A., et al. 2012, Science, 337, 444, doi: 10.1126/science.1223344
-
[59]
Measuring Reddening with SDSS Stellar Spectra and Recalibrating SFD
Schlafly, E. F., & Finkbeiner, D. P. 2011, ApJ, 737, 103, doi: 10.1088/0004-637X/737/2/103
work page internal anchor Pith review doi:10.1088/0004-637x/737/2/103 2011
-
[60]
Schlegel, E. M. 1990, MNRAS, 244, 269
1990
-
[61]
Sethulakshmi, V., Sutaria, F. K., Sharma, R., & Ray, A. 2026, ApJ, 1001, 169, doi: 10.3847/1538-4357/ae47f6
-
[62]
Shahbandeh, M., Fox, O. D., Temim, T., et al. 2025, ApJ, 985, 262, doi: 10.3847/1538-4357/adce77
-
[63]
Shaviv, N. J. 2001, MNRAS, 326, 126, doi: 10.1046/j.1365-8711.2001.04574.x
-
[64]
2014, ARA&A, 52, 487, doi: 10.1146/annurev-astro-081913-040025
Smith, N. 2014, ARA&A, 52, 487, doi: 10.1146/annurev-astro-081913-040025
-
[65]
2017, in Handbook of Supernovae, ed
Smith, N. 2017, in Handbook of Supernovae, ed. A. W. Alsabti & P. Murdin, 403, doi: 10.1007/978-3-319-21846-5 38
-
[66]
Smith, N., & Andrews, J. E. 2020, MNRAS, 499, 3544, doi: 10.1093/mnras/staa3047
-
[67]
Smith, N., Andrews, J. E., Milne, P., et al. 2024, MNRAS, 530, 405, doi: 10.1093/mnras/stae726
-
[68]
Smith, N., Li, W., Foley, R. J., et al. 2007, ApJ, 666, 1116, doi: 10.1086/519949
-
[69]
Smith, N., Silverman, J. M., Chornock, R., et al. 2009, ApJ, 695, 1334, doi: 10.1088/0004-637X/695/2/1334
-
[70]
Smith, N., Li, W., Miller, A. A., et al. 2011, ApJ, 732, 63, doi: 10.1088/0004-637X/732/2/63
-
[71]
Speagle, J. S. 2020, MNRAS, 493, 3132, doi: 10.1093/mnras/staa278
-
[72]
Stanek, K. Z. 2019, Transient Name Server Discovery Report, 2019-2492, 1
2019
-
[73]
Strotjohann, N. L., Ofek, E. O., Gal-Yam, A., et al. 2021, ApJ, 907, 99, doi: 10.3847/1538-4357/abd032 26Gitika R. et al
-
[74]
Suzuki, A., Nicholl, M., Moriya, T. J., & Takiwaki, T. 2021, ApJ, 908, 99, doi: 10.3847/1538-4357/abd6ce
-
[75]
2020, A&A, 635, A39, doi: 10.1051/0004-6361/201936553
Tartaglia, L., Pastorello, A., Sollerman, J., et al. 2020, A&A, 635, A39, doi: 10.1051/0004-6361/201936553
-
[76]
Teja, R. S., Singh, A., Sahu, D. K., et al. 2022, ApJ, 930, 34, doi: 10.3847/1538-4357/ac610b
-
[77]
doi:10.1117/12.968154 , editor =
Tody, D. 1986, in Society of Photo-Optical Instrumentation Engineers (SPIE) Conference Series, Vol. 627, Instrumentation in astronomy VI, ed. D. L. Crawford, 733, doi: 10.1117/12.968154
-
[78]
Tonry, J. L., Denneau, L., Heinze, A. N., et al. 2018, PASP, 130, 064505, doi: 10.1088/1538-3873/aabadf
work page internal anchor Pith review doi:10.1088/1538-3873/aabadf 2018
-
[79]
Tsvetkov, D. Y., Pavlyuk, N. N., Dodin, A. V., et al. 2024, Astronomische Nachrichten, 345, e20230166, doi: 10.1002/asna.20230166
-
[80]
Utrobin, V. P., & Chugai, N. N. 2024, Ap&SS, 369, 49, doi: 10.1007/s10509-024-04311-9
discussion (0)
Sign in with ORCID, Apple, or X to comment. Anyone can read and Pith papers without signing in.