Edge of Stability Selectively Shapes Learning Across the Data Distribution
Pith reviewed 2026-06-28 10:25 UTC · model grok-4.3
The pith
The edge of stability redistributes learning progress across subsets of the training data by favoring some groups and suppressing others.
A machine-rendered reading of the paper's core claim, the machinery that carries it, and where it could break.
Core claim
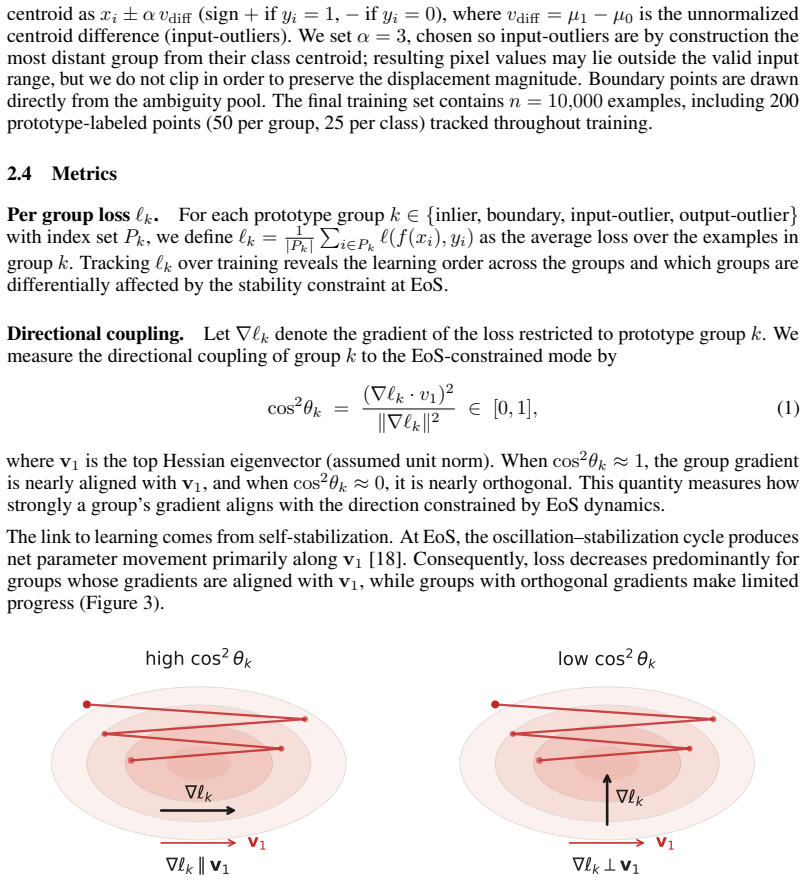
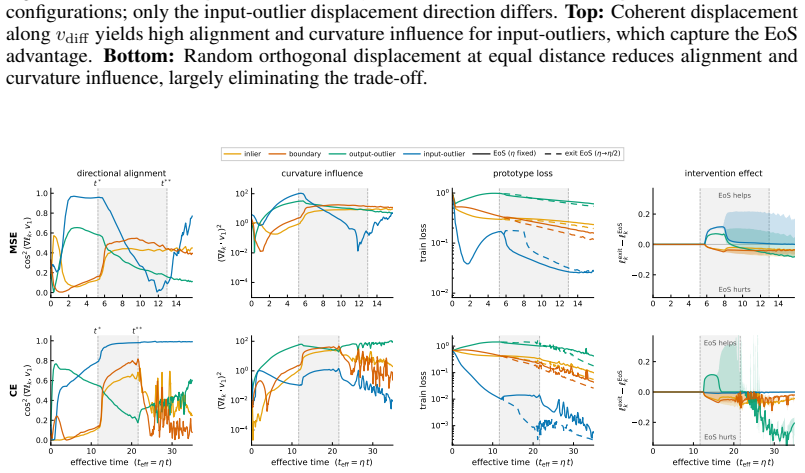
Entering the edge-of-stability regime from a fixed training state produces a measurable trade-off: groups whose gradients align with the dominant Hessian direction and sustain magnitude receive accelerated progress, while other groups see their progress slowed. The alignment condition is isolated by a controlled perturbation that preserves distance but randomizes direction, removing the benefit. Gradient saturation under cross-entropy decouples groups that become confidently classified, leaving the advantage with output-outliers whose gradients do not vanish.
What carries the argument
The branching intervention that enters or exits the edge-of-stability regime from an identical training state, together with the requirement that a group's aggregate gradient aligns with the top Hessian eigenvector.
If this is right
- Groups whose gradients point along the top Hessian eigenvector will show faster loss reduction while the optimizer stays at the edge of stability.
- Confidently classified groups lose their learning rate once their gradients approach zero, shifting relative advantage to output-outliers.
- The stability boundary therefore functions as an allocator that determines which subsets of the data receive more optimization effort.
- Any intervention that preserves or breaks alignment with the top eigenvector will directly control whether a group benefits from the edge-of-stability regime.
Where Pith is reading between the lines
- Designers of training curricula could deliberately engineer gradient alignments to steer which subgroups receive accelerated learning.
- The same mechanism may help explain why certain subpopulations remain under-learned even after overall training loss has plateaued.
- Extending the branching intervention to other loss functions could test whether the advantage for output-outliers is specific to cross-entropy saturation.
Load-bearing premise
The branching intervention changes only the stability regime and does not introduce separate alterations to gradient magnitudes or directions that would affect group progress on their own.
What would settle it
A controlled experiment in which groups are matched for gradient magnitude but one set is forced into alignment with the top Hessian eigenvector while the other is not; if the aligned set shows no extra progress once inside the edge-of-stability regime, the claimed selectivity mechanism is false.
Figures


read the original abstract
Existing analyses of the edge of stability (EoS) treat it as a global property of optimization. We show that it is also selective: the stability constraint redistributes learning across subsets of the training distribution, amplifying progress on some groups while suppressing progress on others. Using a branching intervention that enters or exits the EoS regime from the same training state, we causally demonstrate this trade-off and identify two necessary conditions for a group to benefit. First, its aggregate gradient must align with the top Hessian eigenvector. We isolate this mechanism with a controlled perturbation that preserves distance but randomizes direction, destroying alignment and eliminating the advantage. Second, the group must sustain non-vanishing gradient magnitude over time. Under cross-entropy loss, gradient saturation decouples confidently classified groups, shifting the advantage to output-outliers, whose gradients persist. Together, these results show that EoS functions not only as a stability boundary, but as a mechanism governing the allocation of learning across the data distribution.
Editorial analysis
A structured set of objections, weighed in public.
Referee Report
Summary. The manuscript claims that the edge of stability (EoS) is not merely a global optimization property but selectively redistributes learning progress across subsets of the training distribution. A branching intervention is used to enter or exit the EoS regime from an identical training state, causally demonstrating amplification of progress on some groups and suppression on others. Two necessary conditions for a group to benefit are identified: (1) alignment of its aggregate gradient with the top Hessian eigenvector (isolated via a controlled perturbation that preserves distance but randomizes direction), and (2) sustained non-vanishing gradient magnitude (attributed to gradient saturation under cross-entropy, which decouples confidently classified groups and favors output-outliers).
Significance. If the causal claims hold, the work provides a mechanistic account of how sharpness constraints allocate learning resources differentially across the data distribution. This could explain differential progress on subgroups, inform analyses of example difficulty, and connect EoS to broader questions of generalization and fairness. The use of controlled interventions (branching and perturbation) is a methodological strength that moves beyond purely observational analyses of sharpness.
major comments (2)
- [§3 (Branching Intervention)] §3 (Branching Intervention): the manuscript does not report explicit verification that the branching step preserves per-group gradient norms and directions. This verification is load-bearing for the central causal claim, as any systematic shift in gradient statistics induced by the intervention itself could produce the observed amplification/suppression trade-off independent of the stability constraint.
- [§4.1 (Alignment Mechanism)] §4.1 (Alignment Mechanism): the controlled perturbation is described as preserving distance while randomizing direction, but no quantitative check is provided on whether the post-perturbation gradient alignment with the top eigenvector is reduced to chance levels across the tested groups. Without this, the isolation of the alignment condition remains incomplete.
minor comments (2)
- Notation for group-wise quantities (e.g., aggregate gradient G_g) is introduced without a consolidated table of symbols, making cross-references between the alignment and magnitude conditions harder to track.
- Figure captions for the branching results should explicitly state the number of random seeds and whether error bars reflect standard deviation across seeds or across groups.
Simulated Author's Rebuttal
We thank the referee for the constructive comments, which highlight opportunities to strengthen the causal evidence in our branching and perturbation experiments. We address each point below and will revise the manuscript accordingly.
read point-by-point responses
-
Referee: [§3 (Branching Intervention)] §3 (Branching Intervention): the manuscript does not report explicit verification that the branching step preserves per-group gradient norms and directions. This verification is load-bearing for the central causal claim, as any systematic shift in gradient statistics induced by the intervention itself could produce the observed amplification/suppression trade-off independent of the stability constraint.
Authors: We agree that explicit verification is important for the causal claim. The branching intervention is constructed to act only on global optimizer state (e.g., step-size or sharpness threshold) while leaving the model parameters, data batches, and per-example loss computations unchanged at the branching instant. In the revision we will add a supplementary figure and table that directly compare per-group gradient norms and cosine similarities immediately before and after the branch, confirming that any differences fall within numerical precision and do not systematically favor or disfavor any group. revision: yes
-
Referee: [§4.1 (Alignment Mechanism)] §4.1 (Alignment Mechanism): the controlled perturbation is described as preserving distance while randomizing direction, but no quantitative check is provided on whether the post-perturbation gradient alignment with the top eigenvector is reduced to chance levels across the tested groups. Without this, the isolation of the alignment condition remains incomplete.
Authors: We accept that a quantitative confirmation would make the isolation of the alignment mechanism more rigorous. The perturbation is implemented by adding a small random vector of fixed Euclidean norm to the aggregate gradient before the update. In the revised version we will include a table reporting the pre- and post-perturbation cosine similarities between each group’s gradient and the top Hessian eigenvector, demonstrating that post-perturbation alignments are statistically indistinguishable from zero (i.e., chance level) across all groups examined. revision: yes
Circularity Check
No circularity: empirical intervention claims rest on experimental controls, not self-referential definitions or fitted predictions
full rationale
The paper presents its central claims via a branching intervention and controlled perturbations described in the abstract, without any equations, fitted parameters renamed as predictions, or self-citations that reduce the result to its inputs by construction. No self-definitional steps, uniqueness theorems, or ansatzes appear in the provided text. The derivation chain is therefore self-contained as an empirical demonstration rather than a mathematical reduction.
Axiom & Free-Parameter Ledger
Reference graph
Works this paper leans on
-
[1]
Understanding deep learning requires rethinking generalization
Chiyuan Zhang, Samy Bengio, Moritz Hardt, Benjamin Recht, and Oriol Vinyals. Understanding deep learning requires rethinking generalization. InInternational Conference on Learning Representations, 2017. arXiv:1611.03530
work page internal anchor Pith review Pith/arXiv arXiv 2017
-
[2]
On large-batch training for deep learning: Generalization gap and sharp minima
Nitish Shirish Keskar, Dheevatsa Mudigere, Jorge Nocedal, Mikhail Smelyanskiy, and Ping Tak Peter Tang. On large-batch training for deep learning: Generalization gap and sharp minima. InInternational Conference on Learning Representations, 2017
2017
-
[3]
Three Factors Influencing Minima in SGD
Stanislaw Jastrz˛ ebski, Zachary Kenton, Devansh Arpit, Nicolas Ballas, Asja Fischer, Yoshua Bengio, and Amos Storkey. Three factors influencing minima in sgd.arXiv preprint arXiv:1711.04623, September 2018
work page internal anchor Pith review Pith/arXiv arXiv 2018
-
[4]
Chen Xing, Devansh Arpit, Christos Tsirigotis, and Yoshua Bengio. A walk with sgd.arXiv preprint arXiv:1802.08770, 2018
work page internal anchor Pith review Pith/arXiv arXiv 2018
-
[5]
On the relation between the sharpest directions of DNN loss and the SGD step length
Stanisław Jastrz˛ ebski, Zachary Kenton, Nicolas Ballas, Asja Fischer, Yoshua Bengio, and Amos Storkey. On the relation between the sharpest directions of DNN loss and the SGD step length. InInternational Conference on Learning Representations, 2019. arXiv:1807.05031
-
[6]
The break-even point on optimization trajectories of deep neural networks
Stanislaw Jastrzebski, Maciej Szymczak, Stanislav Fort, Devansh Arpit, Jacek Tabor, Kyunghyun Cho, and Krzysztof Geras. The break-even point on optimization trajectories of deep neural networks. InInternational Conference on Learning Representations, 2020. arXiv:2002.09572
-
[7]
Zico Kolter, and Ameet Talwalkar
Jeremy Cohen, Simran Kaur, Yuanzhi Li, J. Zico Kolter, and Ameet Talwalkar. Gradient descent on neural networks typically occurs at the edge of stability. InInternational Conference on Learning Representations, 2021
2021
-
[8]
Dahl, and Justin Gilmer
Jeremy Cohen, Behrooz Ghorbani, Shankar Krishnan, Naman Agarwal, Sourabh Medapati, Michal Badura, Daniel Suo, Zachary Nado, George E. Dahl, and Justin Gilmer. Adaptive gradient methods at the edge of stability. InNeurIPS 2023 Workshop on Heavy Tails in Machine Learning: Structure, Stability, and Dynamics, 2023
2023
-
[9]
Arseniy Andreyev and Pierfrancesco Beneventano. Edge of stochastic stability: Revisiting the edge of stability for SGD.arXiv preprint arXiv:2412.20553, 2024
-
[10]
Momentum Further Constrains Sharpness at the Edge of Stochastic Stability
Arseniy Andreyev, Advikar Ananthkumar, Marc Walden, Tomaso Poggio, and Pierfrancesco Beneventano. Momentum further constrains sharpness at the edge of stochastic stability.arXiv preprint arXiv:2604.14108, 2026
work page internal anchor Pith review Pith/arXiv arXiv 2026
-
[11]
Non-Euclidean Gradient Descent Operates at the Edge of Stability
Rustem Islamov, Michael Crawshaw, Jeremy Cohen, and Robert Gower. Non-euclidean gradient descent operates at the edge of stability.arXiv preprint arXiv:2603.05002, 2026
work page internal anchor Pith review Pith/arXiv arXiv 2026
-
[12]
Dayal Singh Kalra, Jean-Christophe Gagnon-Audet, Andrey Gromov, Ishita Mediratta, Kelvin Niu, Alexander H Miller, and Michael Shvartsman. A scalable measure of loss landscape curvature for analyzing the training dynamics of llms.arXiv preprint arXiv:2601.16979, 2026
-
[13]
Does Weight Decay Enhance Training Stability?
Marius Saether, Amir Kolic, Tomaso Poggio, and Pierfrancesco Beneventano. Does weight decay enhance training stability?arXiv preprint arXiv:2605.16622, 2026. 10
work page internal anchor Pith review Pith/arXiv arXiv 2026
-
[14]
Flat minima.Neural Computation, 9(1):1–42, 1997
Sepp Hochreiter and Jürgen Schmidhuber. Flat minima.Neural Computation, 9(1):1–42, 1997
1997
-
[15]
Sharpness-aware min- imization for efficiently improving generalization
Pierre Foret, Ariel Kleiner, Hossein Mobahi, and Behnam Neyshabur. Sharpness-aware min- imization for efficiently improving generalization. InInternational Conference on Learning Representations, 2021
2021
-
[16]
Sharp minima can generalize for deep nets
Laurent Dinh, Razvan Pascanu, Samy Bengio, and Yoshua Bengio. Sharp minima can generalize for deep nets. InInternational Conference on Machine Learning, volume 70, pages 1019–1028. PMLR, 2017
2017
-
[17]
Too Sharp, Too Sure: When Calibration Follows Curvature
Alessandro Morosini, Matea Gjika, Tomaso Poggio, and Pierfrancesco Beneventano. Too sharp, too sure: When calibration follows curvature.arXiv preprint arXiv:2604.20614, 2026
work page internal anchor Pith review Pith/arXiv arXiv 2026
-
[18]
Alex Damian, Eshaan Nichani, and Jason D. Lee. Self-stabilization: The implicit bias of gradient descent at the edge of stability. InInternational Conference on Learning Representations, 2023
2023
-
[19]
Learning multiple layers of features from tiny images
Alex Krizhevsky. Learning multiple layers of features from tiny images. Technical report, University of Toronto, 2009
2009
-
[20]
Towards deep learning models resistant to adversarial attacks
Aleksander Madry, Aleksandar Makelov, Ludwig Schmidt, Dimitris Tsipras, and Adrian Vladu. Towards deep learning models resistant to adversarial attacks. InInternational Conference on Learning Representations, 2018
2018
-
[21]
Beyond the edge of stability via two-step gradient updates
Lei Chen and Joan Bruna. Beyond the edge of stability via two-step gradient updates. InInter- national Conference on Machine Learning, volume 202 ofProceedings of Machine Learning Research, pages 4330–4391. PMLR, 2023
2023
-
[22]
Edge of stochastic stability, 2025
Arseniy Andreyev and Pierfrancesco Beneventano. Edge of stochastic stability, 2025. Software, Apache 2.0 license
2025
-
[23]
Understanding edge-of- stability training dynamics with a minimalist example
Xingyu Zhu, Zixuan Wang, Xiang Wang, Mo Zhou, and Rong Ge. Understanding edge-of- stability training dynamics with a minimalist example. InInternational Conference on Learning Representations, 2023
2023
-
[24]
Understanding the generalization benefit of normalization layers: Sharpness reduction
Kaifeng Lyu, Zhiyuan Li, and Sanjeev Arora. Understanding the generalization benefit of normalization layers: Sharpness reduction. InAdvances in Neural Information Processing Systems, volume 35, pages 34689–34708, 2022
2022
-
[25]
Understanding gradient descent on the edge of stability in deep learning
Sanjeev Arora, Zhiyuan Li, and Abhishek Panigrahi. Understanding gradient descent on the edge of stability in deep learning. InInternational Conference on Machine Learning, pages 948–1024. PMLR, 2022
2022
-
[26]
Understanding black-box predictions via influence functions
Pang Wei Koh and Percy Liang. Understanding black-box predictions via influence functions. InInternational Conference on Machine Learning, volume 70 ofProceedings of Machine Learning Research, pages 1885–1894. PMLR, 2017
2017
-
[27]
Does learning require memorization? A short tale about a long tail
Vitaly Feldman. Does learning require memorization? A short tale about a long tail. In Proceedings of the 52nd Annual ACM SIGACT Symposium on Theory of Computing, pages 954–959. ACM, 2020
2020
-
[28]
What neural networks memorize and why: Discovering the long tail via influence estimation
Vitaly Feldman and Chiyuan Zhang. What neural networks memorize and why: Discovering the long tail via influence estimation. InAdvances in Neural Information Processing Systems, volume 33, 2020
2020
-
[29]
Mariya Toneva, Alessandro Sordoni, Remi Tachet des Combes, Adam Trischler, Yoshua Bengio, and Geoffrey J. Gordon. An empirical study of example forgetting during deep neural network learning. InInternational Conference on Learning Representations, 2019
2019
-
[30]
Smith, and Yejin Choi
Swabha Swayamdipta, Roy Schwartz, Nicholas Lourie, Yizhong Wang, Hannaneh Hajishirzi, Noah A. Smith, and Yejin Choi. Dataset cartography: Mapping and diagnosing datasets with training dynamics. InEmpirical Methods in Natural Language Processing, pages 9275–9293. Association for Computational Linguistics, 2020. 11
2020
-
[31]
Deep learning on a data diet: Finding important examples early in training
Mansheej Paul, Surya Ganguli, and Gintare Karolina Dziugaite. Deep learning on a data diet: Finding important examples early in training. InAdvances in Neural Information Processing Systems, volume 34, 2021. arXiv:2107.07075
-
[32]
Gradient starvation: A learning proclivity in neural networks
Mohammad Pezeshki, Sékou-Oumar Kaba, Yoshua Bengio, Aaron Courville, Doina Precup, and Guillaume Lajoie. Gradient starvation: A learning proclivity in neural networks. InAdvances in Neural Information Processing Systems, volume 34, 2021
2021
-
[33]
Outliers with opposing signals have an outsized effect on neural network optimization
Elan Rosenfeld and Andrej Risteski. Outliers with opposing signals have an outsized effect on neural network optimization. InInternational Conference on Learning Representations, 2024
2024
-
[34]
Ben Sorscher, Robert Geirhos, Shashank Shekhar, Surya Ganguli, and Ari S. Morcos. Beyond neural scaling laws: Beating power law scaling via data pruning. InAdvances in Neural Information Processing Systems, volume 35, 2022
2022
-
[35]
Aitor Lewkowycz, Yasaman Bahri, Ethan Dyer, Jascha Sohl-Dickstein, and Guy Gur-Ari. The large learning rate phase of deep learning: The catapult mechanism.arXiv preprint arXiv:2003.02218, 2020
-
[36]
Fantastic generalization measures and where to find them
Yiding Jiang, Behnam Neyshabur, Hossein Mobahi, Dilip Krishnan, and Samy Bengio. Fantastic generalization measures and where to find them. InInternational Conference on Learning Representations, 2020
2020
-
[37]
Exploring generalization in deep learning
Behnam Neyshabur, Srinadh Bhojanapalli, David McAllester, and Nathan Srebro. Exploring generalization in deep learning. InAdvances in Neural Information Processing Systems, volume 30, 2017
2017
-
[38]
Towards Understanding Generalization of Deep Learning: Perspective of Loss Landscapes
Lei Wu, Zhanxing Zhu, and Weinan E. Towards understanding generalization of deep learning: Perspective of loss landscapes.arXiv preprint arXiv:1706.10239, 2017
work page internal anchor Pith review Pith/arXiv arXiv 2017
-
[39]
Averaging weights leads to wider optima and better generalization
Pavel Izmailov, Dmitrii Podoprikhin, Timur Garipov, Dmitry Vetrov, and Andrew Gordon Wilson. Averaging weights leads to wider optima and better generalization. InConference on Uncertainty in Artificial Intelligence, 2018
2018
-
[40]
Understanding the unstable convergence of gradient descent
Kwangjun Ahn, Jingzhao Zhang, and Suvrit Sra. Understanding the unstable convergence of gradient descent. InInternational Conference on Machine Learning, volume 162 ofProceedings of Machine Learning Research, pages 247–257. PMLR, 2022
2022
-
[41]
Learning threshold neurons via edge of stability
Kwangjun Ahn, Sébastien Bubeck, Sinho Chewi, Yin Tat Lee, Felipe Suarez, and Yi Zhang. Learning threshold neurons via edge of stability. InAdvances in Neural Information Processing Systems, volume 36, 2023
2023
-
[42]
Adam: A Method for Stochastic Optimization
Diederik P. Kingma and Jimmy Ba. Adam: A method for stochastic optimization.arXiv preprint arXiv:1412.6980, 2014
work page internal anchor Pith review Pith/arXiv arXiv 2014
-
[43]
Boris T. Polyak. Some methods of speeding up the convergence of iteration methods.USSR Computational Mathematics and Mathematical Physics, 4(5):1–17, 1964. 12 A Experimental setup A.1 Architecture We use a fully connected MLP that flattens each input image to a vector, then applies two hidden linear layers of width 512 with ReLU activations, followed by a...
1964
discussion (0)
Sign in with ORCID, Apple, or X to comment. Anyone can read and Pith papers without signing in.