Recognition: no theorem link
NE2025: An Updated Electron Density Model for the Galactic Interstellar Medium
Pith reviewed 2026-05-16 03:21 UTC · model grok-4.3
The pith
NE2025 refits the thick disk, thin disk, and spiral arms of the NE2001 model and adds refined clumps, delivering 20 times better median pulsar distance accuracy and 100 percent better scattering predictions than NE2001.
A machine-rendered reading of the paper's core claim, the machinery that carries it, and where it could break.
Core claim
The updated model, NE2025, provides a factor of 20× improvement in median distance prediction accuracy and 100% median improvement in scattering predictions based on DM, relative to NE2001. There is a 15× improvement in median distance prediction accuracy relative to YMW16.
Load-bearing premise
That the 171 parallax and globular-cluster distances plus the 568 scattering measurements are representative enough to refit the global disk and arm parameters without residual bias from unmodeled small-scale structures or selection effects in the sample.
Figures


read the original abstract
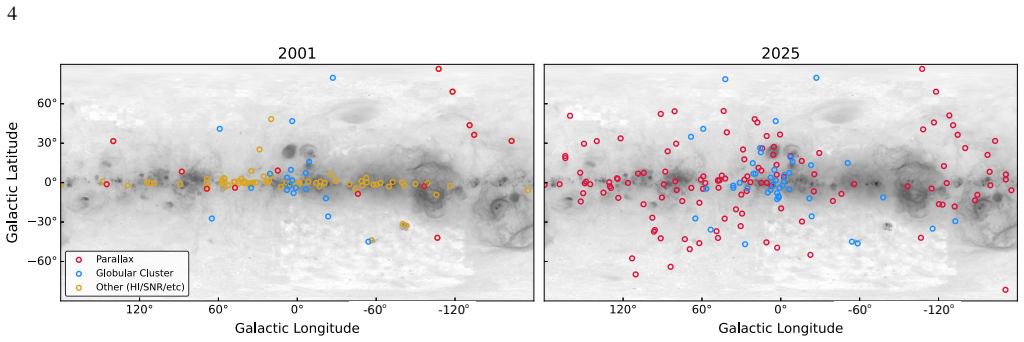
Free electrons in the Galactic interstellar medium (ISM) disperse and scatter coherent radio waves, by amounts that depend on the distance to the radio source. Models of the Galactic electron density are thus widely used to predict distances and scattering of compact radio sources (including pulsars, fast radio bursts (FRBs), and long-period transients), in addition to mitigating ISM foregrounds in Galactic and extragalactic studies. We use a sample of 171 precise pulsar distances, based entirely on parallaxes and globular cluster associations, as well as scattering measurements of 568 pulsars, active galactic nuclei, and masers, to update the NE2001 Galactic electron density model. We refit the thick and thin disks and three of the spiral arms. The new parameters for these large-scale components significantly repartition free electrons between the thick disk and spiral arms, thereby correcting NE2001's systematic underestimation of pulsar distance and scattering. Sightlines with excessive dispersion and scattering are used to identify new clumps that are added to the model, in addition to refining clumps that were already included (e.g., Cygnus, Vela, and Gum). The Galactic Center component is revised, yielding scattering time predictions that are $10^3$ times smaller than the Galactic Center in NE2001. The updated model, NE2025, provides a factor of $20\times$ improvement in median distance prediction accuracy and $100\%$ median improvement in scattering predictions based on DM, relative to NE2001. There is a $15\times$ improvement in median distance prediction accuracy relative to YMW16. NE2025 is available on Github and the Python Package Interface.
Editorial analysis
A structured set of objections, weighed in public.
Referee Report
Summary. The manuscript updates the NE2001 Galactic electron density model to NE2025 by refitting the thick and thin disks, three spiral-arm parameters, adding new dense clumps for deviant sightlines, and revising the Galactic Center component. It uses 171 precise distances (parallaxes and globular-cluster associations) and 568 scattering measurements to derive the new parameters and claims a 20× improvement in median distance prediction accuracy and 100% median improvement in scattering predictions relative to NE2001, plus a 15× distance accuracy gain versus YMW16. The updated model is released on GitHub with a Python interface.
Significance. If the reported gains are shown to generalize, NE2025 would be a useful incremental improvement to a standard tool for converting dispersion measures to distances and predicting scattering for pulsars, FRBs, and other compact radio sources. The incorporation of high-precision parallax distances strengthens the constraints on the large-scale disk and arm components and addresses NE2001's known underestimation of distances. The revision of the Galactic Center scattering term is a clear technical advance.
major comments (2)
- [Abstract and Results] Abstract and Results: The 20× median distance improvement and 100% scattering improvement are computed by comparing NE2025 predictions directly against the identical 171 distances and 568 scattering values used to optimize the thick-disk, thin-disk, spiral-arm, and new-clump parameters. Because new clumps are explicitly added for sightlines that deviate in this dataset, the quoted factors measure in-sample residual reduction rather than independent predictive accuracy. A cross-validation split or held-out test set must be shown to support the generalization claim.
- [Model Fitting] Model Fitting section: The refit increases model complexity through data-driven addition of new clumps without reporting parameter covariances, uncertainties, or a formal selection metric (e.g., AIC or out-of-sample score). This makes it difficult to judge whether the reported repartitioning of electrons between the thick disk and arms is robust or overfit to the particular sample of 171+568 sightlines.
minor comments (2)
- [Abstract] Abstract: The phrase '100% median improvement in scattering predictions based on DM' is ambiguous; state explicitly whether this is a factor-of-two reduction in median error or another quantitative definition.
- [Data Availability] Data Availability: Provide the exact GitHub commit hash or tagged release version for the NE2025 code and parameter files to ensure long-term reproducibility.
Circularity Check
NE2025 'prediction' gains (20x distance, 100% scattering) are in-sample fit quality on the 171+568 data used to refit parameters and add clumps
specific steps
-
fitted input called prediction
[Abstract]
"We use a sample of 171 precise pulsar distances, based entirely on parallaxes and globular cluster associations, as well as scattering measurements of 568 pulsars, active galactic nuclei, and masers, to update the NE2001 Galactic electron density model. ... The updated model, NE2025, provides a factor of 20× improvement in median distance prediction accuracy and 100% median improvement in scattering predictions based on DM, relative to NE2001. There is a 15× improvement in median distance prediction accuracy relative to YMW16."
Parameters for large-scale components and new clumps are optimized on the 171 distances plus 568 scattering values; the quoted 'prediction accuracy' and 'improvement' factors are then computed by feeding those same data back through the refitted model and comparing outputs to the inputs, so the reported gains equal in-sample residual reduction rather than out-of-sample prediction.
full rationale
The paper explicitly uses the 171 parallax/GC distances and 568 scattering measurements both to refit thick/thin disks, spiral arms, and to identify/add new clumps for deviant sightlines, then reports the median accuracy improvements by comparing the resulting model's DM-to-distance and scattering outputs directly against those same input data. This reduces the central performance claims to measures of training-set reproduction rather than independent generalization. No external test set or cross-validation is described in the provided text, and the evaluation is not separated from the fitting process.
Axiom & Free-Parameter Ledger
free parameters (4)
- thick-disk scale height and density
- thin-disk parameters
- three spiral-arm parameters
- clump densities and sizes
axioms (1)
- domain assumption Galactic free-electron density can be decomposed into a thick disk, thin disk, spiral arms, and discrete clumps whose functional forms are known a priori.
invented entities (1)
-
new dense clumps
no independent evidence
Forward citations
Cited by 4 Pith papers
-
The RRATalog: a Galactic census of rotating radio transients
RRATs number up to 400000 in the Galaxy with a birth rate of at most 1.4 per century, comparable in size to pulsars at high luminosities and consistent with supernova rates.
-
Great Walls of Cosmic Baryons in the Northern Sky
FRB dispersion measures reveal a large-scale excess of ionized gas in the northern sky spatially aligned with the Ursa Major supercluster.
-
FAST Polarization Catalog of FRB 20240114A
A polarization catalog of 6,131 bursts from FRB 20240114A reveals linearly decreasing rotation measure, stable dispersion measure, high linear polarization fractions, low circular polarization, and a broad distributio...
-
The one and the only: the pulsar - white dwarf system in NGC 6749
A 20-year timing solution for PSR J1905+0154A confirms a helium white dwarf companion of 0.17-0.19 solar masses with 0.4-0.7 Gyr cooling age, but the system's 4.5-sigma velocity excess suggests it may not be bound to ...
Reference graph
Works this paper leans on
-
[1]
2023, MNRAS, 524, 2966, doi: 10.1093/mnras/stad2047
Abbate, F., Noutsos, A., Desvignes, G., et al. 2023, MNRAS, 524, 2966, doi: 10.1093/mnras/stad2047
-
[2]
Agazie, G., Alam, M. F., Anumarlapudi, A., et al. 2023, ApJL, 951, L9, doi: 10.3847/2041-8213/acda9a
-
[3]
Alam, M. F., Arzoumanian, Z., Baker, P. T., et al. 2021, ApJS, 252, 4, doi: 10.3847/1538-4365/abc6a0
-
[4]
Anderson, L. D., Armentrout, W. P., Johnstone, B. M., et al. 2015, ApJS, 221, 26, doi: 10.1088/0067-0049/221/2/26
-
[5]
Anderson, L. D., Bania, T. M., Balser, D. S., et al. 2014, ApJS, 212, 1, doi: 10.1088/0067-0049/212/1/1
-
[6]
Arzoumanian, Z., Chernoff, D. F., & Cordes, J. M. 2002, ApJ, 568, 289, doi: 10.1086/338805
-
[7]
Askew, J., Reardon, D. J., Shannon, R. M., et al. 2025, arXiv e-prints, arXiv:2512.10489, doi: 10.48550/arXiv.2512.10489 Astropy Collaboration, Robitaille, T. P., Tollerud, E. J., et al. 2013, A&A, 558, A33, doi: 10.1051/0004-6361/201322068 Astropy Collaboration, Price-Whelan, A. M., Sip˝ocz, B. M., et al. 2018, AJ, 156, 123, doi: 10.3847/1538-3881/aabc4f...
-
[8]
Avedisova, V . S., & Palous, J. 1989, Bulletin of the Astronomical Institutes of Czechoslovakia, 40, 42
work page 1989
-
[9]
Reynolds, J. E. 1990, Nature, 343, 240, doi: 10.1038/343240a0
-
[10]
2025, ApJ, 983, 20, doi: 10.3847/1538-4357/ad9d0b
Bally, J., Crowe, S., Fedriani, R., et al. 2025, ApJ, 983, 20, doi: 10.3847/1538-4357/ad9d0b
-
[11]
Battersby, C., Walker, D. L., Barnes, A., et al. 2025, ApJ, 984, 156, doi: 10.3847/1538-4357/adb5f0
-
[12]
2021, MNRAS, 505, 5957, doi: 10.1093/mnras/stab1474
Baumgardt, H., & Vasiliev, E. 2021, MNRAS, 505, 5957, doi: 10.1093/mnras/stab1474
-
[13]
Benaglia, P., & Cappa, C. E. 1999, A&A, 346, 979
work page 1999
-
[14]
Berkhuijsen, E. M., & M¨uller, P. 2008, A&A, 490, 179, doi: 10.1051/0004-6361:200809675
-
[15]
Bhat, N. D. R., & Gupta, Y . 2002, ApJ, 567, 342, doi: 10.1086/338488
-
[16]
Bock, J. J., Aboobaker, A. M., Adamo, J., et al. 2025, arXiv e-prints, arXiv:2511.02985, doi: 10.48550/arXiv.2511.02985
-
[17]
C., Deller, A., Demorest, P., et al
Bower, G. C., Deller, A., Demorest, P., et al. 2014, ApJL, 780, L2, doi: 10.1088/2041-8205/780/1/L2
-
[18]
Brisken, W. F., Benson, J. M., Goss, W. M., & Thorsett, S. E. 2002, ApJ, 571, 906, doi: 10.1086/340098
-
[19]
Brisken, W. F., Thorsett, S. E., Golden, A., & Goss, W. M. 2003, ApJL, 593, L89, doi: 10.1086/378184
-
[20]
Cha, A. N., Sembach, K. R., & Danks, A. C. 1999, ApJL, 515, L25, doi: 10.1086/311968
-
[21]
Chatterjee, S., Cordes, J. M., Lazio, T. J. W., et al. 2001, ApJ, 550, 287, doi: 10.1086/319735
-
[22]
Chatterjee, S., Cordes, J. M., Vlemmings, W. H. T., et al. 2004, ApJ, 604, 339, doi: 10.1086/381748
-
[23]
Chatterjee, S., Vlemmings, W. H. T., Brisken, W. F., et al. 2005, ApJL, 630, L61, doi: 10.1086/491701
-
[24]
Chatterjee, S., Brisken, W. F., Vlemmings, W. H. T., et al. 2009, ApJ, 698, 250, doi: 10.1088/0004-637X/698/1/250
-
[25]
2025, ApJ, 988, 176, doi: 10.3847/1538-4357/ade688
Chen, X., Wang, S., & Chen, X. 2025, ApJ, 988, 176, doi: 10.3847/1538-4357/ade688
-
[26]
Cook, A. M., Bhardwaj, M., Gaensler, B. M., et al. 2023, ApJ, 946, 58, doi: 10.3847/1538-4357/acbbd0
-
[27]
Cordes, J. M., & Chernoff, D. F. 1998, ApJ, 505, 315, doi: 10.1086/306138
-
[28]
NE2001.I. A New Model for the Galactic Distribution of Free Electrons and its Fluctuations
Cordes, J. M., & Lazio, T. J. W. 2002, arXiv e-prints, astro. https://arxiv.org/abs/astro-ph/0207156 —. 2003, arXiv e-prints, astro, doi: 10.48550/arXiv.astro-ph/0301598
work page internal anchor Pith review Pith/arXiv arXiv doi:10.48550/arxiv.astro-ph/0301598 2002
-
[29]
Cordes, J. M., Ocker, S. K., & Chatterjee, S. 2022, ApJ, 931, 88, doi: 10.3847/1538-4357/ac6873
-
[30]
Cordes, J. M., & Rickett, B. J. 1998, ApJ, 507, 846, doi: 10.1086/306358
-
[31]
1991, Nature, 354, 121, doi: 10.1038/354121a0
Ryan, M. 1991, Nature, 354, 121, doi: 10.1038/354121a0
-
[32]
Radio Wave Propagation and the Provenance of Fast Radio Bursts
Wasserman, I. 2016, arXiv e-prints, arXiv:1605.05890. https://arxiv.org/abs/1605.05890
work page internal anchor Pith review Pith/arXiv arXiv 2016
-
[33]
P., Werner, M., Akeson, R., et al
Crill, B. P., Werner, M., Akeson, R., et al. 2020, in Society of Photo-Optical Instrumentation Engineers (SPIE) Conference
work page 2020
-
[34]
11443, Space Telescopes and Instrumentation 2020:
Series, V ol. 11443, Space Telescopes and Instrumentation 2020:
work page 2020
-
[35]
Optical, Infrared, and Millimeter Wave, ed. M. Lystrup & M. D. Perrin, 114430I, doi: 10.1117/12.2567224 32
-
[36]
Das, J., Roy, J., Freire, P. C. C., et al. 2025a, ApJ, 988, 161, doi: 10.3847/1538-4357/ade052 —. 2025b, arXiv e-prints, arXiv:2512.11058, doi: 10.48550/arXiv.2512.11058
-
[37]
2021, MNRAS, 500, 655, doi: 10.1093/mnras/staa3299
Das, S., Mathur, S., Gupta, A., Nicastro, F., & Krongold, Y . 2021, MNRAS, 500, 655, doi: 10.1093/mnras/staa3299
-
[38]
Deller, A. T., Tingay, S. J., Bailes, M., & Reynolds, J. E. 2009, ApJ, 701, 1243, doi: 10.1088/0004-637X/701/2/1243
-
[39]
Deller, A. T., Archibald, A. M., Brisken, W. F., et al. 2012, ApJL, 756, L25, doi: 10.1088/2041-8205/756/2/L25
-
[40]
Deller, A. T., Goss, W. M., Brisken, W. F., et al. 2019, ApJ, 875, 100, doi: 10.3847/1538-4357/ab11c7
-
[41]
Deneva, J. S., Cordes, J. M., & Lazio, T. J. W. 2009, ApJL, 702, L177, doi: 10.1088/0004-637X/702/2/L177
-
[42]
Dexter, J., Deller, A., Bower, G. C., et al. 2017, MNRAS, 471, 3563, doi: 10.1093/mnras/stx1777
-
[43]
Ding, H., Deller, A. T., Freire, P. C. C., & Petrov, L. 2024a, A&A, 691, A47, doi: 10.1051/0004-6361/202451492
-
[44]
Ding, H., Deller, A. T., Swiggum, J. K., et al. 2024b, ApJ, 970, 90, doi: 10.3847/1538-4357/ad4883
-
[45]
Ding, H., Deller, A. T., Lower, M. E., et al. 2020, MNRAS, 498, 3736, doi: 10.1093/mnras/staa2531
-
[46]
Ding, H., Deller, A. T., Stappers, B. W., et al. 2023, MNRAS, 519, 4982, doi: 10.1093/mnras/stac3725
-
[47]
Dodson, R., Legge, D., Reynolds, J. E., & McCulloch, P. M. 2003, ApJ, 596, 1137, doi: 10.1086/378089
-
[48]
Drory, N., Blanc, G. A., Kreckel, K., et al. 2024, arXiv e-prints, arXiv:2405.01637, doi: 10.48550/arXiv.2405.01637
-
[49]
P., Falcke, H., Karuppusamy, R., et al
Eatough, R. P., Falcke, H., Karuppusamy, R., et al. 2013, Nature, 501, 391, doi: 10.1038/nature12499 EPTA Collaboration, Antoniadis, J., Babak, S., et al. 2023, A&A, 678, A48, doi: 10.1051/0004-6361/202346841
-
[50]
Fey, A. L., Spangler, S. R., & Cordes, J. M. 1991, ApJ, 372, 132, doi: 10.1086/169960
-
[51]
Fey, A. L., Spangler, S. R., & Mutel, R. L. 1989, ApJ, 337, 730, doi: 10.1086/167144
-
[52]
Finkbeiner, D. P. 2003, ApJS, 146, 407, doi: 10.1086/374411
-
[53]
Fonseca, E., Stairs, I. H., & Thorsett, S. E. 2014, ApJ, 787, 82, doi: 10.1088/0004-637X/787/1/82
-
[54]
Frail, D. A., Diamond, P. J., Cordes, J. M., & van Langevelde, H. J. 1994, ApJL, 427, L43, doi: 10.1086/187360
-
[55]
Frail, D. A., & Weisberg, J. M. 1990, AJ, 100, 743, doi: 10.1086/115556
-
[56]
Gaensler, B. M., Madsen, G. J., Chatterjee, S., & Mao, S. A. 2008, Publications of the Astronomical Society of Australia, 25, 184, doi: 10.1071/AS08004
-
[57]
Gao, B. A., Zucker, C., Sridharan, T. K., et al. 2025, ApJ, 987, 73, doi: 10.3847/1538-4357/add7d8
-
[58]
Gao, X. Y ., Reich, P., Hou, L. G., Reich, W., & Han, J. L. 2019, A&A, 623, A105, doi: 10.1051/0004-6361/201834092
-
[59]
Geiger, A., Cordes, J. M., Lam, M. T., et al. 2024, arXiv e-prints, arXiv:2411.08191, doi: 10.48550/arXiv.2411.08191 —. 2025, ApJ, 986, 191, doi: 10.3847/1538-4357/add0b6
-
[60]
2016, A&A, 586, A50, doi: 10.1051/0004-6361/201526100 G´omez, G
Ginsburg, A., Henkel, C., Ao, Y ., et al. 2016, A&A, 586, A50, doi: 10.1051/0004-6361/201526100 G´omez, G. C., Benjamin, R. A., & Cox, D. P. 2001, AJ, 122, 908, doi: 10.1086/321180
-
[61]
Guillemot, L., Smith, D. A., Laffon, H., et al. 2016, AAP, 587, A109, doi: 10.1051/0004-6361/201527847
-
[62]
Han, J. L., Wang, C., Wang, P. F., et al. 2021, Research in Astronomy and Astrophysics, 21, 107, doi: 10.1088/1674-4527/21/5/107
-
[63]
Han, J. L., Zhou, D. J., Wang, C., et al. 2025, Research in Astronomy and Astrophysics, 25, 014001, doi: 10.1088/1674-4527/ada3b7
-
[64]
Harding, D. S., & Harding, A. K. 1982, ApJ, 257, 603, doi: 10.1086/160016
-
[65]
2025, ApJ, 979, 196, doi: 10.3847/1538-4357/ada4af
He, Q., Shi, X., & Li, G. 2025, ApJ, 979, 196, doi: 10.3847/1538-4357/ada4af
-
[66]
1998, ApJ, 498, 689, doi: 10.1086/305574
Heiles, C. 1998, ApJ, 498, 689, doi: 10.1086/305574
-
[67]
Hewish, A., Bell, S. J., Pilkington, J. D. H., Scott, P. F., & Collins, R. A. 1968, Nature, 217, 709, doi: 10.1038/217709a0
-
[68]
2022, ApJ, 925, 165, doi: 10.3847/1538-4357/ac449a
Heywood, I., Rammala, I., Camilo, F., et al. 2022, ApJ, 925, 165, doi: 10.3847/1538-4357/ac449a
-
[69]
Hou, L. G., & Han, J. L. 2014, A&A, 569, A125, doi: 10.1051/0004-6361/201424039
-
[70]
Hutschenreuter, S., Anderson, C. S., Betti, S., et al. 2022, A&A, 657, A43, doi: 10.1051/0004-6361/202140486
-
[71]
Deller, A. T. 2018, ApJ, 864, 26, doi: 10.3847/1538-4357/aad084
-
[72]
Jing, W. C., Han, J. L., Hong, T., et al. 2023, MNRAS, 523, 4949, doi: 10.1093/mnras/stad1782
-
[73]
Jing, W. C., Han, J. L., Wang, C., et al. 2025, arXiv e-prints, arXiv:2506.14519, doi: 10.48550/arXiv.2506.14519
-
[74]
Johnston, S., Kramer, M., Lorimer, D. R., et al. 2006, MNRAS, 373, L6, doi: 10.1111/j.1745-3933.2006.00232.x
-
[75]
Kalberla, P. M. W., & Kerp, J. 2009, ARA&A, 47, 27, doi: 10.1146/annurev-astro-082708-101823
-
[76]
Keating, L. C., & Pen, U.-L. 2020, MNRAS, 496, L106, doi: 10.1093/mnrasl/slaa095
-
[77]
Kirsten, F., Bhat, N. D. R., Meyers, B. W., et al. 2019, ApJ, 874, 179, doi: 10.3847/1538-4357/ab0c05
-
[78]
Kramer, M., Stairs, I. H., Manchester, R. N., et al. 2021, Physical Review X, 11, 041050, doi: 10.1103/PhysRevX.11.041050
-
[79]
Krishnakumar, M. A., Joshi, B. C., & Manoharan, P. K. 2025, arXiv e-prints, arXiv:2510.19388, doi: 10.48550/arXiv.2510.19388 33
-
[80]
Manoharan, P. K. 2015, ApJ, 804, 23, doi: 10.1088/0004-637X/804/1/23
discussion (0)
Sign in with ORCID, Apple, or X to comment. Anyone can read and Pith papers without signing in.