First M87 Event Horizon Telescope Results. III. Data Processing and Calibration
Pith reviewed 2026-05-25 15:28 UTC · model grok-4.3
The pith
EHT observations of M87, after calibration with three pipelines, detect two nulls in correlated flux density at 3.4 and 8.3 giga-lambda plus day-scale variability in closure quantities.
A machine-rendered reading of the paper's core claim, the machinery that carries it, and where it could break.
Core claim
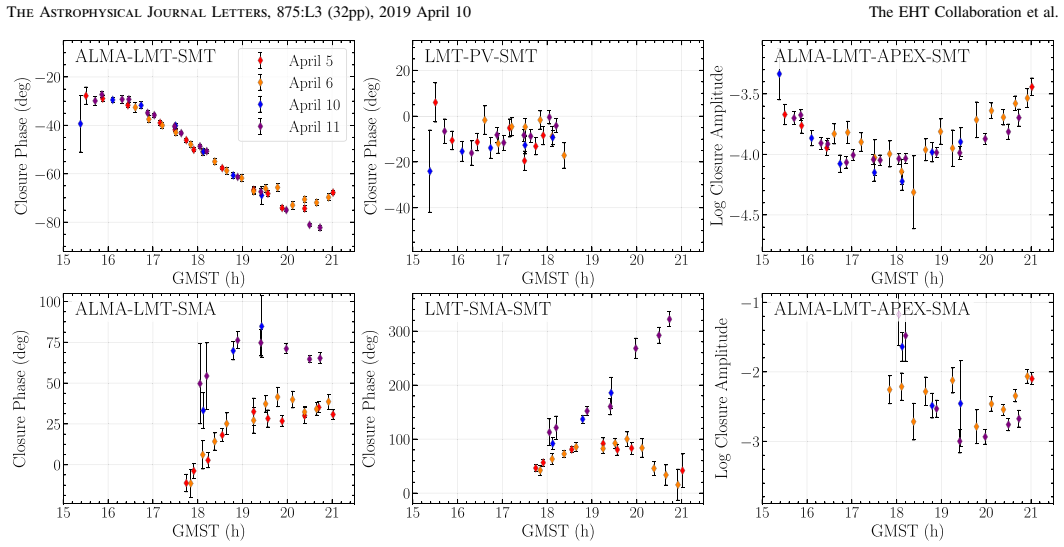
The M87 data reveal the presence of two nulls in correlated flux density at ~3.4 and ~8.3 giga-lambda and temporal evolution in closure quantities, indicating intrinsic variability of compact structure on a timescale of days, or several light-crossing times for a few billion solar-mass black hole. These measurements provide the first opportunity to image horizon-scale structure in M87.
What carries the argument
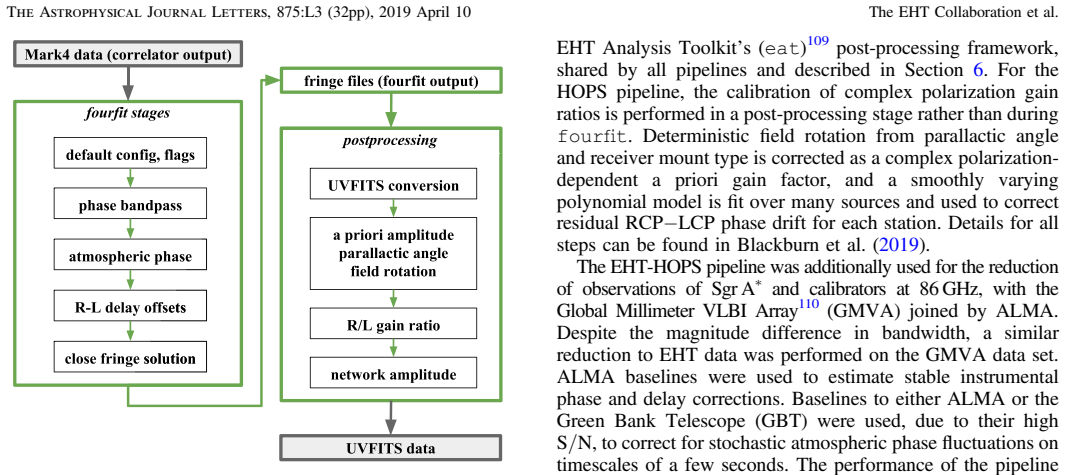
Three independent pipelines for phase calibration and fringe detection, each adapted to the EHT's wide bandwidth and heterogeneous array, that produce consistent total-intensity amplitude and phase products.
If this is right
- The calibrated data set is the first that can be used to reconstruct horizon-scale images of M87.
- The detected variability occurs on timescales comparable to a few light-crossing times of a several-billion-solar-mass black hole.
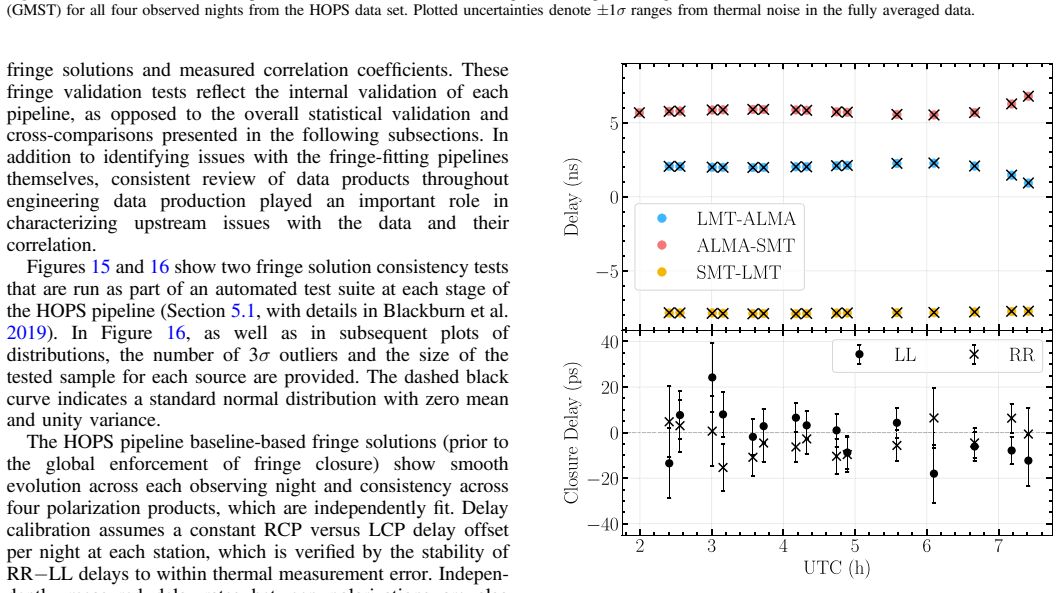
- Baseline systematic errors are limited to 2 percent in amplitude and 1 degree in phase across the array.
- The same processing methods apply to the simultaneous 3C 279 observations obtained in the same campaign.
Where Pith is reading between the lines
- Future multi-epoch EHT campaigns can track structural changes in M87 on weekly or shorter cadences to map the flow near the event horizon.
- The null positions supply direct constraints on the radial brightness profile that any image-reconstruction algorithm must reproduce.
- Comparison of these 1.3 mm nulls with simultaneous or near-simultaneous observations at other wavelengths can test whether the same emitting region is seen across frequencies.
Load-bearing premise
The quality-assurance tests across the three pipelines are sufficient to confirm that remaining systematic errors stay below 2 percent in amplitude and 1 degree in phase and do not create or erase the reported nulls and variability.
What would settle it
An independent reduction of the same 2017 raw visibility data that finds no nulls near 3.4 or 8.3 giga-lambda or that shows closure quantities stable to within the stated error bars across the week-long campaign.
Figures


read the original abstract
We present the calibration and reduction of Event Horizon Telescope (EHT) 1.3mm radio wavelength observations of the supermassive black hole candidate at the center of the radio galaxy M87 and the quasar 3C 279, taken during the 2017 April 5-11 observing campaign. These global very long baseline interferometric observations include for the first time the highly sensitive Atacama Large Millimeter/submillimeter Array (ALMA); reaching an angular resolution of 25 micro-as, with characteristic sensitivity limits of ~1 mJy on baselines to ALMA and ~10 mJy on other baselines. The observations present challenges for existing data processing tools, arising from the rapid atmospheric phase fluctuations, wide recording bandwidth, and highly heterogeneous array. In response, we developed three independent pipelines for phase calibration and fringe detection, each tailored to the specific needs of the EHT. The final data products include calibrated total intensity amplitude and phase information. They are validated through a series of quality assurance tests that show consistency across pipelines and set limits on baseline systematic errors of 2% in amplitude and 1 degree in phase. The M87 data reveal the presence of two nulls in correlated flux density at ~3.4 and ~8.3 giga-lambda and temporal evolution in closure quantities, indicating intrinsic variability of compact structure on a timescale of days, or several light-crossing times for a few billion solar-mass black hole. These measurements provide the first opportunity to image horizon-scale structure in M87.
Editorial analysis
A structured set of objections, weighed in public.
Referee Report
Summary. The paper presents the calibration and reduction of 2017 EHT 1.3 mm VLBI observations of M87 and 3C 279 using three independent pipelines developed to address rapid atmospheric phase fluctuations, wide bandwidth, and array heterogeneity. The final calibrated amplitude and phase products are validated via QA tests demonstrating inter-pipeline consistency that sets baseline systematic error limits of 2% in amplitude and 1° in phase. The M87 data exhibit nulls in correlated flux density at ~3.4 and ~8.3 Gλ together with temporal evolution in closure quantities, interpreted as evidence for intrinsic variability of compact structure on daily timescales.
Significance. If the reported systematic bounds hold, the work supplies the first calibrated dataset enabling horizon-scale imaging of M87 and provides direct evidence of structural variability on timescales of a few light-crossing times for a ~few-billion-solar-mass black hole. The multi-pipeline consistency check is a methodological strength that increases in the null detections and variability signal.
major comments (1)
- [Quality assurance tests / pipeline validation] The QA validation (described in the abstract and presumably detailed in the methods/results sections on pipeline comparison) derives the 2% amplitude / 1° phase systematic floor solely from inter-pipeline agreement. This approach does not include explicit tests isolating possible common-mode errors (e.g., shared tropospheric models, fringe-fitting assumptions, or a-priori phase screens) that could systematically bias amplitudes near the reported nulls at ~3.4 and ~8.3 Gλ, where even small residual errors could create or mask a true null.
Simulated Author's Rebuttal
We thank the referee for their careful reading and constructive feedback on our manuscript describing the EHT 2017 data calibration for M87 and 3C 279. We address the single major comment below.
read point-by-point responses
-
Referee: The QA validation (described in the abstract and presumably detailed in the methods/results sections on pipeline comparison) derives the 2% amplitude / 1° phase systematic floor solely from inter-pipeline agreement. This approach does not include explicit tests isolating possible common-mode errors (e.g., shared tropospheric models, fringe-fitting assumptions, or a-priori phase screens) that could systematically bias amplitudes near the reported nulls at ~3.4 and ~8.3 Gλ, where even small residual errors could create or mask a true null.
Authors: The three pipelines were developed independently with distinct algorithmic approaches to phase calibration and fringe detection, each tailored differently to the EHT-specific challenges of rapid atmospheric fluctuations, wide bandwidth, and heterogeneous array. This design reduces the probability of shared common-mode errors. The nulls at ~3.4 and ~8.3 Gλ appear consistently across all pipelines, as do the temporal trends in closure quantities. While dedicated end-to-end simulations isolating every conceivable common-mode bias were not performed, the inter-pipeline consistency combined with closure-phase and closure-amplitude QA tests already constrains residual systematics. We will add a short subsection in the revised manuscript explicitly discussing the methodological differences between pipelines and why common-mode errors are unlikely to produce the observed nulls. revision: partial
Circularity Check
No circularity: observational calibration validated by independent pipelines
full rationale
The paper describes development of three independent calibration pipelines for EHT data, followed by QA tests that establish consistency-based bounds on systematics (2% amplitude, 1° phase). The reported nulls at ~3.4 and ~8.3 Gλ and closure-phase evolution are direct measurements from the calibrated visibilities, not quantities derived from or fitted to those same measurements. No self-definitional steps, fitted inputs renamed as predictions, or load-bearing self-citations appear in the derivation chain; the validation relies on cross-pipeline agreement rather than any internal reduction to the target observables. This is a standard data-processing workflow whose central claims remain externally falsifiable against the raw visibilities.
Axiom & Free-Parameter Ledger
Forward citations
Cited by 7 Pith papers
-
GRMHD accretion beyond the black hole paradigm: Light from within the shadow
3D GRMHD simulations of accretion onto a JMN-1 horizonless singularity produce a magnetically arrested disk with an accretion rate of ~3e-6 Eddington matching M87* observations and EHT-consistent images, plus central ...
-
Photon rings and shadows of black holes with non-minimal couplings between curvature and electromagnetic field
Three distinct non-minimal curvature-EM couplings produce different enlargements or reductions of black hole shadows and alter photon ring separations in characteristic ways.
-
Dimming of Photon Ring due to Photon-Axion Conversion around Kerr Black Holes
Photon-axion conversion near Kerr black holes produces dimming of photon spectral luminosity that increases with black hole spin, magnetic field strength, and photon-axion coupling, most efficiently at high frequencies.
-
Effective null geodesics and black hole images in Kruglov nonlinear electrodynamics
In Kruglov's Born-Infeld-type nonlinear electrodynamics, the effective photon geometry around a charged black hole produces q-dependent shifts in light deflection, shadow radius, and accretion disk images, including s...
-
Effective null geodesics and black hole images in Kruglov nonlinear electrodynamics
In Kruglov nonlinear electrodynamics, small positive values of the parameter q produce stable photon orbits outside the event horizon and modify black hole shadows and relativistic images even when the spacetime metri...
-
Roche limit and stellar disruption in the Simpson--Visser spacetime
Tidal forces in the Simpson-Visser spacetime produce Roche radii for stars that depend on observer type and regularization, with some disruptions occurring outside the event horizon for supermassive black holes.
-
Observational Signatures of Rotating Ay\'{o}n-Beato-Garc\'{i}a Black Holes: Shadows, Accretion Disks and Images
Rotating Ayón-Beato-García black holes produce smaller and sometimes D-shaped shadows whose size constrains the charge parameter ζ to the range 0.132811M–0.213607M when matched to EHT observations of M87* and Sgr A*.
Reference graph
Works this paper leans on
- [1]
-
[2]
Alef, W., & Porcas, R. W. 1986, A&A, 168, 365
work page 1986
-
[3]
Baars, J. W. M. 2007, The Paraboloidal Re flector Antenna in Radio Astronomy and Communication (Berlin: Springer )
work page 2007
- [4]
-
[5]
P., Jordán, A., Mei, S., et al
Blakeslee, J. P., Jordán, A., Mei, S., et al. 2009, ApJ, 694, 556
work page 2009
-
[6]
Cantiello, M., Blakeslee, J. P., Ferrarese, L., et al. 2018, ApJ, 856, 126
work page 2018
-
[7]
Chael, A. A., Johnson, M. D., Bouman, K. L., et al. 2018, ApJ, 857, 23
work page 2018
- [8]
-
[9]
Chang, C. S., Ros, E., Kovalev, Y. Y., & Lister, M. L. 2010, A&A, 515, A38
work page 2010
-
[10]
Cotton, W. D. 1995, in ASP Conf. Ser. 82, Very Long Baseline Interferometry and the VLBA, ed. J. A. Zensus, P. J. Diamond, & P. J. Napier (San
work page 1995
-
[11]
Deller, A. T., Brisken, W. F., Phillips, C. J., et al. 2011, PASP, 123, 275
work page 2011
-
[12]
2010, in 10th European VLBI Network Symp
Doeleman, S. 2010, in 10th European VLBI Network Symp. and EVN Users Meeting: VLBI and the New Generation of Radio Arrays (Trieste: SISSA), 53
work page 2010
-
[13]
2009, in Astro2010: The Astronomy and Astrophysics Decadal Survey, Science White Papers, 68
Doeleman, S., Agol, E., Backer, D., et al. 2009, in Astro2010: The Astronomy and Astrophysics Decadal Survey, Science White Papers, 68
work page 2009
- [14]
-
[15]
Doeleman, S. S., Weintroub, J., Rogers, A. E. E., et al. 2008, Natur, 455, 78 EHT Collaboration et al. 2019a, ApJL, 875, L1 (Paper I ) EHT Collaboration et al. 2019b, ApJL, 875, L2 (Paper II ) EHT Collaboration et al. 2019c, ApJL, 875, L4 (Paper IV ) EHT Collaboration et al. 2019d, ApJL, 875, L5 (Paper V ) EHT Collaboration et al. 2019e, ApJL, 875, L6 (Paper VI )
work page 2008
-
[16]
High-Angular-Resolution and High-Sensitivity Science Enabled by Beamformed ALMA
Fish, V., Alef, W., Anderson, J., et al. 2013, arXiv: 1309.3519
work page internal anchor Pith review Pith/arXiv arXiv 2013
-
[17]
Fish, V. L., Doeleman, S. S., Beaudoin, C., et al. 2011, ApJL, 727, L36
work page 2011
-
[18]
Fish, V. L., Johnson, M. D., Doeleman, S. S., et al. 2016, ApJ, 820, 90
work page 2016
-
[19]
Gebhardt, K., Adams, J., Richstone, D., et al. 2011, ApJ, 729, 119
work page 2011
-
[20]
Goddi, C., Marti-Vidal, I., Messias, H., et al. 2019, PASP, in press
work page 2019
-
[21]
Greisen, E. W. 2003, in Information Handling in Astronomy —Historical
work page 2003
-
[22]
Greisen, E. W. 2011, AIPS Memo Series, 114r (New Mexico, USA: Socorro )
work page 2011
-
[23]
Hunter, J. D. 2007, CSE, 9, 90
work page 2007
- [24]
-
[25]
2018, EHT Memo Series, 2018-CE-01
Issaoun, S., Falcke, H., Friberg, P., et al. 2018, EHT Memo Series, 2018-CE-01
work page 2018
-
[26]
Issaoun, S., Folkers, T. W., Blackburn, L., et al. 2017a, EHT Memo Series, 2017-CE-02
work page 2017
-
[27]
Issaoun, S., Folkers, T. W., Marrone, D. P., et al. 2017b, EHT Memo Series, 2017-CE-03
work page 2017
-
[28]
Issaoun, S., Johnson, M. D., Blackburn, L., et al. 2019, ApJ, 871, 30
work page 2019
-
[29]
Janssen, M., Goddi, C., van Bemmel, I. M., et al. 2019a, arXiv: 1902.01749
work page internal anchor Pith review Pith/arXiv arXiv 1902
-
[30]
2019b, EHT Memo Series, 2019- CE-01
Janssen, M., Issaoun, S., Blackburn, L., et al. 2019b, EHT Memo Series, 2019- CE-01
work page 2019
-
[31]
Jewell, P. R. 2002, in ASP Conf. Ser. 278, Single-Dish Radio Astronomy: Techniques and Applications, ed. S. Stanimirovic et al. (San Francisco, CA: ASP), 313
work page 2002
-
[32]
Johnson, M. D., Fish, V. L., Doeleman, S. S., et al. 2015, Sci, 350, 1242
work page 2015
-
[33]
2001, SciPy: Open source scienti fic tools for Python
Jones, E., Oliphant, T., Peterson, P., et al. 2001, SciPy: Open source scienti fic tools for Python
work page 2001
-
[34]
Kettenis, M., van Langevelde, H. J., Reynolds, C., & Cotton, B. 2006, in ASP Conf. Ser. 351, Astronomical Data Analysis Software and Systems XV, ed. C. Gabriel et al. (San Francisco, CA: ASP ), 497
work page 2006
-
[35]
2016, in Positioning and Power in Academic Publishing: Players, Agents and Agendas, ed
Kluyver, T., Ragan-Kelley, B., Pérez, F., et al. 2016, in Positioning and Power in Academic Publishing: Players, Agents and Agendas, ed. F. Loizides & B. Schmidt (IOS Press ),8 7
work page 2016
-
[36]
Kutner, M. L. 1978, ApJL, 19, 81
work page 1978
- [37]
- [38]
-
[39]
Mangum, J. G. 1993, PASP, 105, 117
work page 1993
-
[40]
Mangum, J. G. 2002, ALMA Memo Series, 434 Martí-Vidal, I., Roy, A., Conway, J., & Zensus, A. J. 2016, A&A, 587, A143
work page 2002
-
[41]
Matsushita, S., Saito, M., Sakamoto, K., et al. 2006, Proc. SPIE, 6275, 62751W 29 The Astrophysical Journal Letters, 875:L3 (32pp), 2019 April 10 The EHT Collaboration et al
work page 2006
-
[42]
Matthews, L. D., Crew, G. B., Doeleman, S. S., et al. 2018, PASP, 130, 015002
work page 2018
-
[43]
McKinney, W. 2010, in Proc. 9th Python in Science Conf., ed. S. van der Walt & J. Millman (Washington, D.C.: IEEE ),5 1
work page 2010
-
[44]
P., Waters, B., Schiebel, D., Young, W., & Golap, K
McMullin, J. P., Waters, B., Schiebel, D., Young, W., & Golap, K. 2007, in ASP Conf. Ser. 376, Astronomical Data Analysis Software and Systems XVI, ed. R. A. Shaw, F. Hill, & D. J. Bell (San Francisco, CA: ASP ), 127
work page 2007
- [45]
- [46]
- [47]
-
[48]
Rogers, A. E. E., Doeleman, S. S., & Moran, J. M. 1995, AJ, 109, 1391
work page 1995
-
[49]
Romney, J. D. 1995, in ASP Conf. Ser. 82, Very Long Baseline Interferometry and the VLBA, ed. J. A. Zensus, P. J. Diamond, & P. J. Napier (San
work page 1995
- [50]
-
[51]
2011, login: The USENIX Magazine, 36, 42 The Astropy Collaboration, Robitaille, T
Tange, O. 2011, login: The USENIX Magazine, 36, 42 The Astropy Collaboration, Robitaille, T. P., Tollerud, E. J., et al. 2013, A&A, 558, A33 The Astropy Collaboration, Price-Whelan, A. M., Sip őcz, B. M., et al. 2018, AJ, 156, 123
work page 2011
-
[52]
Thompson, A. R., Moran, J. M., Jr., & , G. W. S. 2017, Interferometry and Synthesis in Radio Astronomy (3rd ed.; Berlin: Springer )
work page 2017
-
[53]
Ulich, B. L., & Haas, R. W. 1976, ApJS, 30, 247 van Cittert, P. H. 1934, Phy, 1, 201 van der Walt, S., Colbert, S. C., & Varoquaux, G. 2011, CSE, 13, 22
work page 1976
-
[54]
Vertatschitsch, L., Primiani, R., Young, A., et al. 2015, PASP, 127, 1226
work page 2015
-
[55]
Walker, R. C., Hardee, P. E., Davies, F. B., Ly, C., & Junor, W. 2018, ApJ, 855, 128
work page 2018
-
[56]
Whitney, A. R., Beaudoin, C. J., Cappallo, R. J., et al. 2013, PASP, 125, 196
work page 2013
-
[57]
R., Cappallo, R., Aldrich, W., et al
Whitney, A. R., Cappallo, R., Aldrich, W., et al. 2004, RaSc, 39, RS1007
work page 2004
-
[58]
2019, EHT Memo Series, 2019- CE-02
Wielgus, M., Blackburn, L., Issaoun, S., et al. 2019, EHT Memo Series, 2019- CE-02
work page 2019
-
[59]
Wilkinson, P. N. 1989, in NATO Advanced Science Institutes (ASI) Series C, Vol. 283, ed. M. Felli & R. E. Spencer ( Berlin: Springer ), 69
work page 1989
-
[60]
Young, A., Primiani, R., Weintroub, J., et al. 2016, in 2016 IEEE Int. Symp., Phased Array Systems and Technology (ARRAY)( New York: IEEE ), 1
work page 2016
-
[61]
Zernike, F. 1938, Phy, 5, 785 The Event Horizon Telescope Collaboration, Kazunori Akiyama 1,2,3,4 , Antxon Alberdi 5 , Walter Alef 6, Keiichi Asada 7, Rebecca Azulay 8,9,6 , Anne-Kathrin Baczko 6 , David Ball 10, Mislav Balokovi ć4,11 , John Barrett 2 , Dan Bintley 12, Lindy Blackburn 4,11 , Wilfred Boland 13, Katherine L. Bouman 4,11,14 , Geoffrey C. Bow...
work page 1938
discussion (0)
Sign in with ORCID, Apple, or X to comment. Anyone can read and Pith papers without signing in.