Recognition: no theorem link
Why Network Segmentation Projects Fail
Pith reviewed 2026-05-10 17:18 UTC · model grok-4.3
The pith
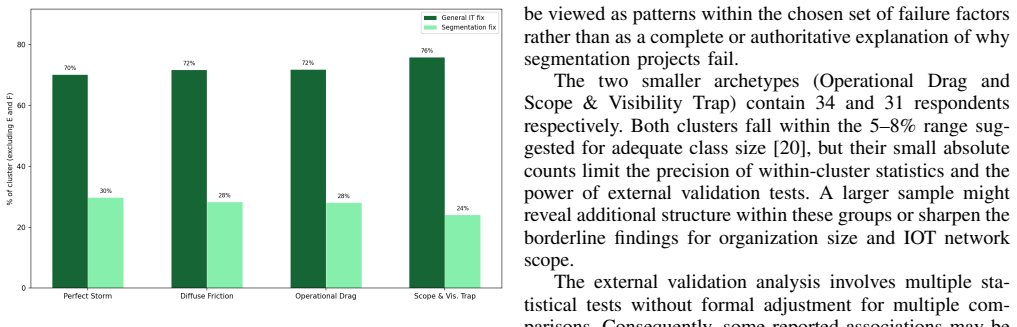
Failed network segmentation projects fall into four distinct archetypes, with practitioners favoring general IT fixes equally across all types.
A machine-rendered reading of the paper's core claim, the machinery that carries it, and where it could break.
Core claim
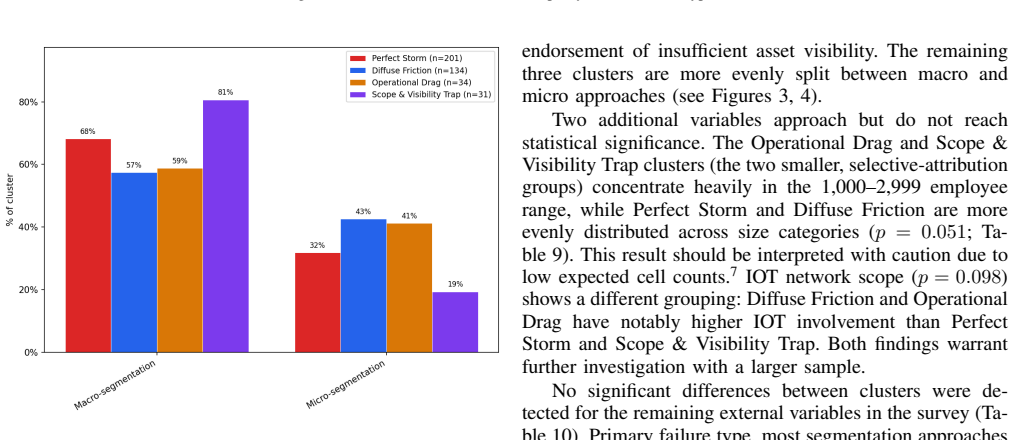
The central claim is that survey responses analyzed through clustering yield four distinct archetypes of failed network segmentation projects. Practitioners in all four archetypes propose general IT project management fixes over segmentation-specific fixes in the same ratio.
What carries the argument
A two-part failure framework that separately measures general IT project failure factors and segmentation-specific technical and operational barriers, then applies clustering analysis to surface archetypes.
If this is right
- Failed projects can be mapped to one of four archetypes to guide diagnosis.
- Remediation efforts should emphasize general IT project management practices in every archetype.
- Segmentation-specific technical barriers appear secondary to broader project execution issues.
- Standard project management training could improve outcomes for future segmentation work.
Where Pith is reading between the lines
- Organizations might gain more from strengthening overall project discipline than from specialized segmentation training alone.
- The consistent preference for general fixes suggests segmentation knowledge is not the main bottleneck in these failures.
- The archetypes could function as a practical checklist for teams starting new segmentation efforts.
- Testing whether improved project management methods raise segmentation success rates would be a direct next step.
Load-bearing premise
Self-reported survey responses from 400 U.S.-based practitioners accurately and representatively capture the primary causes of segmentation project failures without significant bias or omission.
What would settle it
A follow-up survey using the same framework but with a substantially different practitioner sample that produces more, fewer, or differently distributed archetypes, or that shows unequal ratios of general versus specific fix recommendations.
Figures


read the original abstract
Network segmentation is a foundational enterprise security control. Despite its recognized benefits, segmentation initiatives frequently fail in practice, and the field lacks a systematic empirical explanation for why these projects do not achieve their intended outcomes. This paper presents an empirical study of failed segmentation projects based on a survey of 400 U.S.-based\ network security practitioners. The survey was grounded in a two-part failure framework that separately measures general IT project failure factors and segmentation-specific technical and operational barriers. Clustering analysis of the responses reveals four distinct failure archetypes. Surprisingly, practitioners across all four archetypes propose general IT project management fixes over segmentation-specific fixes in the same ratio.
Editorial analysis
A structured set of objections, weighed in public.
Referee Report
Summary. The paper presents an empirical study of failed network segmentation projects based on a survey of 400 U.S.-based network security practitioners. Grounded in a two-part failure framework that separately measures general IT project failure factors and segmentation-specific technical and operational barriers, the authors apply clustering analysis to the responses and identify four distinct failure archetypes. They further report that practitioners across all four archetypes propose general IT project management fixes over segmentation-specific fixes in the same ratio.
Significance. If the clustering and ratio findings are statistically validated, the work would provide a systematic empirical account of segmentation project failures in enterprise security, highlighting four archetypes and a counterintuitive uniformity in recommended remedies. This could inform both research on security project management and practical guidance, moving beyond anecdotal explanations. The empirical survey approach itself is a strength in a field often dominated by technical descriptions.
major comments (3)
- [Clustering Analysis] Clustering Analysis section: The identification of four distinct failure archetypes is presented without any description of the clustering algorithm, the procedure for selecting k=4, or internal validation metrics (silhouette score, Davies-Bouldin index, or bootstrap stability). This is load-bearing because the archetypes are the primary output and the basis for all subsequent claims about fix proposals.
- [Analysis of Proposed Fixes] Analysis of Proposed Fixes section: The central observation that the ratio of general IT project management fixes to segmentation-specific fixes is identical across the four archetypes is stated without a formal statistical test (chi-square test for homogeneity, permutation test, or multinomial logistic regression) to assess whether the ratios differ significantly between clusters. This leaves the 'surprisingly same ratio' claim as an untested visual impression rather than a supported result.
- [Survey Methodology] Survey Methodology section: No details are provided on survey design, sampling frame, response rate, or mitigation of self-report bias for the 400 responses. These omissions directly affect the reliability of the data used for both clustering and the fix-ratio analysis, which are the paper's core contributions.
minor comments (2)
- [Introduction] The two-part failure framework would benefit from an explicit table or diagram showing the measured factors in each part to improve readability.
- [Abstract] The abstract states the sample size and key findings but could more precisely indicate that the uniform ratio is an observational claim pending statistical confirmation.
Simulated Author's Rebuttal
Thank you for the opportunity to revise our manuscript in response to the referee's comments. We have carefully considered each point and will make the necessary revisions to address the concerns regarding methodological transparency and statistical rigor.
read point-by-point responses
-
Referee: [Clustering Analysis] Clustering Analysis section: The identification of four distinct failure archetypes is presented without any description of the clustering algorithm, the procedure for selecting k=4, or internal validation metrics (silhouette score, Davies-Bouldin index, or bootstrap stability). This is load-bearing because the archetypes are the primary output and the basis for all subsequent claims about fix proposals.
Authors: We agree with the referee that additional details on the clustering procedure are essential for transparency and reproducibility. In the revised version, we will describe the clustering algorithm employed, the criteria used to determine the number of clusters (k=4), and include relevant validation metrics such as the silhouette score and Davies-Bouldin index to support the choice of four archetypes. revision: yes
-
Referee: [Analysis of Proposed Fixes] Analysis of Proposed Fixes section: The central observation that the ratio of general IT project management fixes to segmentation-specific fixes is identical across the four archetypes is stated without a formal statistical test (chi-square test for homogeneity, permutation test, or multinomial logistic regression) to assess whether the ratios differ significantly between clusters. This leaves the 'surprisingly same ratio' claim as an untested visual impression rather than a supported result.
Authors: The referee is correct that a formal statistical test would strengthen the claim of uniformity in the proposed fixes across archetypes. We will conduct a chi-square test of homogeneity on the proportions of fix types across the four clusters and report the results in the revised manuscript. This will either confirm the lack of significant differences or lead to a more nuanced interpretation. revision: yes
-
Referee: [Survey Methodology] Survey Methodology section: No details are provided on survey design, sampling frame, response rate, or mitigation of self-report bias for the 400 responses. These omissions directly affect the reliability of the data used for both clustering and the fix-ratio analysis, which are the paper's core contributions.
Authors: We recognize the importance of providing comprehensive survey methodology details. The revised manuscript will include an expanded section detailing the survey design process, the sampling approach used to recruit the 400 U.S.-based practitioners, the achieved response rate, and the measures implemented to address potential self-report biases, such as ensuring respondent anonymity and including attention checks. revision: yes
Circularity Check
No circularity: purely empirical survey with independent data collection and analysis
full rationale
The paper is an empirical study based on a survey of 400 practitioners using a two-part failure framework, followed by clustering to identify archetypes and observation of fix ratios. No equations, derivations, fitted parameters, or self-citations are load-bearing in the central claims. The clustering and ratio observations are presented as direct outputs of the survey data without reduction to prior inputs or self-referential definitions. This matches the default expectation for non-circular empirical work; the skeptic concerns address statistical validation rather than circularity.
Axiom & Free-Parameter Ledger
axioms (1)
- domain assumption The two-part failure framework separately and comprehensively measures general IT project failure factors and segmentation-specific technical and operational barriers.
Reference graph
Works this paper leans on
-
[1]
Network segmentation security with the implementation of threats,
R. Bredesen and S. Mujeye, “Network segmentation security with the implementation of threats,” inProc. 8th Int. Conf. Softw. Eng. Inf. Manag. (ICSIM). ACM, 2025, pp. 137–141, doi: https://doi.or g/10.1145/3725899.3725920
-
[2]
Network segmentation as a defense mechanism for securing enterprise networks,
N. R. Kotha, “Network segmentation as a defense mechanism for securing enterprise networks,”Turk. J. Comput. Math. Educ., vol. 11, no. 3, pp. 3023–3030, 2020, doi: https://doi.org/10.61841/turcomat. v11i3.14942
-
[3]
Towards automated cyber decision support: A case study on network segmentation for security,
N. Wagner, C. S ¸. S ¸ahin, M. Winterrose, J. Riordan, J. Pena, D. Han- son, and W. W. Streilein, “Towards automated cyber decision support: A case study on network segmentation for security,” inProc. IEEE Symp. Ser. Comput. Intell. (SSCI). Lexington, MA, USA: IEEE, 2016, pp. 1–10, doi: https://doi.org/10.1109/SSCI.2016.7849908
-
[4]
The causes of project failure,
J. K. Pinto and S. J. Mantel, “The causes of project failure,”IEEE Trans. Eng. Manag., vol. 37, no. 4, pp. 269–276, 1990, doi: https: //doi.org/10.1109/17.62322
-
[5]
Overspend? late? failure? what the data say about IT project risk in the public sector,
A. Budzier and B. Flyvbjerg, “Overspend? late? failure? what the data say about IT project risk in the public sector,” arXiv preprint, 2013, arXiv:1304.4525, https://arxiv.org/abs/1304.4525
-
[6]
Perceived causes of software project failures—an analysis of their relationships,
T. O. A. Lehtinen, M. V . M ¨antyl¨a, J. Vanhanen, J. Itkonen, and C. Lassenius, “Perceived causes of software project failures—an analysis of their relationships,”Inf. Softw. Technol., vol. 56, no. 6, pp. 623–643, 2014, doi: https://doi.org/10.1016/j.infsof.2014.01.015
-
[7]
IT project failures, causes and cures,
S. Lauesen, “IT project failures, causes and cures,”IEEE Access, vol. 8, pp. 72 059–72 067, 2020, doi: https://doi.org/10.1109/ACCE SS.2020.2986545
-
[8]
Mitigating risk of failure in information technology projects: Causes and mechanisms,
J. Schmidt, “Mitigating risk of failure in information technology projects: Causes and mechanisms,”Proj. Leadersh. Soc., vol. 4, p. 100097, 2023, doi: https://doi.org/10.1016/j.plas.2023.100097
-
[9]
V . Rodr ´ıguez Montequ ´ın, J. Villanueva Balsera, S. M. Cousil- las Fern´andez, and F. Ortega Fern´andez, “Exploring project complex- ity through project failure factors: Analysis of cluster patterns using self-organizing maps,”Complexity, vol. 2018, no. 1, pp. 1–17, 2018, doi: https://doi.org/10.1155/2018/9496731
-
[10]
The segmentation report,
Cisco Systems Inc., “The segmentation report,” White paper, Oct. 2025, [Online]. Available: https://www.cisco.com/c/en/us/products/c ollateral/security/hypershield/segmentation-report.pdf
2025
-
[11]
Segmentation impact study,
Akamai Technologies, “Segmentation impact study,” White paper, Sep. 2025, [Online]. Available: https://www.akamai.com/site/en/d ocuments/research-paper/segmentation-impact-study-2025.pdf
2025
-
[12]
The state of segmentation 2023,
——, “The state of segmentation 2023,” White paper, Oct. 2023, [Online]. Accessed: Feb. 2025
2023
-
[13]
A taxonomy of segmentation in network security,
R. Dube, “A taxonomy of segmentation in network security,”IEEE Access, vol. 14, pp. 16 921–16 935, 2026, doi: https://doi.org/10.110 9/ACCESS.2026.3658250
-
[14]
A formal approach to network segmentation,
N. Mhaskar, M. Alabbad, and R. Khedri, “A formal approach to network segmentation,”Comput. Secur., vol. 103, p. 102162, 2021, doi: https://doi.org/10.1016/j.cose.2020.102162
-
[15]
A technique for the measurement of attitudes,
R. Likert, “A technique for the measurement of attitudes,”Arch. Psychol., vol. 22, no. 140, pp. 1–55, 1932
1932
-
[16]
Maximum likelihood from incomplete data via the EM algorithm,
A. P. Dempster, N. M. Laird, and D. B. Rubin, “Maximum likelihood from incomplete data via the EM algorithm,”J. Roy. Statist. Soc. Ser. B, vol. 39, no. 1, pp. 1–38, 1977
1977
-
[17]
L. M. Collins and S. T. Lanza,Latent Class and Latent Transition Analysis: With Applications in the Social, Behavioral, and Health Sciences. Hoboken, NJ, USA: Wiley, 2010, ISBN: 978-0470228395
2010
-
[18]
Latent class cluster analysis,
J. K. Vermunt and J. Magidson, “Latent class cluster analysis,” inAp- plied Latent Class Analysis, J. A. Hagenaars and A. L. McCutcheon, Eds. Cambridge, U.K.: Cambridge Univ. Press, 2002, pp. 89–106, doi: https://doi.org/10.1017/CBO9780511499531.004. TABLE 14. CODEBOOK FOR FREE-FORM RESPONSE CODING. Code Name Definition Examples B1 Clear Goals Define goal...
-
[19]
K. L. Nylund, T. Asparouhov, and B. O. Muth ´en, “Deciding on the number of classes in latent class analysis and growth mixture modeling: A Monte Carlo simulation study,”Struct. Equ. Model., vol. 14, no. 4, pp. 535–569, 2007, doi: https://doi.org/10.1080/1070 5510701575396
-
[20]
Ten frequently asked questions about latent class analysis,
K. Nylund-Gibson and A. Y . Choi, “Ten frequently asked questions about latent class analysis,”Transl. Issues Psychol. Sci., vol. 4, no. 4, pp. 440–461, 2018, doi: https://doi.org/10.1037/tps0000176
-
[21]
K. P. Burnham and D. R. Anderson,Model Selection and Multimodel Inference: A Practical Information-Theoretic Approach, 2nd ed. New York, NY , USA: Springer, 2002, ISBN: 978-0387953649
2002
-
[22]
An entropy criterion for assessing the number of clusters in a mixture model,
G. Celeux and G. Soromenho, “An entropy criterion for assessing the number of clusters in a mixture model,”J. Classif., vol. 13, no. 2, pp. 195–212, 1996, doi: https://doi.org/10.1007/BF01246098
-
[23]
An empirical pooling approach for estimating marketing mix elas- ticities with PIMS data,
V . Ramaswamy, W. S. DeSarbo, D. J. Reibstein, and W. T. Robinson, “An empirical pooling approach for estimating marketing mix elas- ticities with PIMS data,”Market. Sci., vol. 12, no. 1, pp. 103–124, 1993, doi: https://doi.org/10.1287/mksc.12.1.103
-
[24]
Joanna Depledge.The Organization of Global Negotiations: Constructing the Climate Change Regime
K. E. Masyn, “Latent class analysis and finite mixture modeling,” inThe Oxford Handbook of Quantitative Methods: Vol. 2. Statistical Analysis, T. D. Little, Ed. New York, NY , USA: Oxford Univ. Press, 2013, pp. 551–611, doi: https://doi.org/10.1093/oxfordhb/978019993 4898.013.0025
-
[25]
Agresti,An Introduction to Categorical Data Analysis, 2nd ed
A. Agresti,An Introduction to Categorical Data Analysis, 2nd ed. Hoboken, NJ, USA: Wiley, 2007, ISBN: 978-0471226185
2007
-
[26]
Three approaches to qualitative content analysis,
H.-F. Hsieh and S. E. Shannon, “Three approaches to qualitative content analysis,”Qual. Health Res., vol. 15, no. 9, pp. 1277–1288, 2005, doi: https://doi.org/10.1177/1049732305276687
-
[27]
Washington, DC, USA: National Academies Press, 2025, ISBN: 978- 0-309-73489-9
National Academies of Sciences, Engineering, and Medicine,Cyber Hard Problems: Focused Steps Toward a Resilient Digital Future. Washington, DC, USA: National Academies Press, 2025, ISBN: 978- 0-309-73489-9
2025
-
[28]
Journal of Classification2(1), 193–218 (1985) https://doi.org/10.1007/BF01908075
L. Hubert and P. Arabie, “Comparing partitions,”J. Classif., vol. 2, no. 1, pp. 193–218, 1985, doi: https://doi.org/10.1007/BF01908075
-
[29]
G. J. McLachlan and D. Peel,Finite Mixture Models. New York, NY , USA: Wiley, 2000, ISBN: 978-0471006268
2000
discussion (0)
Sign in with ORCID, Apple, or X to comment. Anyone can read and Pith papers without signing in.